| Param | Original file | Final file |
|---|---|---|
| Filename | modeM0/AS1A07_113T01_9000003526_23820cztM0_level2.evt | modeM0/AS1A07_113T01_9000003526_23820cztM0_level2_quad_clean.evt |
| Size (bytes) | 3,543,157,440 | 402,736,320 |
| Size | 3.3 GB | 384.1 MB |
| Events in quadrant A | 15,828,509 | 2,593,482 |
| Events in quadrant B | 18,380,432 | 2,654,285 |
| Events in quadrant C | 16,186,467 | 2,581,736 |
| Events in quadrant D | 54,659,919 | 2,066,859 |
| Mode M9 | |||
|---|---|---|---|
| Quadrant | BADHDUFLAG | Total packets | Discarded packets |
| A | 0 | 24 | 0 |
| B | 0 | 24 | 0 |
| C | 0 | 24 | 0 |
| D | 0 | 24 | 0 |
| Mode SS | |||
|---|---|---|---|
| Quadrant | BADHDUFLAG | Total packets | Discarded packets |
| A | 0 | 676 | 0 |
| B | 0 | 676 | 0 |
| C | 0 | 676 | 0 |
| D | 0 | 676 | 0 |
| Mode M0 | |||
|---|---|---|---|
| Quadrant | BADHDUFLAG | Total packets | Discarded packets |
| A | 0 | 68827 | 5 |
| B | 0 | 75831 | 5 |
| C | 0 | 69320 | 6 |
| D | 0 | 185651 | 10 |
| Quadrant | Total seconds | Saturated seconds | Saturation percentage |
|---|---|---|---|
| A | 33459 | 368 | 1.099854% |
| B | 33460 | 1152 | 3.442917% |
| C | 33459 | 584 | 1.745420% |
| D | 33458 | 13753 | 41.105266% |
Noise dominated data is calculated using 1-second bins in cleaned event files. If a bin has >2000 counts, and if more than 50% of those come from <1% of pixels, then it is considered to be noise-dominated and hence unusable.
| Quadrant | # 1 sec bins | Bins with >0 counts | Bins with >2000 counts | High rate bins dominated by noise | Noise dominated (total time) | Noise dominated (detector-on time) | Marked lightcurve |
|---|---|---|---|---|---|---|---|
| A | 38352 | 33461 | 0 | 0 | 0.00% | 0.00% | 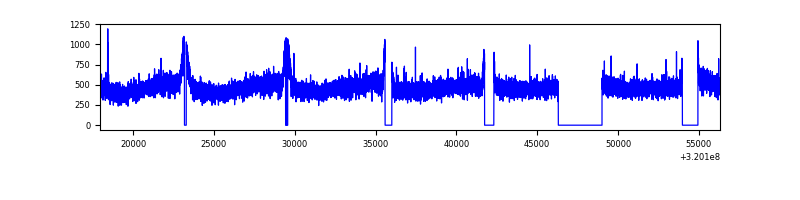 |
| B | 38352 | 33461 | 521 | 521 | 1.36% | 1.56% | 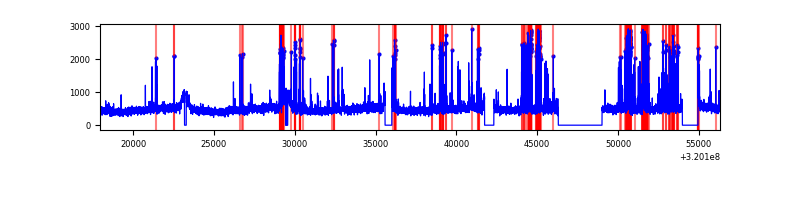 |
| C | 38351 | 33460 | 14 | 14 | 0.04% | 0.04% | 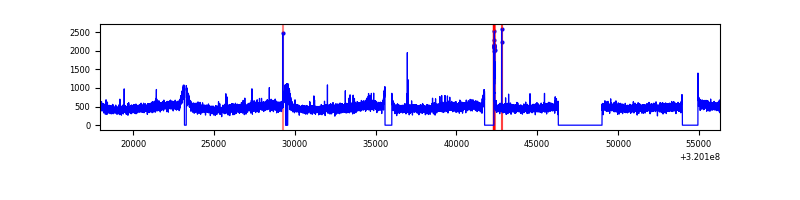 |
| D | 38350 | 33457 | 11990 | 11990 | 31.26% | 35.84% | 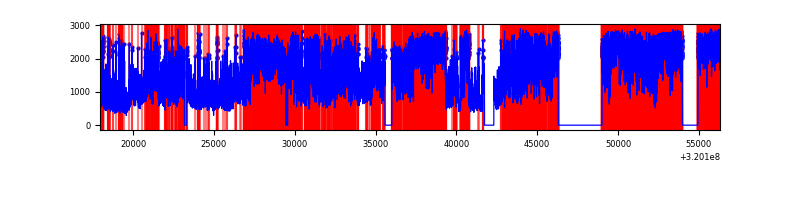 |
Top three noisy pixels from each quadrant. If the there are fewer than three noisy pixels in the level2.evt file, extra rows are filled as -1
| Pixel properties | Quadrant properties | ||||||
|---|---|---|---|---|---|---|---|
| Quadrant | DetID | PixID | Counts | Sigma | Mean | Median | Sigma |
| A | 13 | 254 | 53982 | 60.49 | 4100 | 4012 | 826.1 |
| A | 3 | 137 | 36965 | 39.89 | 4100 | 4012 | 826.1 |
| A | 0 | 226 | 35205 | 37.76 | 4100 | 4012 | 826.1 |
| B | 3 | 64 | 1592323 | 2054.16 | 4056 | 3950 | 773.2 |
| B | 15 | 33 | 744251 | 957.39 | 4056 | 3950 | 773.2 |
| B | 12 | 111 | 95288 | 118.12 | 4056 | 3950 | 773.2 |
| C | 14 | 238 | 628420 | 675.17 | 3949 | 3979 | 924.9 |
| C | 0 | 10 | 67541 | 68.73 | 3949 | 3979 | 924.9 |
| C | 7 | 247 | 56916 | 57.24 | 3949 | 3979 | 924.9 |
| D | 13 | 174 | 24651931 | 30069.4 | 3367 | 3273 | 819.7 |
| D | 8 | 195 | 14021654 | 17101.31 | 3367 | 3273 | 819.7 |
| D | 1 | 52 | 3017024 | 3676.54 | 3367 | 3273 | 819.7 |
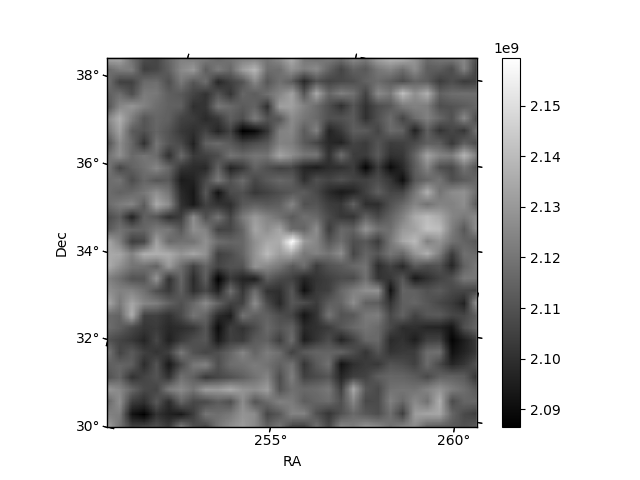
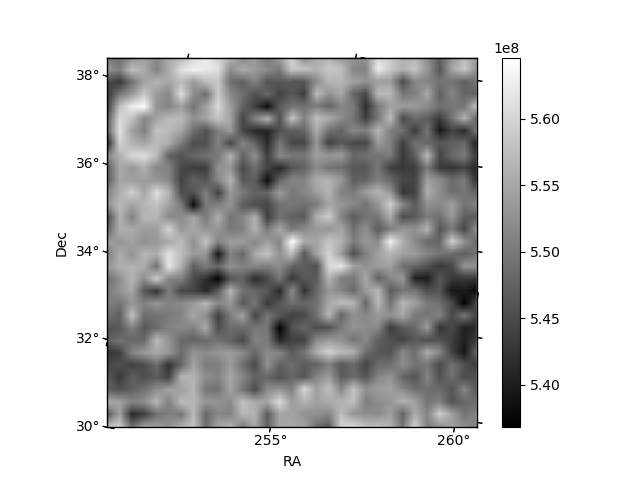
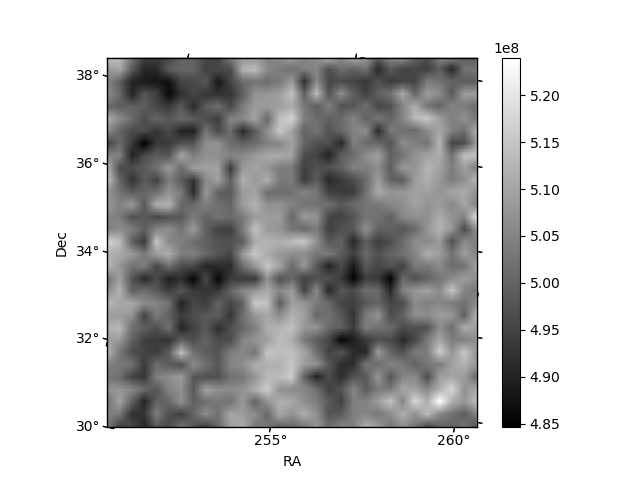
Histogram calculated using DETX and DETY for each event in the final _common_clean file
| Quadrant A |  |
 |
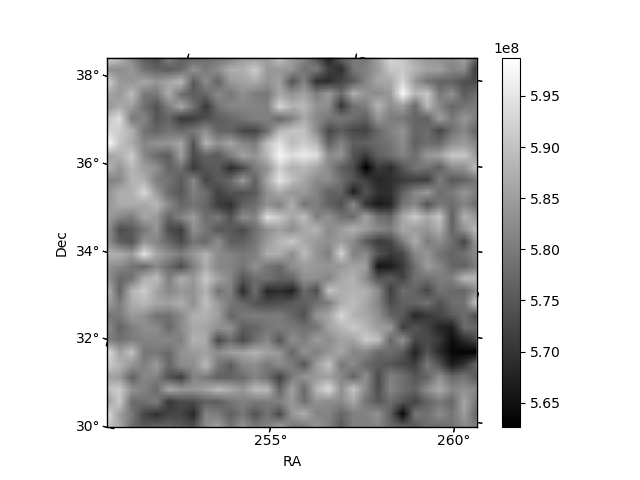
Quadrant B |
|---|---|---|---|
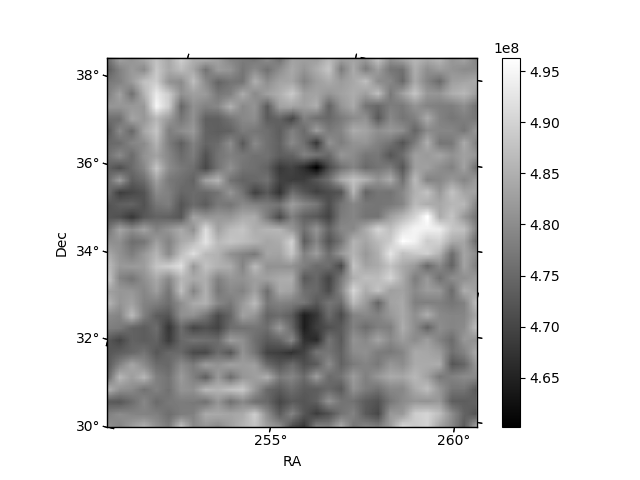
| Quadrant D |  |
 |
Quadrant C |
| Plot type | Count rate plots | Images |
|---|---|---|
| Comparison with Poisson distribution Blue bars denote a histogram of data divided into 1 sec bins. Red curve is a Poisson curve with rate = median count rate of data. |
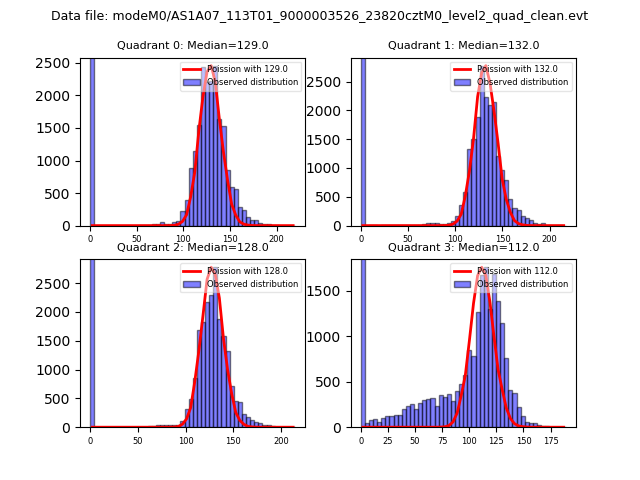 |
 |
| Quadrant-wise count rates Data is divided into 100 sec bins |
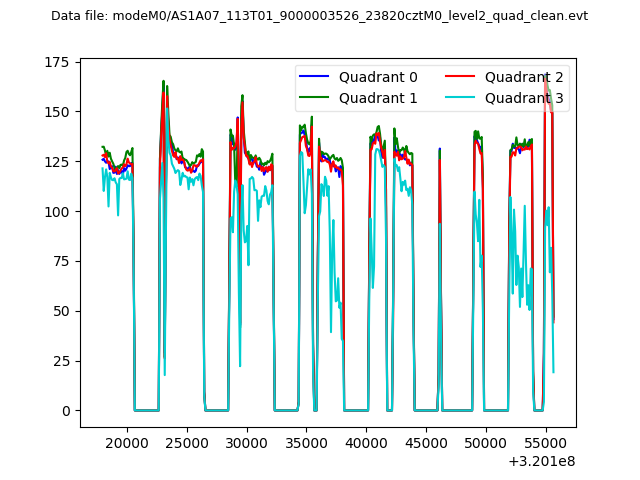 |
|
| Module-wise count rates for Quadrant A Data is divided into 100 sec bins |
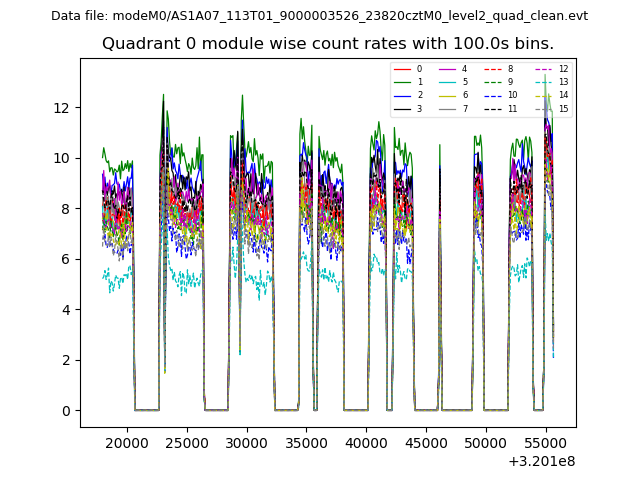 |
 |
| Module-wise count rates for Quadrant B Data is divided into 100 sec bins |
 |
 |
| Module-wise count rates for Quadrant C Data is divided into 100 sec bins |
 |
 |
| Module-wise count rates for Quadrant D Data is divided into 100 sec bins |
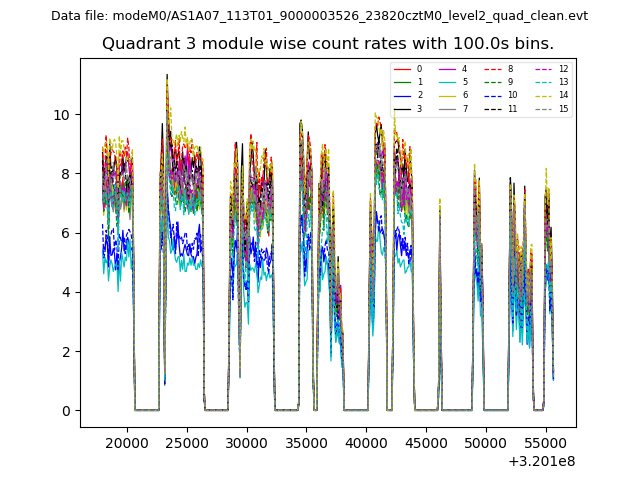 |
 |
| Parameter | Plot |
|---|---|
| CZT HV Monitor |  |
| D_VDD | 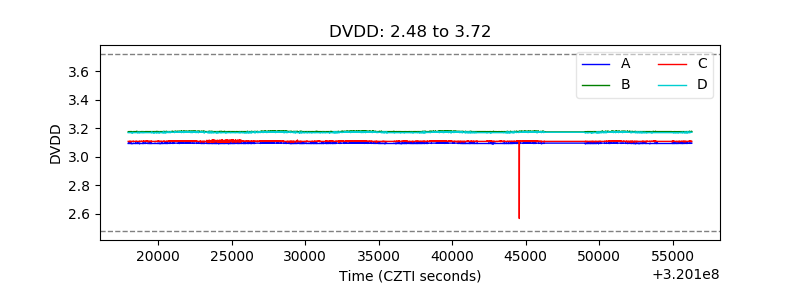 |
| Temperature 1 | 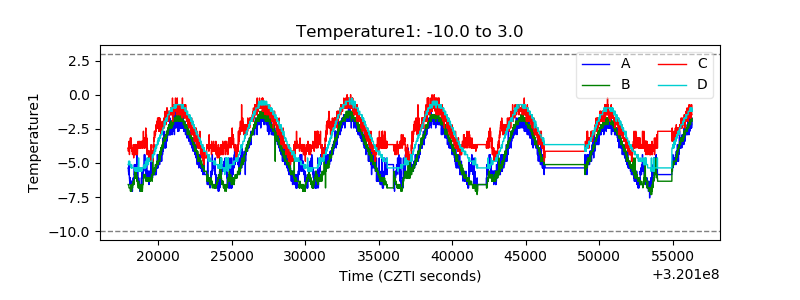 |
| Veto HV Monitor | 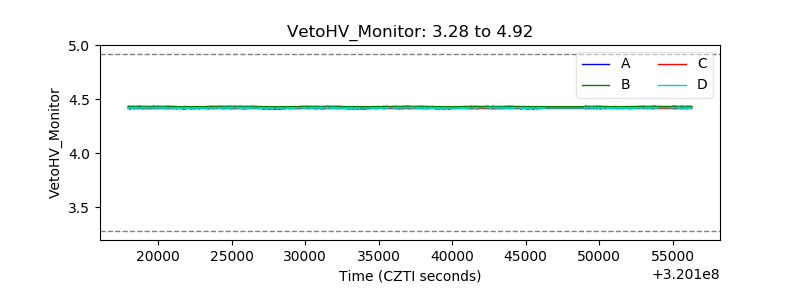 |
| Veto LLD | 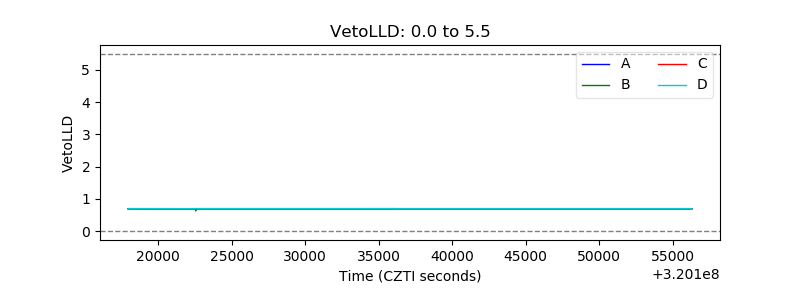 |
| Alpha Counter | 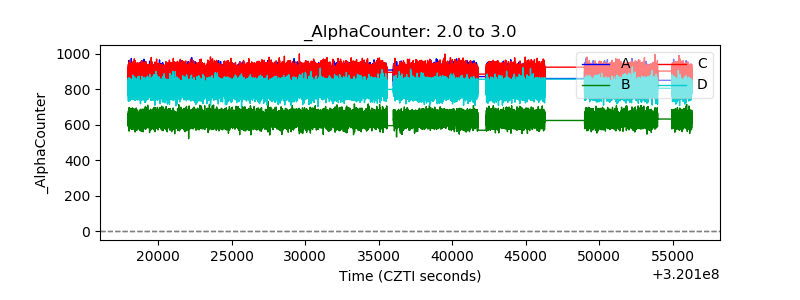 |
| _CPM_Rate | 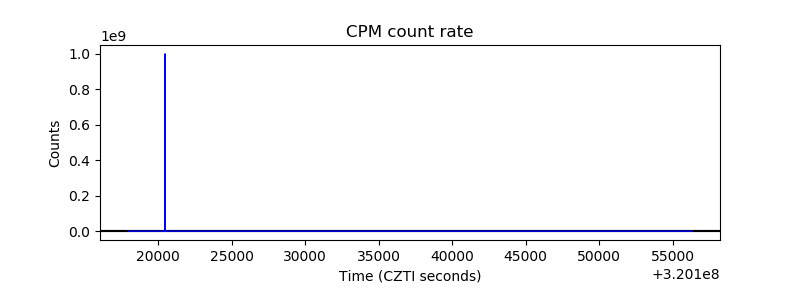 |
| CZT Counter | 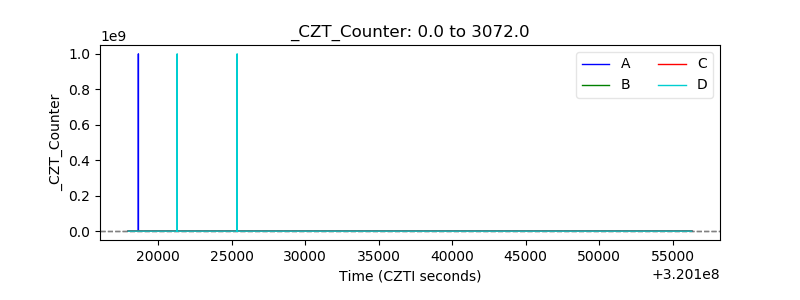 |
| +2.5 Volts monitor |  |
| +5 Volts monitor | 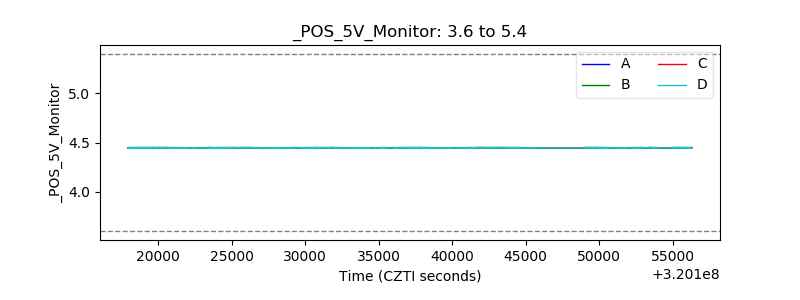 |
| _ROLL_ROT | 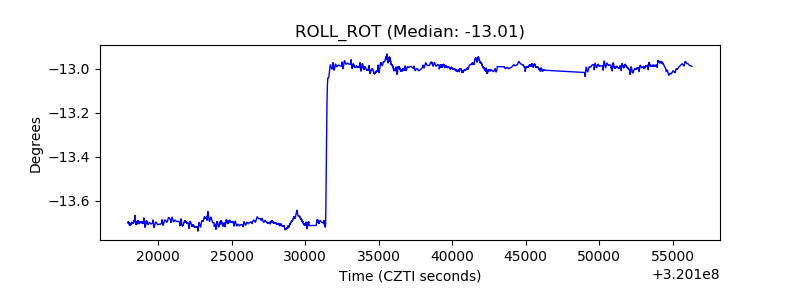 |
| _Roll_DEC | 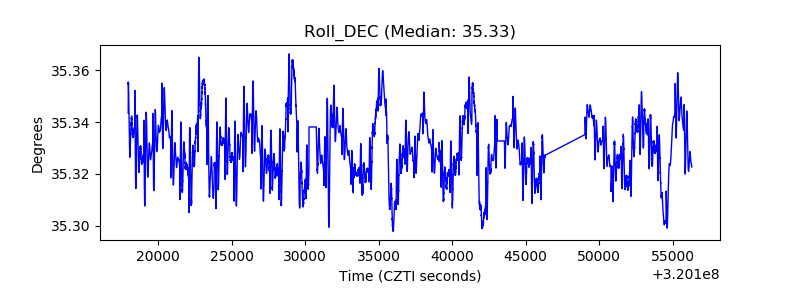 |
| _Roll_RA | 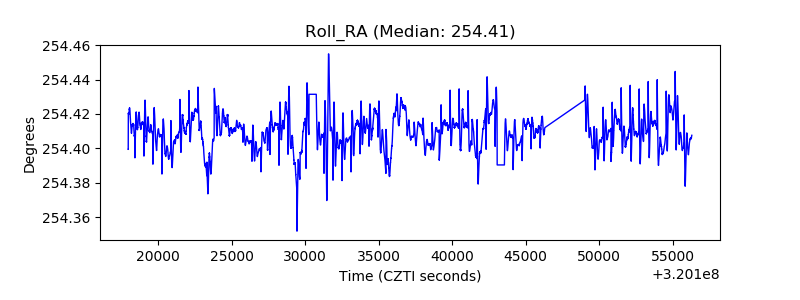 |
| Veto Counter | 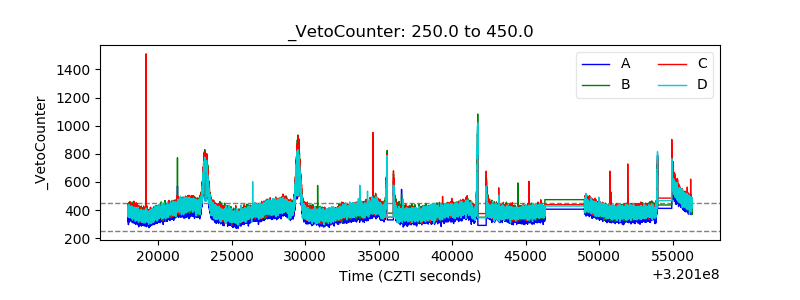 |