| Param | Original file | Final file |
|---|---|---|
| Filename | modeM0/AS1A07_113T01_9000003526_23822cztM0_level2.evt | modeM0/AS1A07_113T01_9000003526_23822cztM0_level2_quad_clean.evt |
| Size (bytes) | 916,110,720 | 71,870,400 |
| Size | 873.7 MB | 68.5 MB |
| Events in quadrant A | 3,430,673 | 485,158 |
| Events in quadrant B | 4,173,302 | 483,348 |
| Events in quadrant C | 3,481,373 | 479,909 |
| Events in quadrant D | 16,203,463 | 256,488 |
| Mode M9 | |||
|---|---|---|---|
| Quadrant | BADHDUFLAG | Total packets | Discarded packets |
| A | 0 | 12 | 0 |
| B | 0 | 13 | 0 |
| C | 0 | 13 | 0 |
| D | 0 | 13 | 0 |
| Mode SS | |||
|---|---|---|---|
| Quadrant | BADHDUFLAG | Total packets | Discarded packets |
| A | 0 | 136 | 0 |
| B | 0 | 136 | 0 |
| C | 0 | 136 | 0 |
| D | 0 | 136 | 0 |
| Mode M0 | |||
|---|---|---|---|
| Quadrant | BADHDUFLAG | Total packets | Discarded packets |
| A | 0 | 14420 | 2 |
| B | 0 | 16648 | 2 |
| C | 0 | 14424 | 2 |
| D | 0 | 52720 | 2 |
| Quadrant | Total seconds | Saturated seconds | Saturation percentage |
|---|---|---|---|
| A | 6742 | 58 | 0.860279% |
| B | 6742 | 247 | 3.663601% |
| C | 6742 | 90 | 1.334915% |
| D | 6742 | 6243 | 92.598635% |
Noise dominated data is calculated using 1-second bins in cleaned event files. If a bin has >2000 counts, and if more than 50% of those come from <1% of pixels, then it is considered to be noise-dominated and hence unusable.
| Quadrant | # 1 sec bins | Bins with >0 counts | Bins with >2000 counts | High rate bins dominated by noise | Noise dominated (total time) | Noise dominated (detector-on time) | Marked lightcurve |
|---|---|---|---|---|---|---|---|
| A | 7836 | 6741 | 0 | 0 | 0.00% | 0.00% | 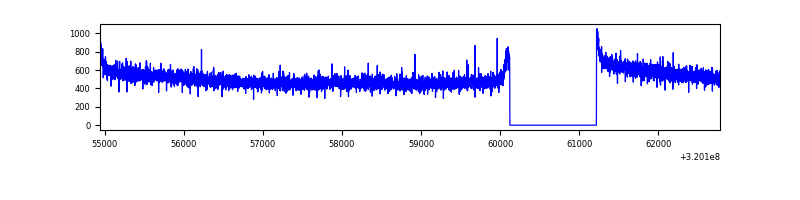 |
| B | 7836 | 6741 | 111 | 111 | 1.42% | 1.65% | 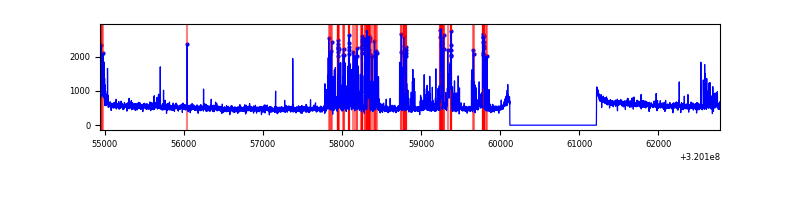 |
| C | 7836 | 6741 | 0 | 0 | 0.00% | 0.00% | 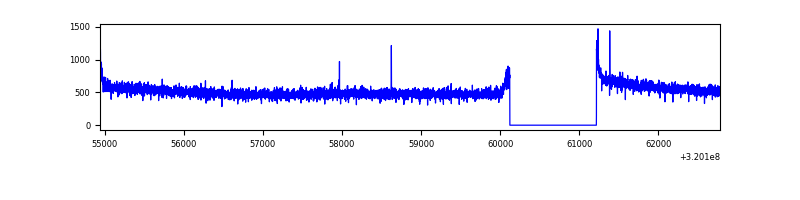 |
| D | 7836 | 6741 | 6030 | 6030 | 76.95% | 89.45% | 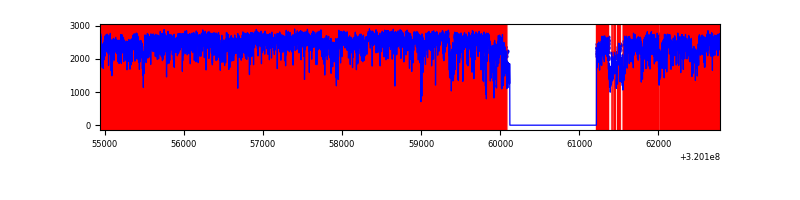 |
Top three noisy pixels from each quadrant. If the there are fewer than three noisy pixels in the level2.evt file, extra rows are filled as -1
| Pixel properties | Quadrant properties | ||||||
|---|---|---|---|---|---|---|---|
| Quadrant | DetID | PixID | Counts | Sigma | Mean | Median | Sigma |
| A | 13 | 254 | 11777 | 61.9 | 888 | 871 | 176.2 |
| A | 0 | 226 | 7744 | 39.01 | 888 | 871 | 176.2 |
| A | 3 | 137 | 7413 | 37.13 | 888 | 871 | 176.2 |
| B | 3 | 64 | 681237 | 4120.76 | 871 | 851 | 165.1 |
| B | 15 | 33 | 48372 | 287.81 | 871 | 851 | 165.1 |
| B | 12 | 111 | 19671 | 113.98 | 871 | 851 | 165.1 |
| C | 14 | 238 | 136406 | 681.47 | 853 | 858 | 198.9 |
| C | 0 | 10 | 6797 | 29.86 | 853 | 858 | 198.9 |
| C | 7 | 247 | 6458 | 28.15 | 853 | 858 | 198.9 |
| D | 13 | 174 | 10853771 | 91523.36 | 486 | 473 | 118.6 |
| D | 8 | 195 | 2864952 | 24155.49 | 486 | 473 | 118.6 |
| D | 1 | 52 | 588844 | 4961.6 | 486 | 473 | 118.6 |
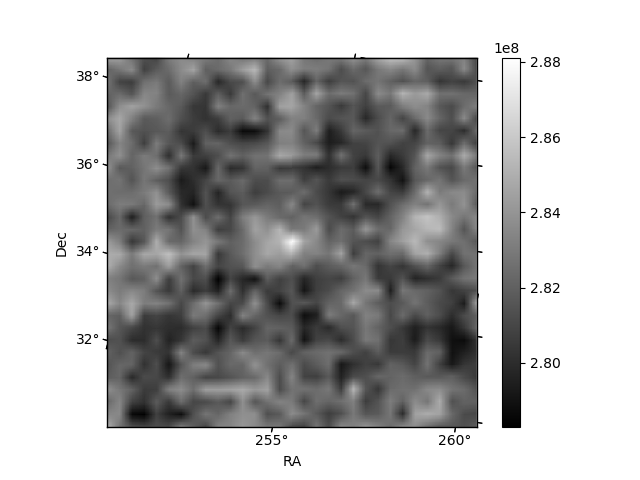
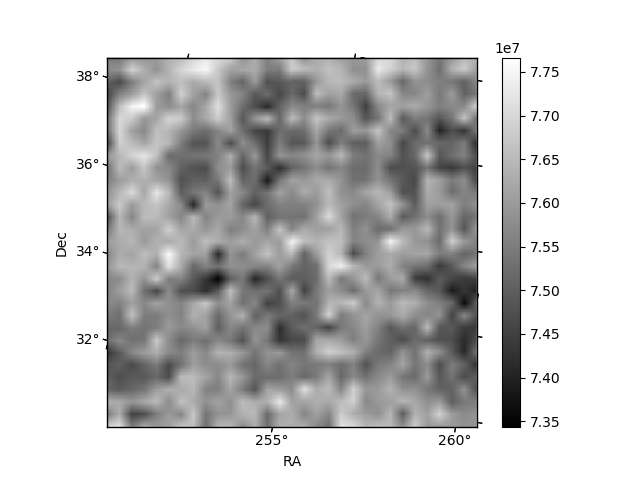
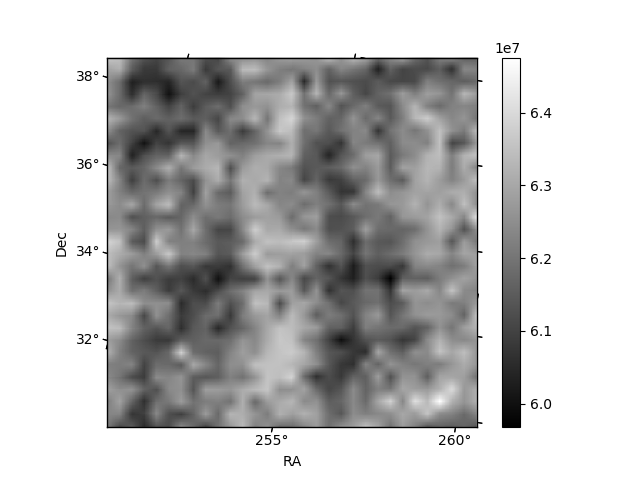
Histogram calculated using DETX and DETY for each event in the final _common_clean file
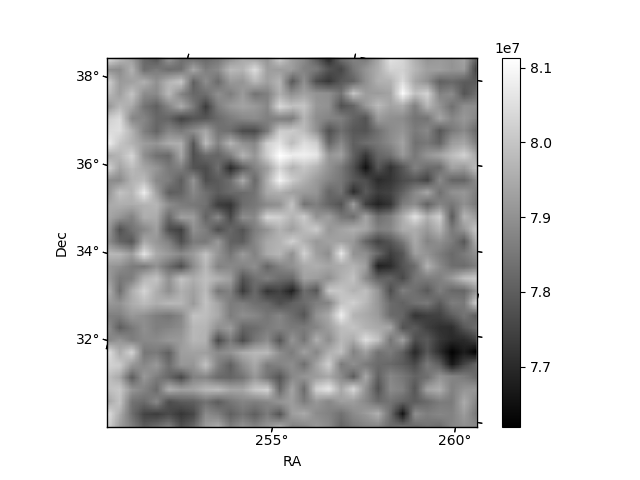
| Quadrant A | 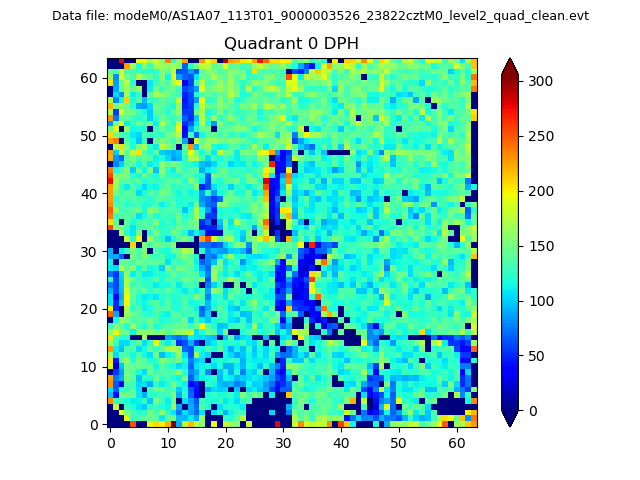 |
 |
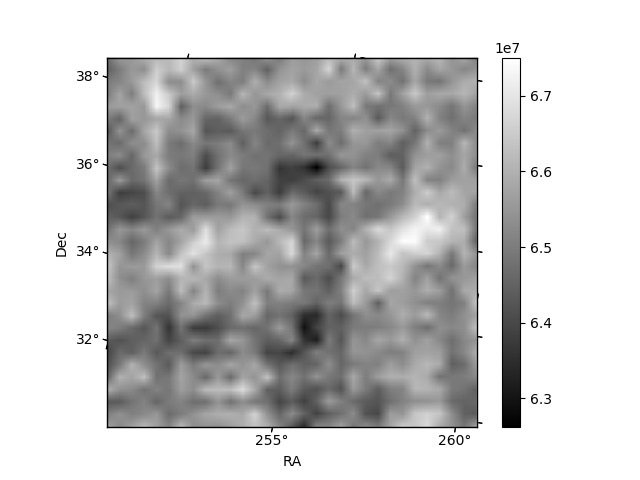
Quadrant B |
|---|---|---|---|
| Quadrant D | 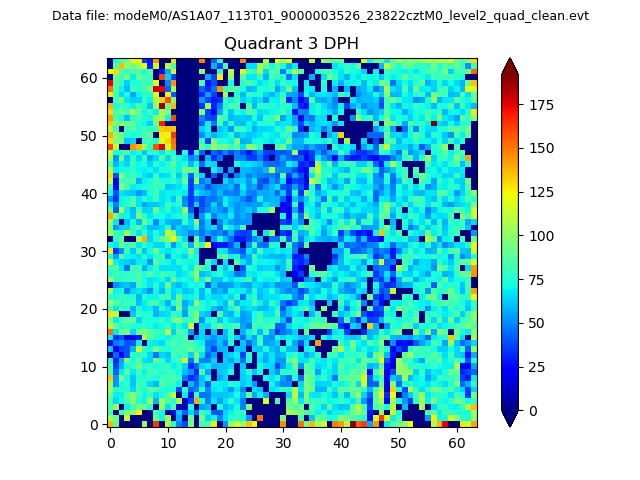 |
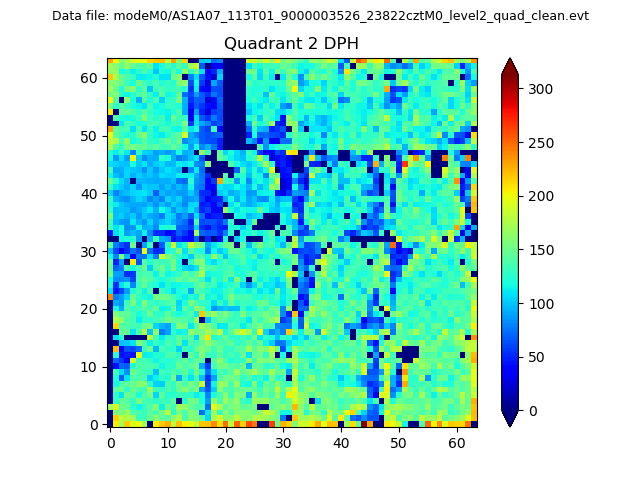 |
Quadrant C |
| Plot type | Count rate plots | Images |
|---|---|---|
| Comparison with Poisson distribution Blue bars denote a histogram of data divided into 1 sec bins. Red curve is a Poisson curve with rate = median count rate of data. |
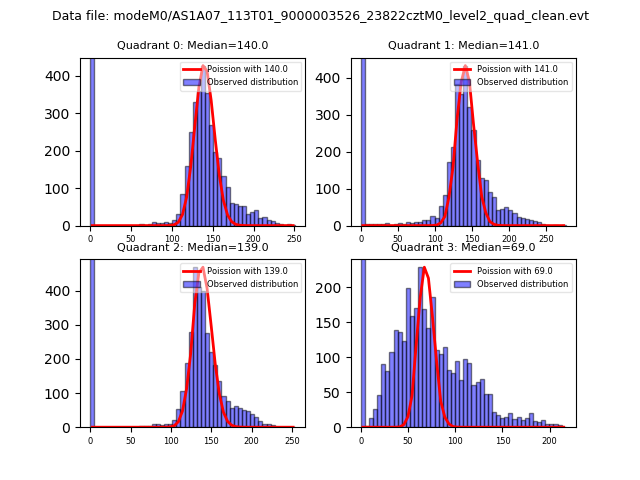 |
 |
| Quadrant-wise count rates Data is divided into 100 sec bins |
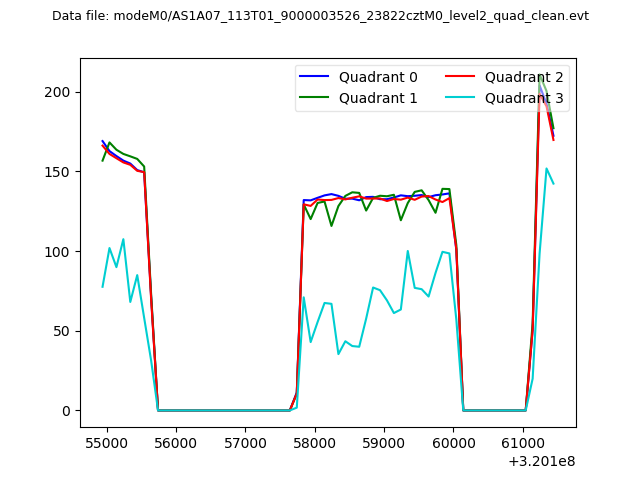 |
|
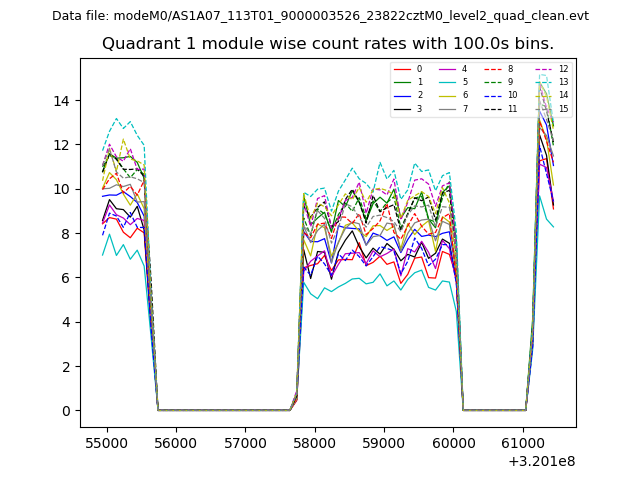
| Module-wise count rates for Quadrant A Data is divided into 100 sec bins |
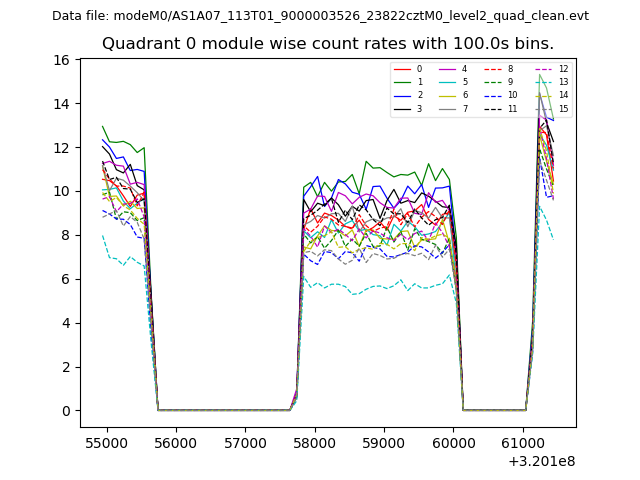 |
 |
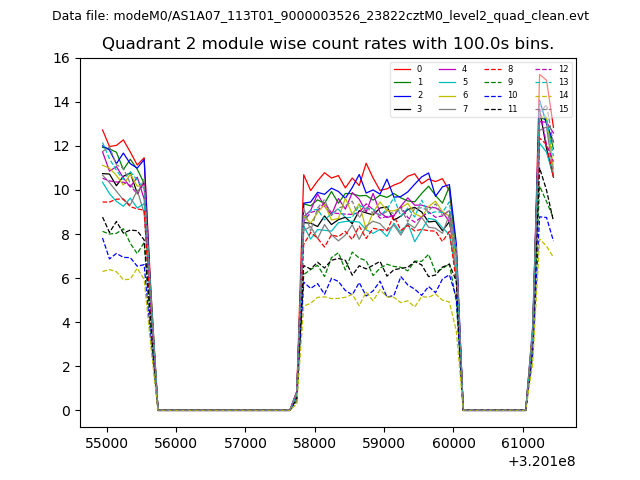
| Module-wise count rates for Quadrant B Data is divided into 100 sec bins |
 |
 |
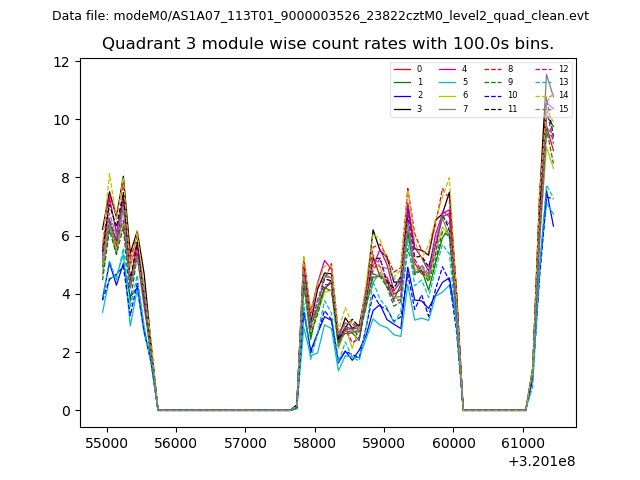
| Module-wise count rates for Quadrant C Data is divided into 100 sec bins |
 |
 |
| Module-wise count rates for Quadrant D Data is divided into 100 sec bins |
 |
 |
| Parameter | Plot |
|---|---|
| CZT HV Monitor |  |
| D_VDD | 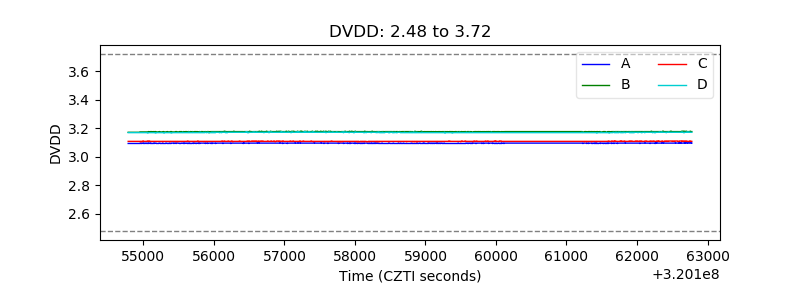 |
| Temperature 1 | 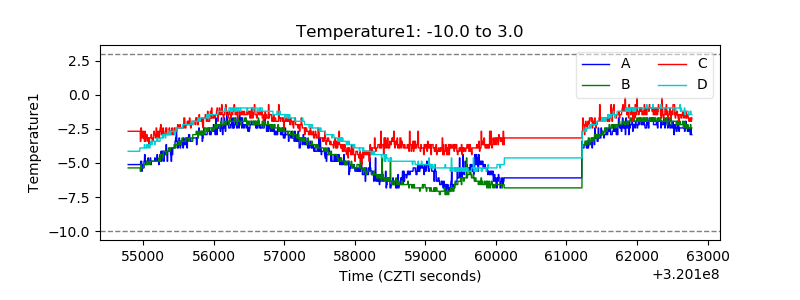 |
| Veto HV Monitor | 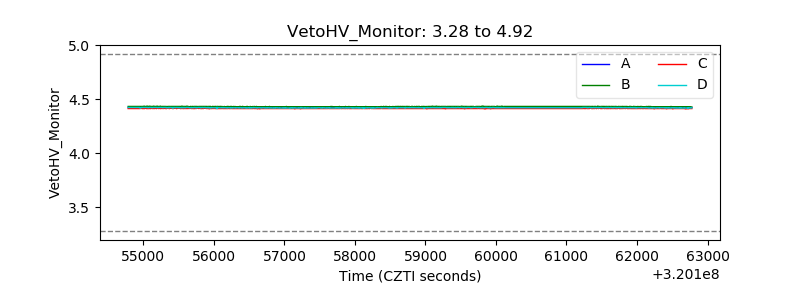 |
| Veto LLD | 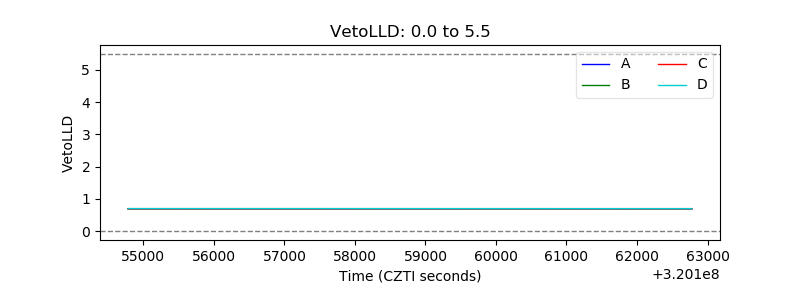 |
| Alpha Counter | 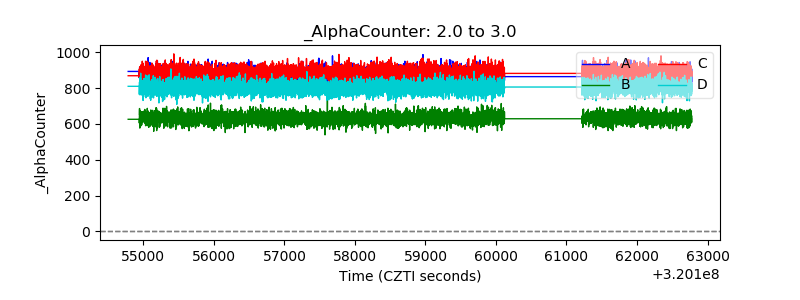 |
| _CPM_Rate | 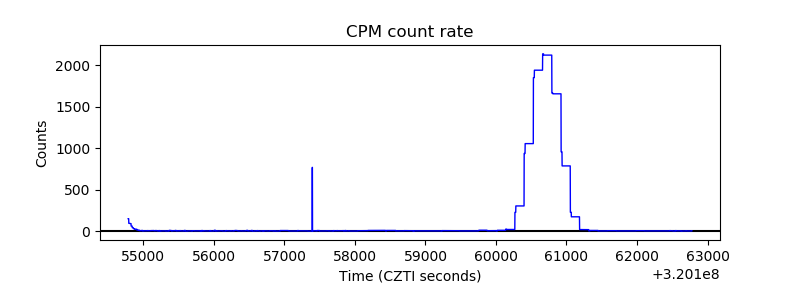 |
| CZT Counter |  |
| +2.5 Volts monitor |  |
| +5 Volts monitor | 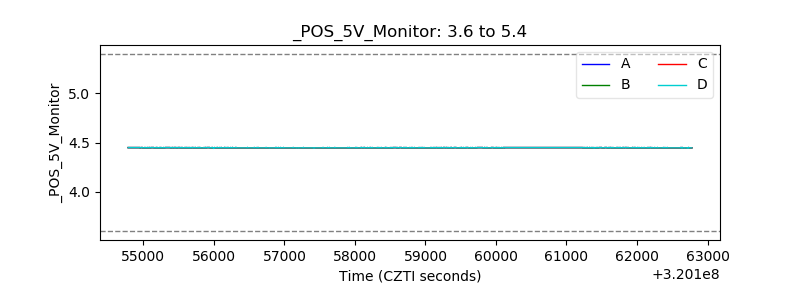 |
| _ROLL_ROT | 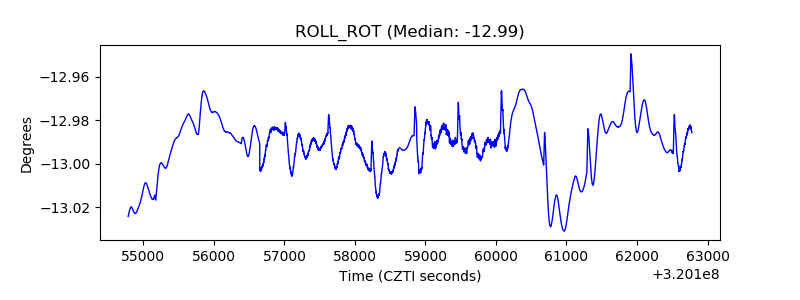 |
| _Roll_DEC | 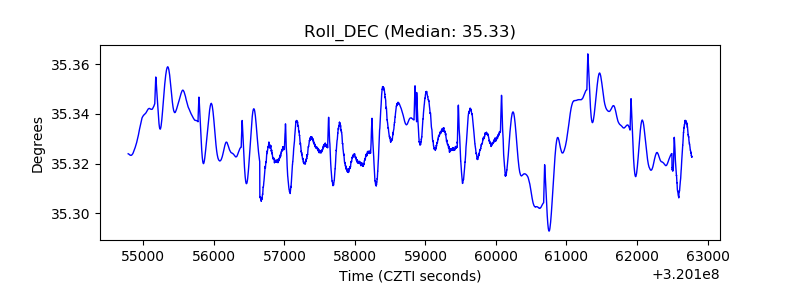 |
| _Roll_RA | 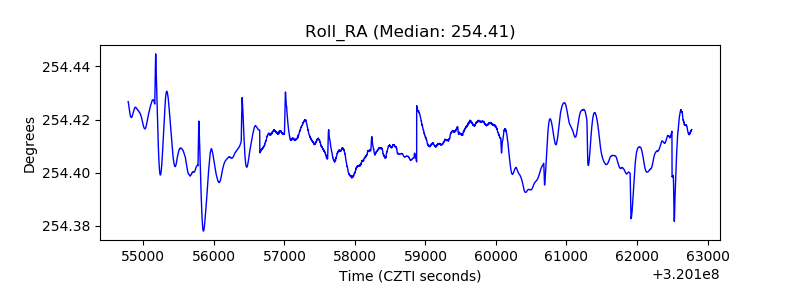 |
| Veto Counter | 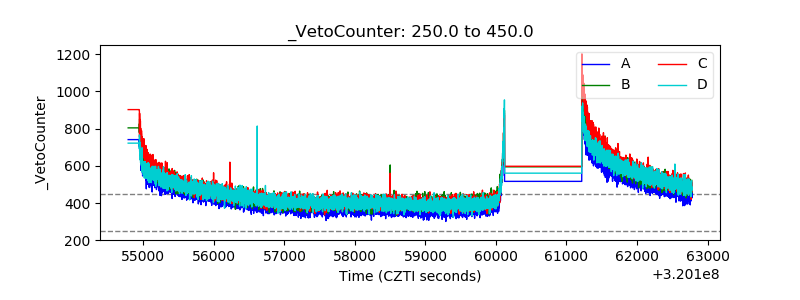 |