| Param | Original file | Final file |
|---|---|---|
| Filename | modeM0/AS1A07_113T01_9000003526_23823cztM0_level2.evt | modeM0/AS1A07_113T01_9000003526_23823cztM0_level2_quad_clean.evt |
| Size (bytes) | 726,258,240 | 64,972,800 |
| Size | 692.6 MB | 62.0 MB |
| Events in quadrant A | 3,365,468 | 394,080 |
| Events in quadrant B | 3,484,811 | 400,231 |
| Events in quadrant C | 3,479,222 | 389,433 |
| Events in quadrant D | 11,237,928 | 342,436 |
| Mode M9 | |||
|---|---|---|---|
| Quadrant | BADHDUFLAG | Total packets | Discarded packets |
| A | 0 | 13 | 0 |
| B | 0 | 13 | 0 |
| C | 0 | 13 | 0 |
| D | 0 | 13 | 0 |
| Mode SS | |||
|---|---|---|---|
| Quadrant | BADHDUFLAG | Total packets | Discarded packets |
| A | 0 | 128 | 0 |
| B | 0 | 128 | 0 |
| C | 0 | 128 | 0 |
| D | 0 | 128 | 0 |
| Mode M0 | |||
|---|---|---|---|
| Quadrant | BADHDUFLAG | Total packets | Discarded packets |
| A | 0 | 14094 | 1 |
| B | 0 | 14404 | 1 |
| C | 0 | 14374 | 1 |
| D | 0 | 37786 | 1 |
| Quadrant | Total seconds | Saturated seconds | Saturation percentage |
|---|---|---|---|
| A | 6317 | 82 | 1.298085% |
| B | 6318 | 80 | 1.266223% |
| C | 6318 | 136 | 2.152580% |
| D | 6318 | 3300 | 52.231719% |
Noise dominated data is calculated using 1-second bins in cleaned event files. If a bin has >2000 counts, and if more than 50% of those come from <1% of pixels, then it is considered to be noise-dominated and hence unusable.
| Quadrant | # 1 sec bins | Bins with >0 counts | Bins with >2000 counts | High rate bins dominated by noise | Noise dominated (total time) | Noise dominated (detector-on time) | Marked lightcurve |
|---|---|---|---|---|---|---|---|
| A | 7536 | 6316 | 0 | 0 | 0.00% | 0.00% |  |
| B | 7537 | 6317 | 0 | 0 | 0.00% | 0.00% | 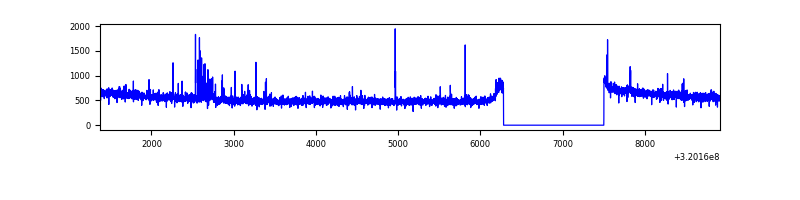 |
| C | 7537 | 6317 | 2 | 2 | 0.03% | 0.03% | 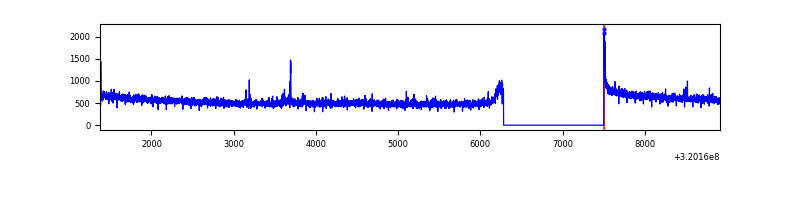 |
| D | 7537 | 6317 | 2923 | 2923 | 38.78% | 46.27% | 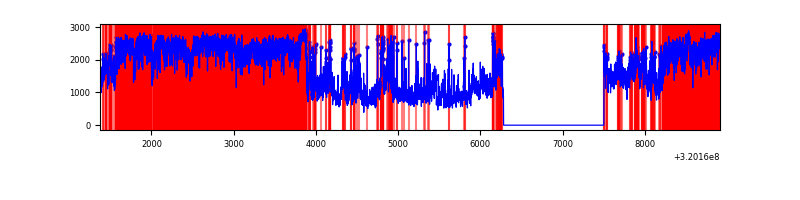 |
Top three noisy pixels from each quadrant. If the there are fewer than three noisy pixels in the level2.evt file, extra rows are filled as -1
| Pixel properties | Quadrant properties | ||||||
|---|---|---|---|---|---|---|---|
| Quadrant | DetID | PixID | Counts | Sigma | Mean | Median | Sigma |
| A | 13 | 254 | 11363 | 60.28 | 872 | 856 | 174.3 |
| A | 0 | 226 | 7564 | 38.49 | 872 | 856 | 174.3 |
| A | 3 | 137 | 7130 | 36.0 | 872 | 856 | 174.3 |
| B | 15 | 33 | 54024 | 328.17 | 865 | 847 | 162.0 |
| B | 3 | 64 | 21345 | 126.5 | 865 | 847 | 162.0 |
| B | 12 | 111 | 18852 | 111.12 | 865 | 847 | 162.0 |
| C | 14 | 238 | 136092 | 695.7 | 845 | 853 | 194.4 |
| C | 7 | 247 | 22430 | 111.0 | 845 | 853 | 194.4 |
| C | 0 | 10 | 17228 | 84.24 | 845 | 853 | 194.4 |
| D | 13 | 174 | 5089992 | 31560.43 | 671 | 653 | 161.3 |
| D | 8 | 195 | 2383607 | 14777.37 | 671 | 653 | 161.3 |
| D | 1 | 52 | 1195280 | 7408.22 | 671 | 653 | 161.3 |
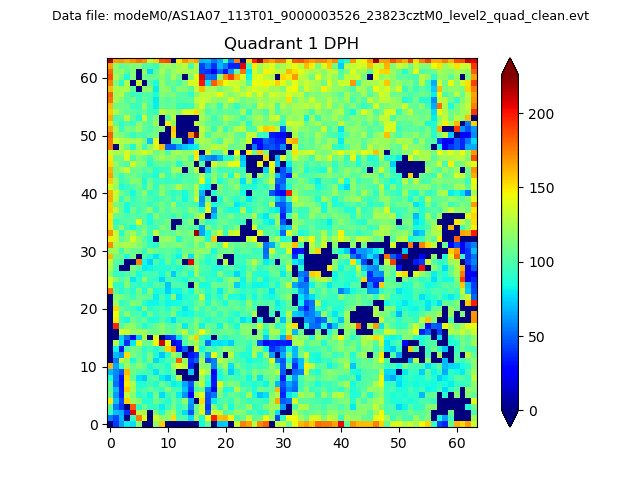
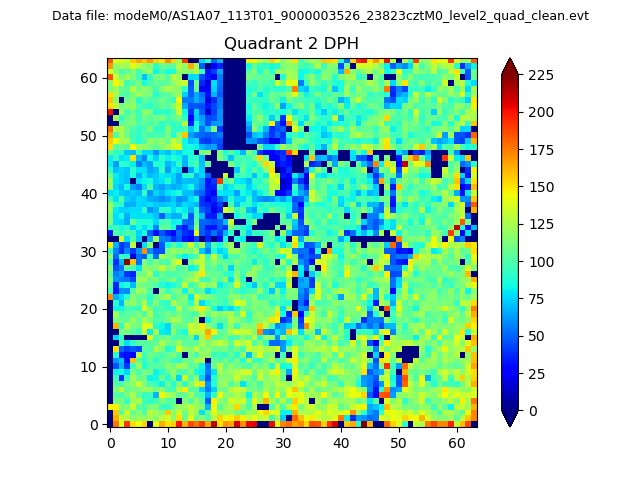
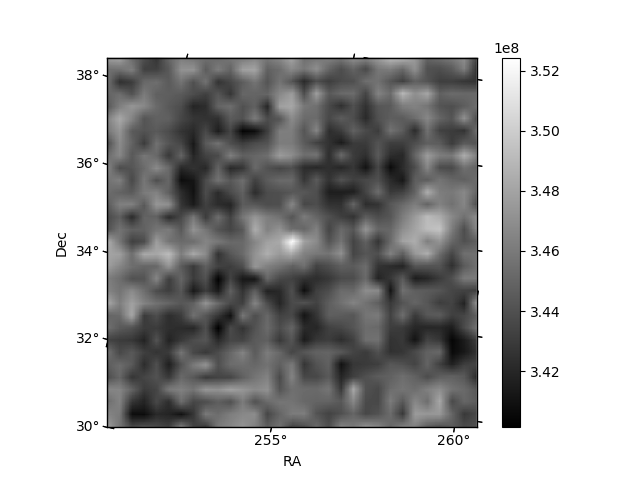
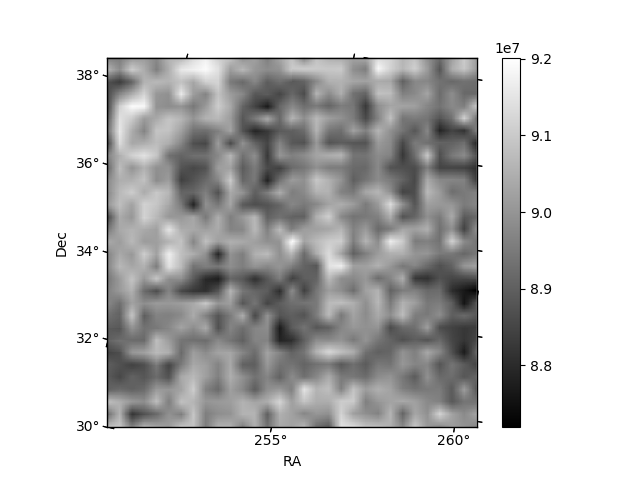
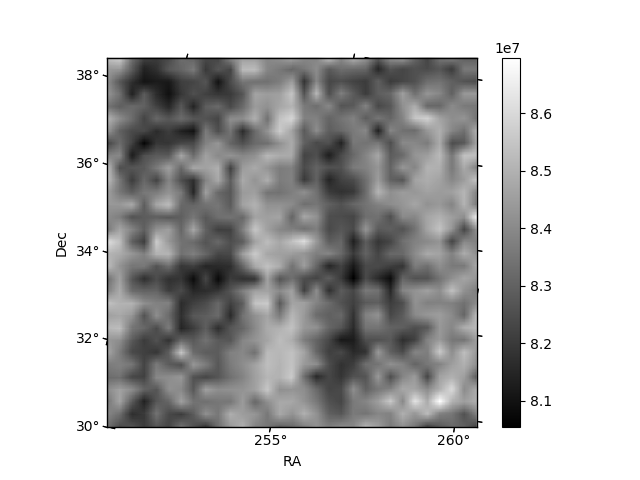
Histogram calculated using DETX and DETY for each event in the final _common_clean file
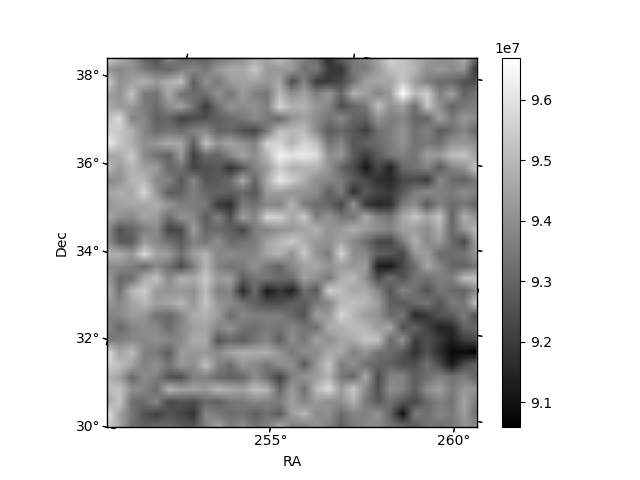
| Quadrant A | 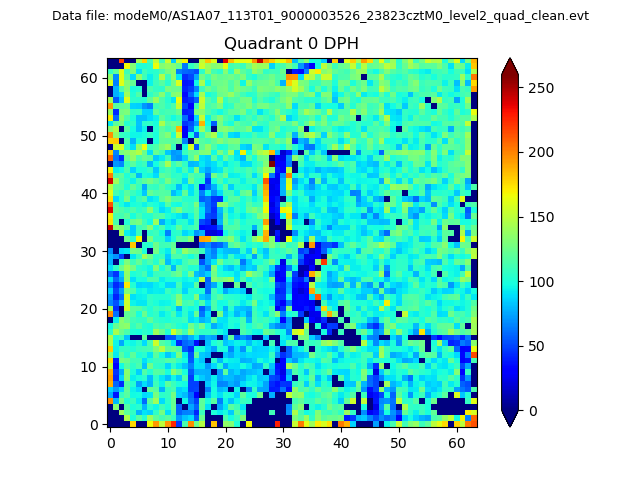 |
 |
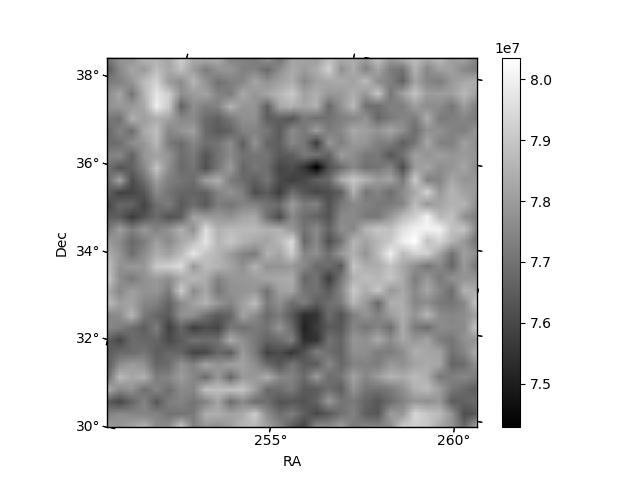
Quadrant B |
|---|---|---|---|
| Quadrant D | 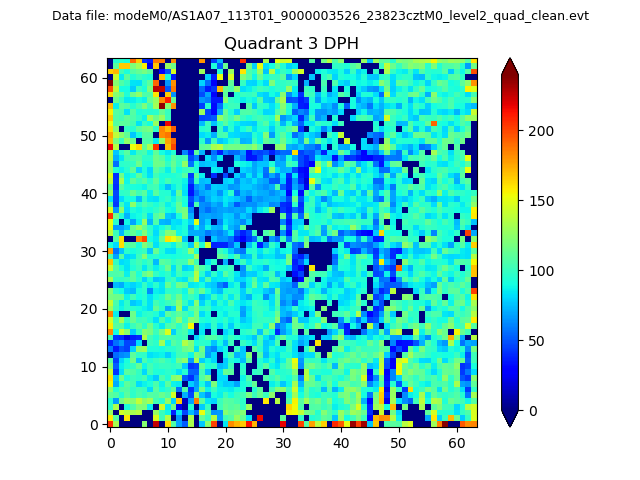 |
 |
Quadrant C |
| Plot type | Count rate plots | Images |
|---|---|---|
| Comparison with Poisson distribution Blue bars denote a histogram of data divided into 1 sec bins. Red curve is a Poisson curve with rate = median count rate of data. |
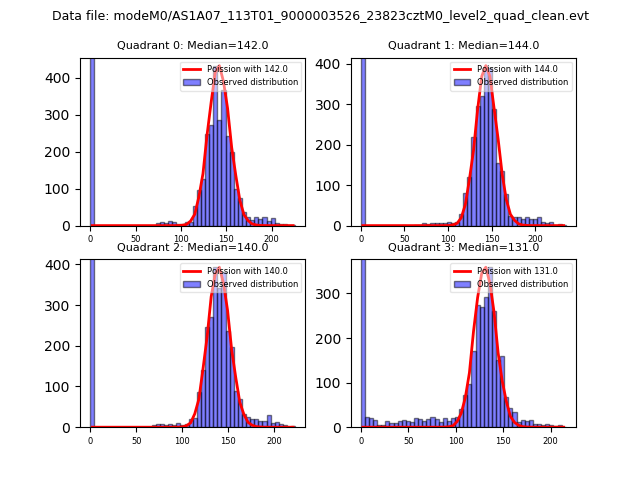 |
 |
| Quadrant-wise count rates Data is divided into 100 sec bins |
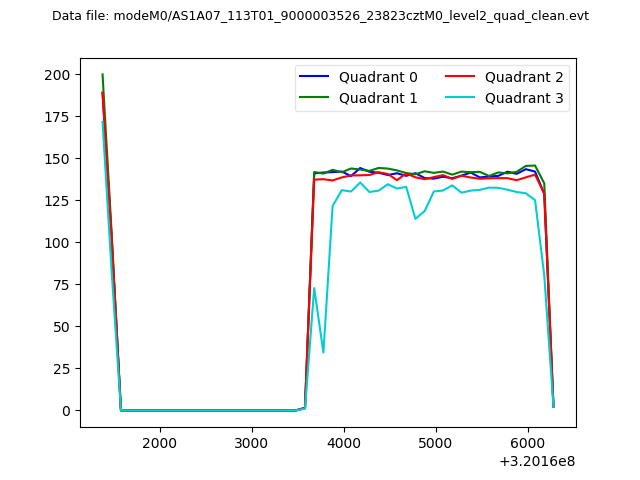 |
|
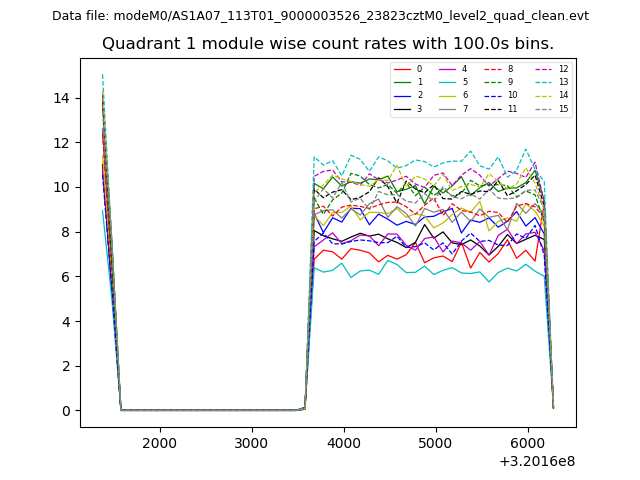
| Module-wise count rates for Quadrant A Data is divided into 100 sec bins |
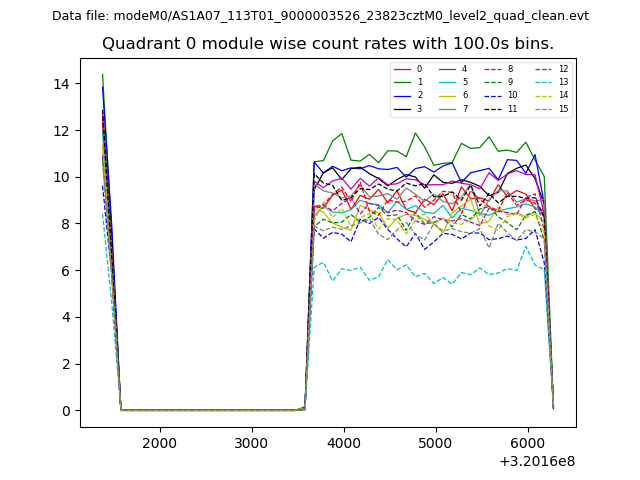 |
 |
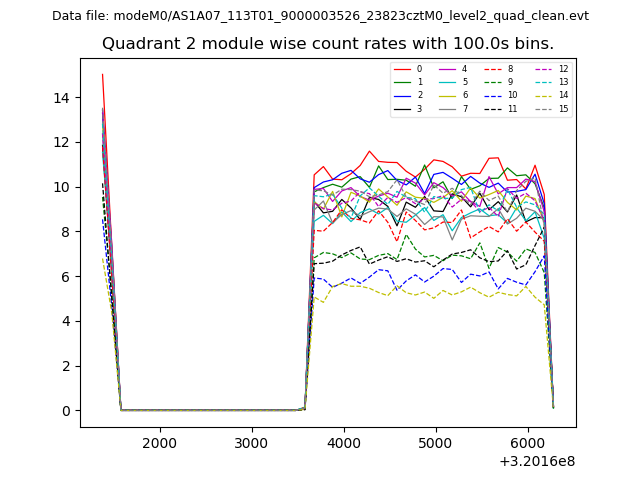
| Module-wise count rates for Quadrant B Data is divided into 100 sec bins |
 |
 |
| Module-wise count rates for Quadrant C Data is divided into 100 sec bins |
 |
 |
| Module-wise count rates for Quadrant D Data is divided into 100 sec bins |
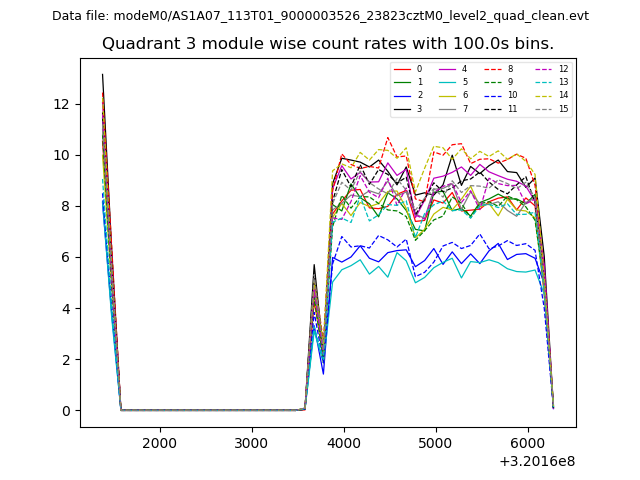 |
 |
| Parameter | Plot |
|---|---|
| CZT HV Monitor | 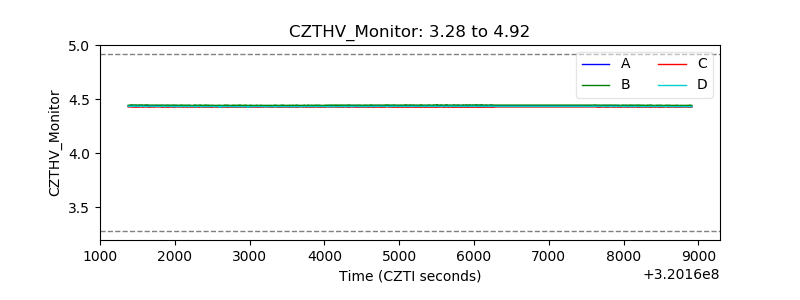 |
| D_VDD | 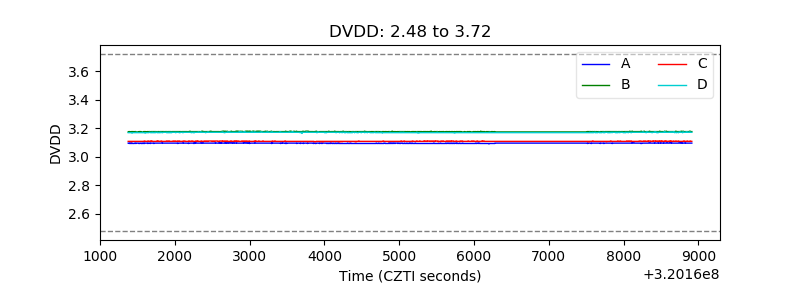 |
| Temperature 1 | 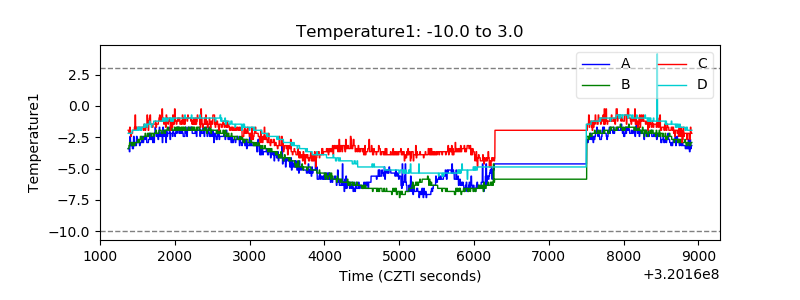 |
| Veto HV Monitor | 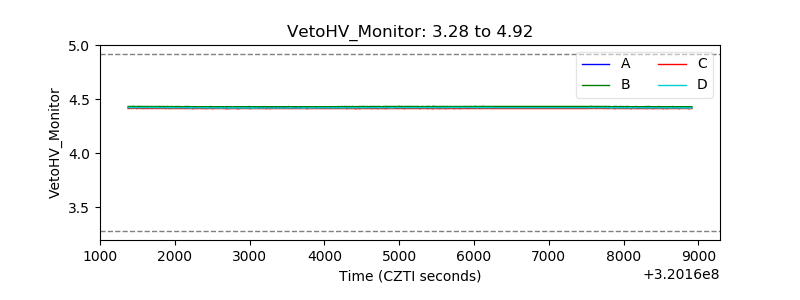 |
| Veto LLD | 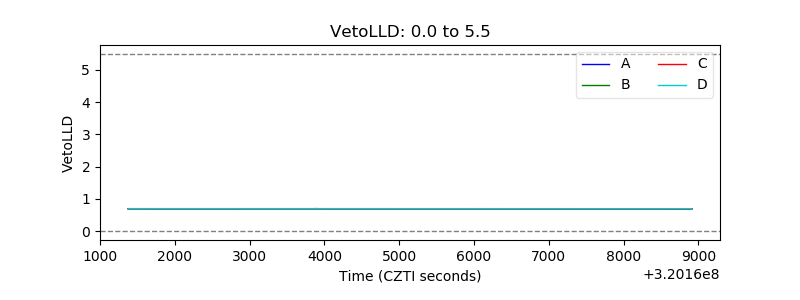 |
| Alpha Counter | 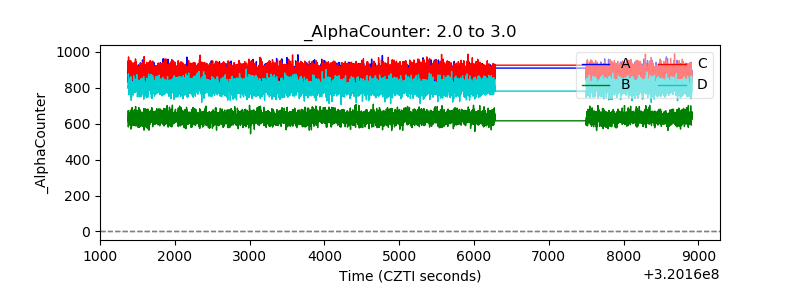 |
| _CPM_Rate | 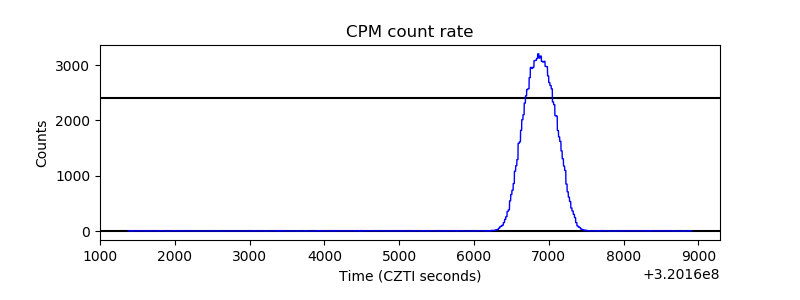 |
| CZT Counter | 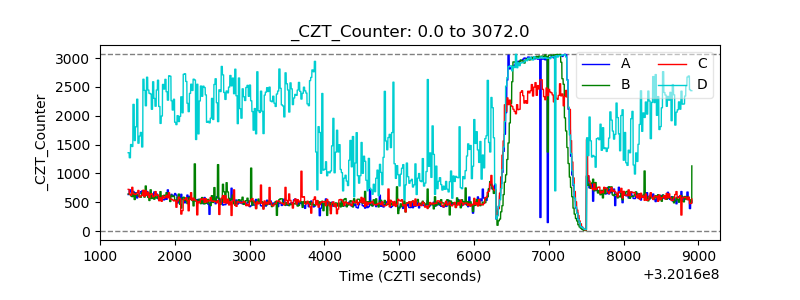 |
| +2.5 Volts monitor |  |
| +5 Volts monitor |  |
| _ROLL_ROT | 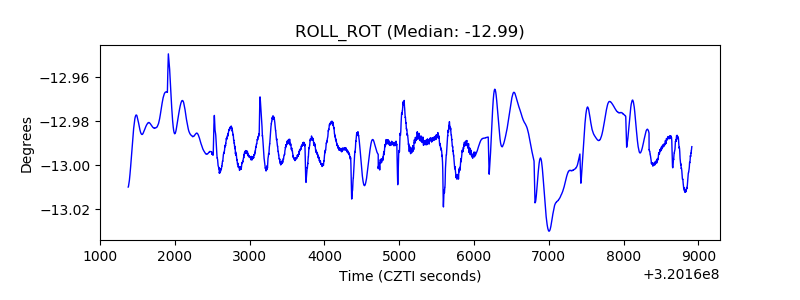 |
| _Roll_DEC | 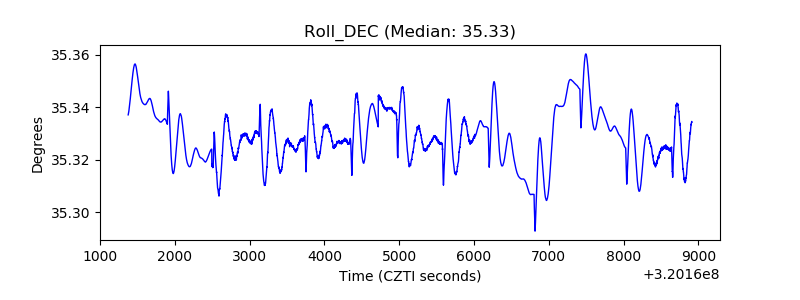 |
| _Roll_RA | 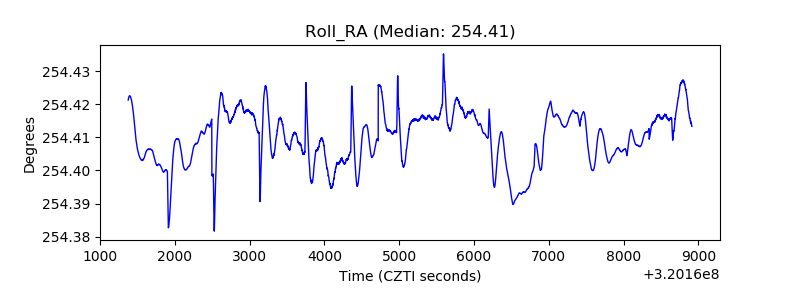 |
| Veto Counter | 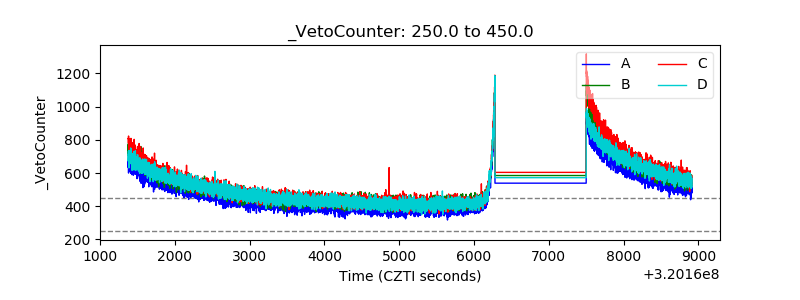 |