| Param | Original file | Final file |
|---|---|---|
| Filename | modeM0/AS1A07_113T01_9000003526_23825cztM0_level2.evt | modeM0/AS1A07_113T01_9000003526_23825cztM0_level2_quad_clean.evt |
| Size (bytes) | 405,921,600 | 47,013,120 |
| Size | 387.1 MB | 44.8 MB |
| Events in quadrant A | 1,875,203 | 323,021 |
| Events in quadrant B | 1,929,011 | 326,374 |
| Events in quadrant C | 1,976,509 | 323,941 |
| Events in quadrant D | 6,281,929 | 209,724 |
| Mode M9 | |||
|---|---|---|---|
| Quadrant | BADHDUFLAG | Total packets | Discarded packets |
| A | 0 | 4 | 3 |
| B | 0 | 5 | 4 |
| C | 0 | 5 | 3 |
| D | 0 | 6 | 5 |
| Mode SS | |||
|---|---|---|---|
| Quadrant | BADHDUFLAG | Total packets | Discarded packets |
| A | 0 | 92 | 22 |
| B | 0 | 92 | 22 |
| C | 0 | 91 | 23 |
| D | 0 | 93 | 23 |
| Mode M0 | |||
|---|---|---|---|
| Quadrant | BADHDUFLAG | Total packets | Discarded packets |
| A | 0 | 10470 | 2689 |
| B | 0 | 10700 | 2789 |
| C | 0 | 10862 | 2786 |
| D | 0 | 30797 | 10015 |
| Quadrant | Total seconds | Saturated seconds | Saturation percentage |
|---|---|---|---|
| A | 3471 | 11 | 0.316912% |
| B | 3434 | 17 | 0.495050% |
| C | 3458 | 56 | 1.619433% |
| D | 3137 | 2174 | 69.301881% |
Noise dominated data is calculated using 1-second bins in cleaned event files. If a bin has >2000 counts, and if more than 50% of those come from <1% of pixels, then it is considered to be noise-dominated and hence unusable.
| Quadrant | # 1 sec bins | Bins with >0 counts | Bins with >2000 counts | High rate bins dominated by noise | Noise dominated (total time) | Noise dominated (detector-on time) | Marked lightcurve |
|---|---|---|---|---|---|---|---|
| A | 4799 | 3675 | 0 | 0 | 0.00% | 0.00% | 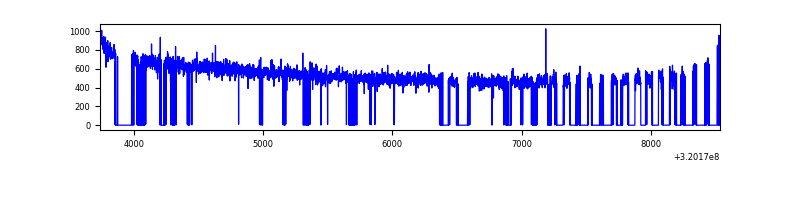 |
| B | 4796 | 3629 | 2 | 2 | 0.04% | 0.06% | 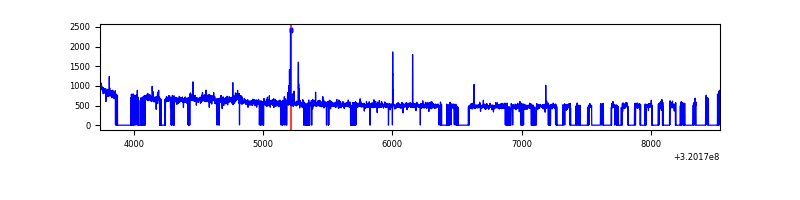 |
| C | 4800 | 3653 | 0 | 0 | 0.00% | 0.00% | 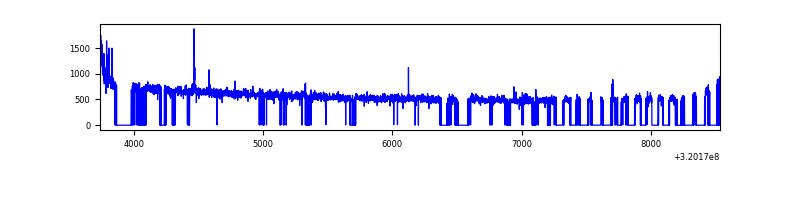 |
| D | 4793 | 3339 | 2053 | 2053 | 42.83% | 61.49% | 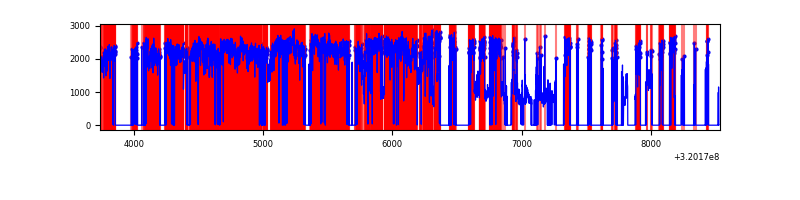 |
Top three noisy pixels from each quadrant. If the there are fewer than three noisy pixels in the level2.evt file, extra rows are filled as -1
| Pixel properties | Quadrant properties | ||||||
|---|---|---|---|---|---|---|---|
| Quadrant | DetID | PixID | Counts | Sigma | Mean | Median | Sigma |
| A | 13 | 254 | 6267 | 60.0 | 486 | 479 | 96.5 |
| A | 0 | 226 | 4236 | 38.95 | 486 | 479 | 96.5 |
| A | 3 | 137 | 3672 | 33.1 | 486 | 479 | 96.5 |
| B | 3 | 64 | 17568 | 190.65 | 480 | 470 | 89.7 |
| B | 0 | 189 | 17301 | 187.67 | 480 | 470 | 89.7 |
| B | 12 | 111 | 9936 | 105.55 | 480 | 470 | 89.7 |
| C | 14 | 238 | 77500 | 693.59 | 477 | 482 | 111.0 |
| C | 0 | 10 | 22015 | 193.92 | 477 | 482 | 111.0 |
| C | 0 | 207 | 8871 | 75.55 | 477 | 482 | 111.0 |
| D | 13 | 174 | 2943022 | 40023.38 | 304 | 297 | 73.5 |
| D | 8 | 195 | 1293352 | 17586.57 | 304 | 297 | 73.5 |
| D | 1 | 52 | 569592 | 7742.86 | 304 | 297 | 73.5 |
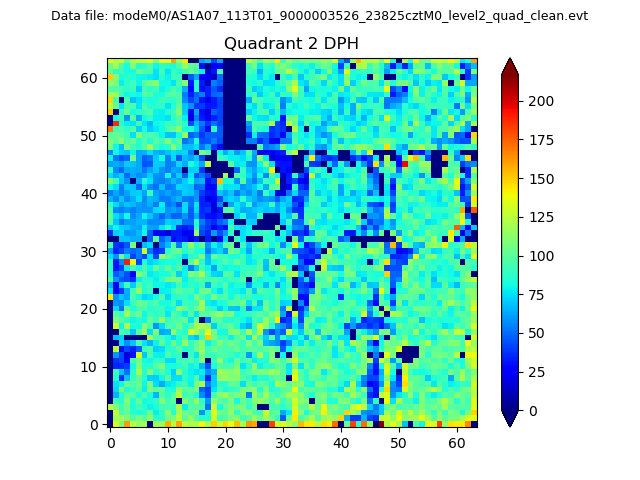
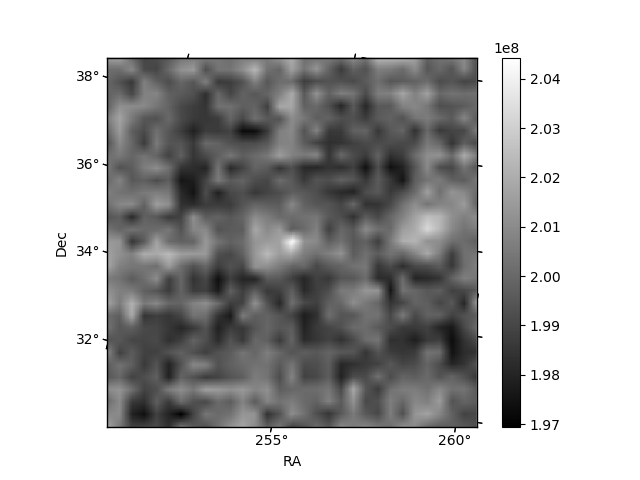
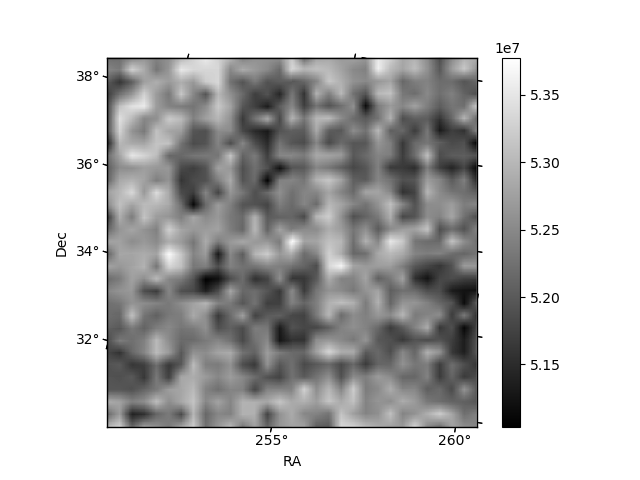
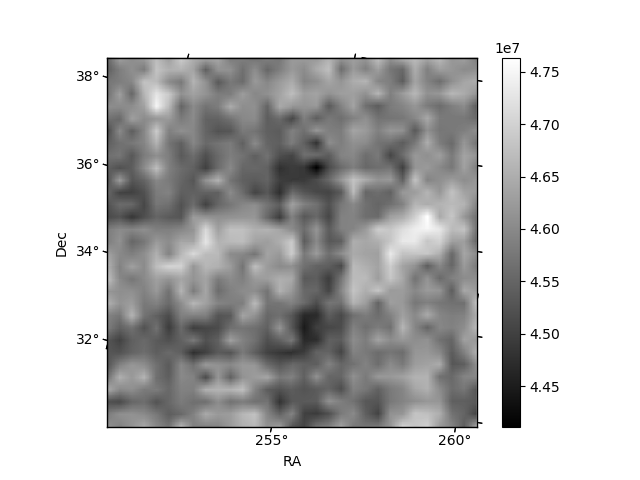
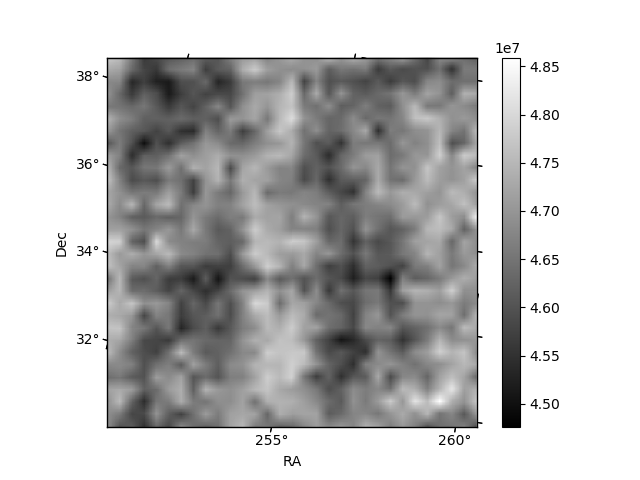
Histogram calculated using DETX and DETY for each event in the final _common_clean file
| Quadrant A | 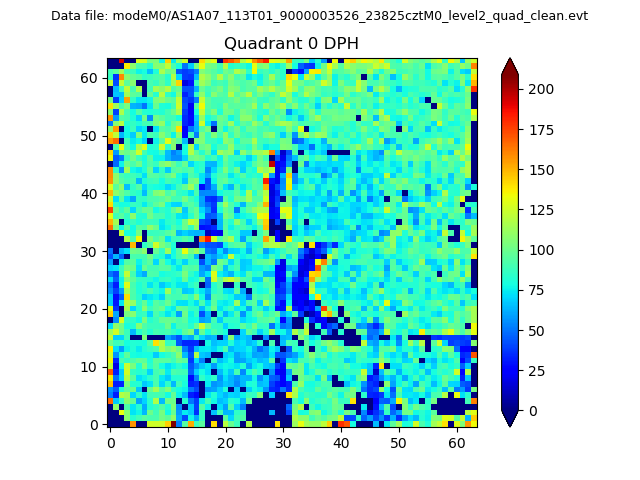 |
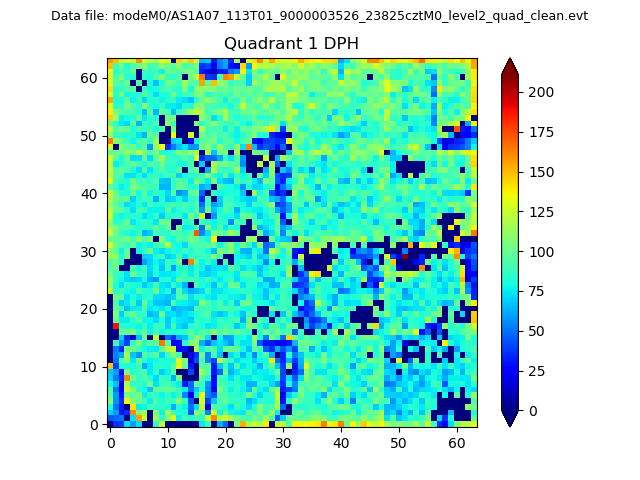 |
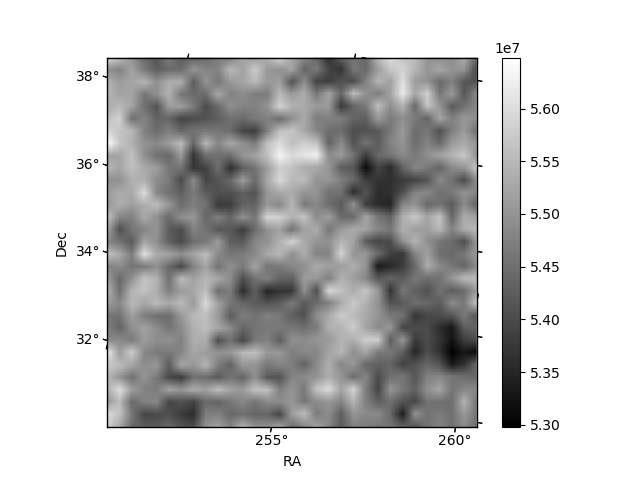
Quadrant B |
|---|---|---|---|
| Quadrant D | 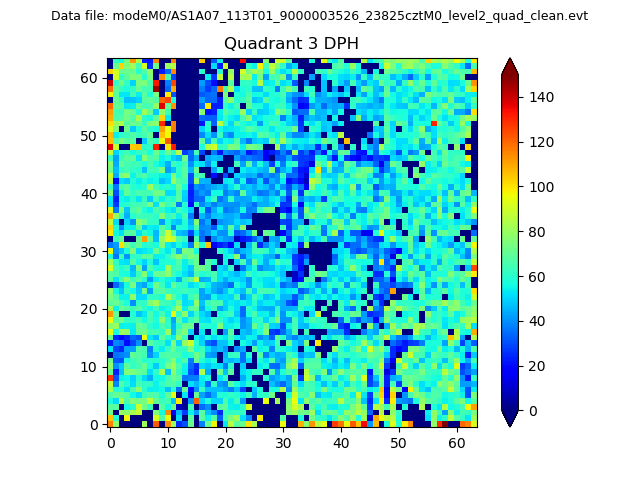 |
 |
Quadrant C |
| Plot type | Count rate plots | Images |
|---|---|---|
| Comparison with Poisson distribution Blue bars denote a histogram of data divided into 1 sec bins. Red curve is a Poisson curve with rate = median count rate of data. |
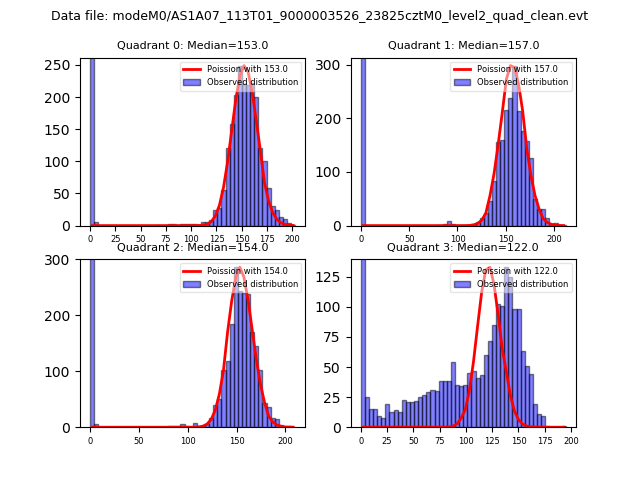 |
 |
| Quadrant-wise count rates Data is divided into 100 sec bins |
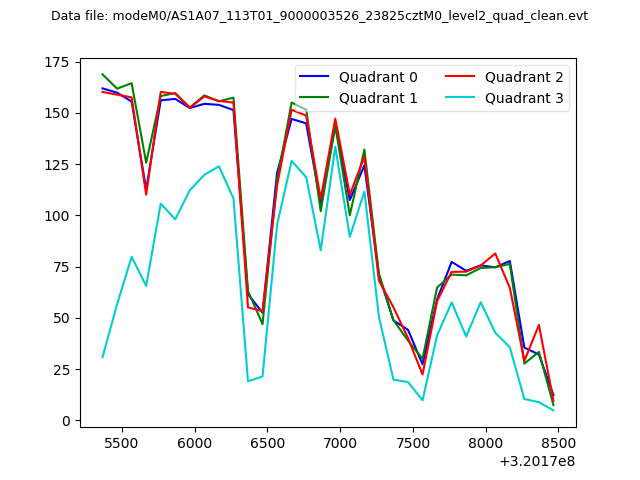 |
|
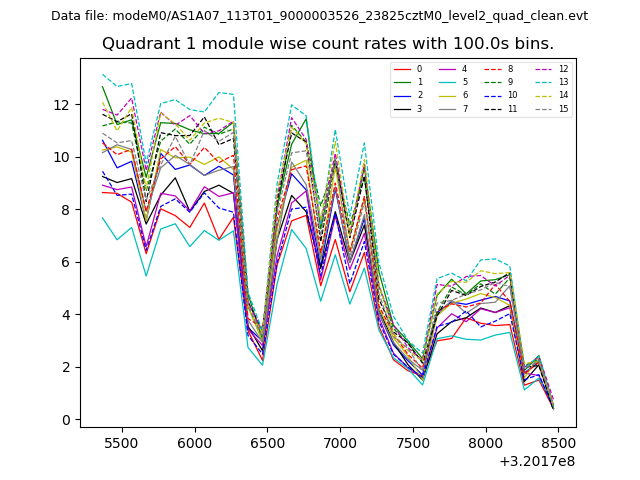
| Module-wise count rates for Quadrant A Data is divided into 100 sec bins |
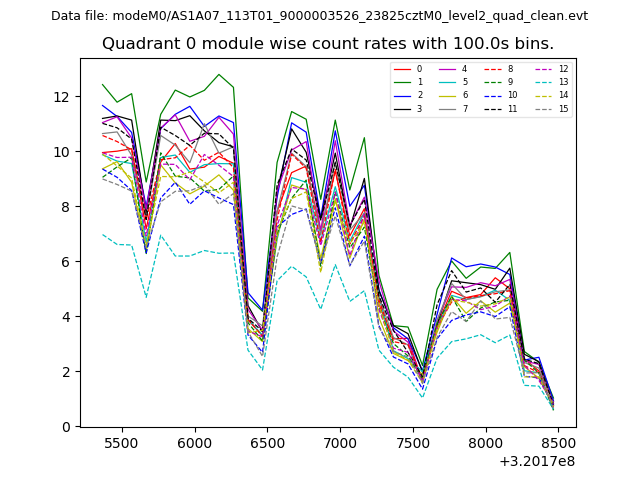 |
 |
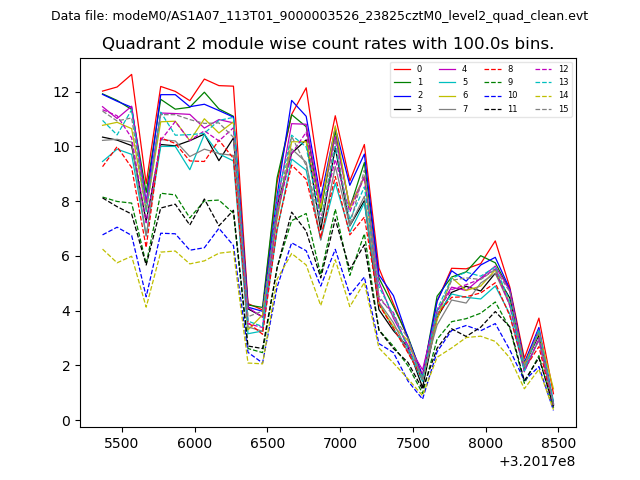
| Module-wise count rates for Quadrant B Data is divided into 100 sec bins |
 |
 |
| Module-wise count rates for Quadrant C Data is divided into 100 sec bins |
 |
 |
| Module-wise count rates for Quadrant D Data is divided into 100 sec bins |
 |
 |
| Parameter | Plot |
|---|---|
| CZT HV Monitor | 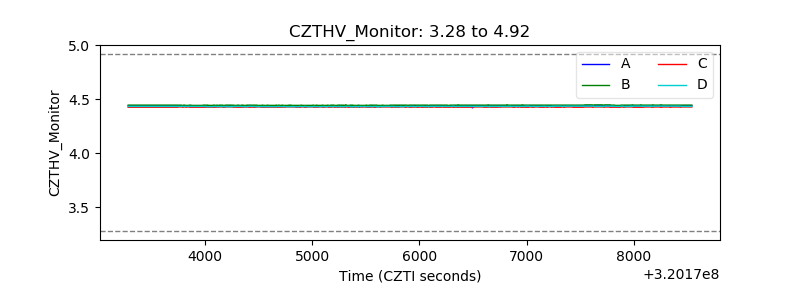 |
| D_VDD | 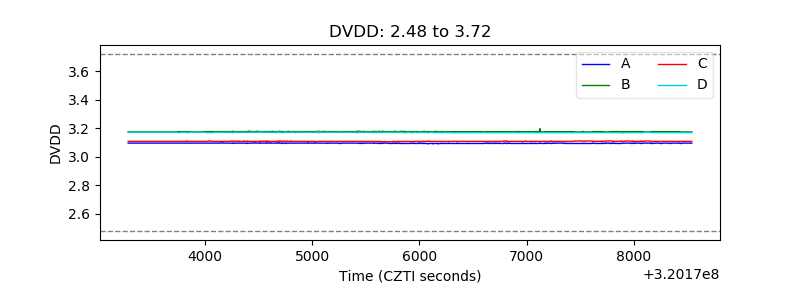 |
| Temperature 1 | 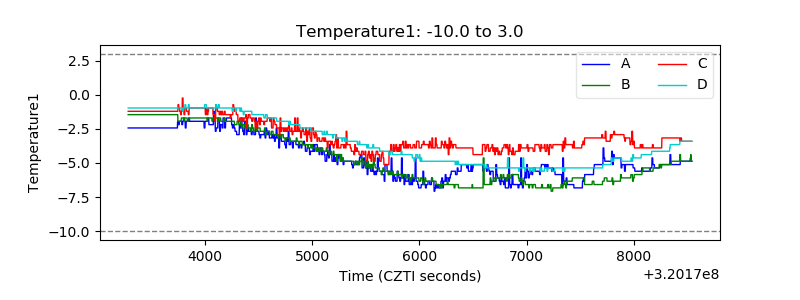 |
| Veto HV Monitor | 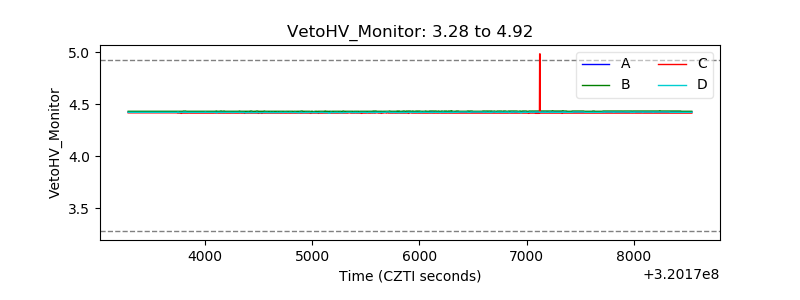 |
| Veto LLD | 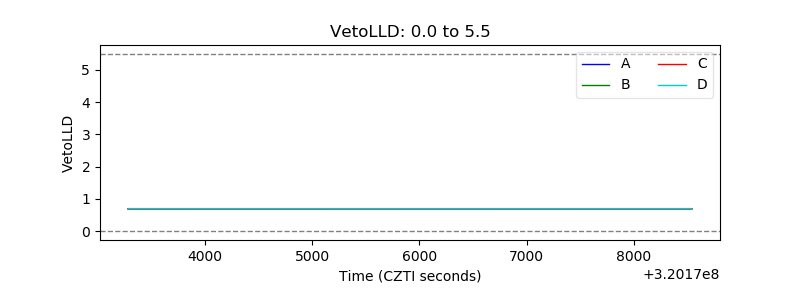 |
| Alpha Counter | 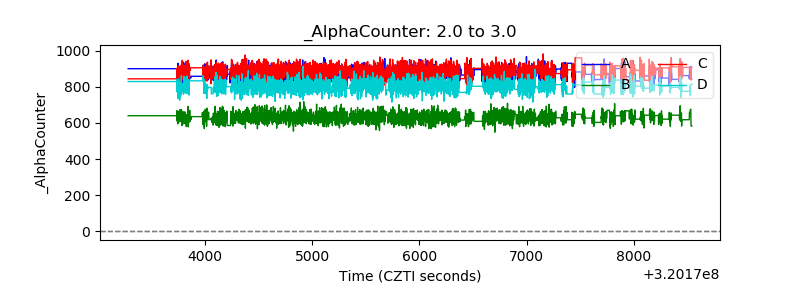 |
| _CPM_Rate | 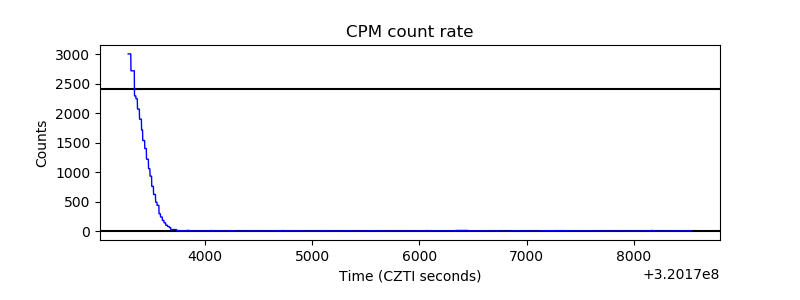 |
| CZT Counter | 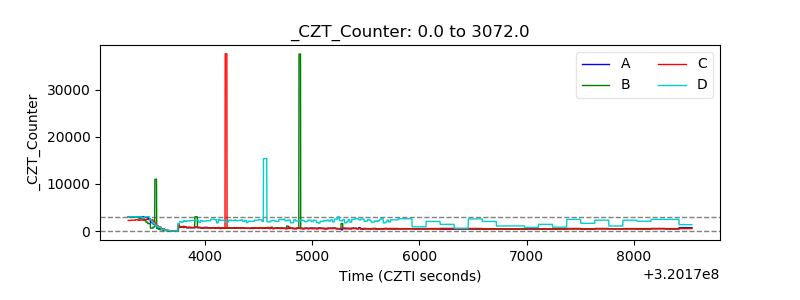 |
| +2.5 Volts monitor |  |
| +5 Volts monitor |  |
| _ROLL_ROT | 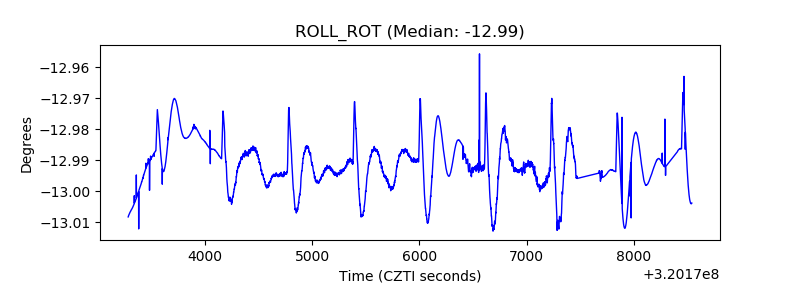 |
| _Roll_DEC | 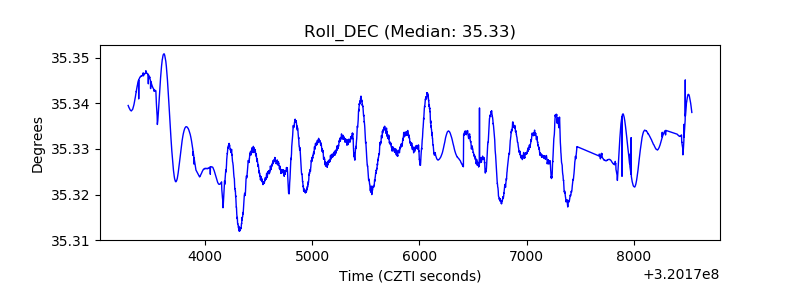 |
| _Roll_RA | 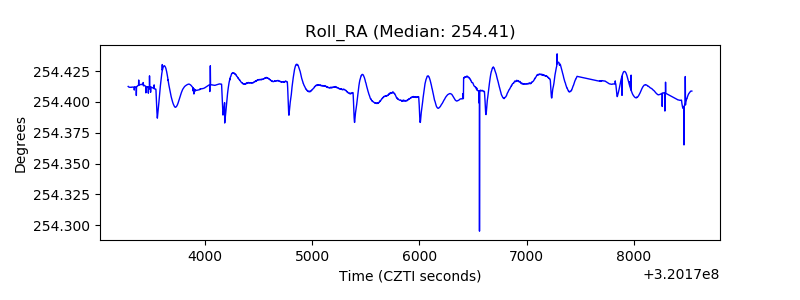 |
| Veto Counter | 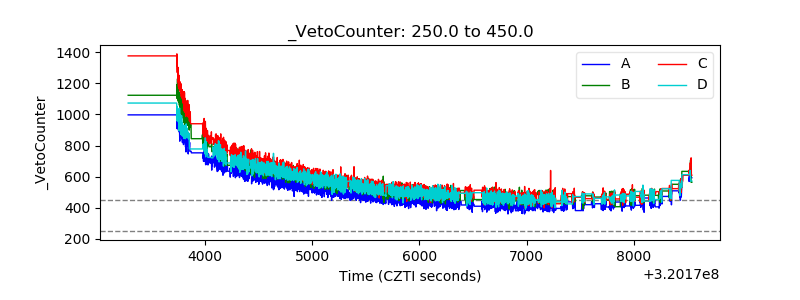 |