| Param | Original file | Final file |
|---|---|---|
| Filename | modeM0/AS1A07_113T01_9000003526_23829cztM0_level2.evt | modeM0/AS1A07_113T01_9000003526_23829cztM0_level2_quad_clean.evt |
| Size (bytes) | 956,661,120 | 126,673,920 |
| Size | 912.3 MB | 120.8 MB |
| Events in quadrant A | 4,469,424 | 827,228 |
| Events in quadrant B | 4,674,310 | 846,809 |
| Events in quadrant C | 4,681,341 | 828,108 |
| Events in quadrant D | 14,525,315 | 694,402 |
| Mode M9 | |||
|---|---|---|---|
| Quadrant | BADHDUFLAG | Total packets | Discarded packets |
| A | 0 | 3 | 0 |
| B | 0 | 3 | 0 |
| C | 0 | 3 | 0 |
| D | 0 | 3 | 0 |
| Mode SS | |||
|---|---|---|---|
| Quadrant | BADHDUFLAG | Total packets | Discarded packets |
| A | 0 | 188 | 0 |
| B | 0 | 188 | 0 |
| C | 0 | 188 | 0 |
| D | 0 | 188 | 0 |
| Mode M0 | |||
|---|---|---|---|
| Quadrant | BADHDUFLAG | Total packets | Discarded packets |
| A | 0 | 19096 | 1 |
| B | 0 | 19577 | 2 |
| C | 0 | 19591 | 5 |
| D | 0 | 49632 | 1 |
| Quadrant | Total seconds | Saturated seconds | Saturation percentage |
|---|---|---|---|
| A | 9210 | 41 | 0.445168% |
| B | 9210 | 108 | 1.172638% |
| C | 9209 | 156 | 1.693995% |
| D | 9211 | 3258 | 35.370752% |
Noise dominated data is calculated using 1-second bins in cleaned event files. If a bin has >2000 counts, and if more than 50% of those come from <1% of pixels, then it is considered to be noise-dominated and hence unusable.
| Quadrant | # 1 sec bins | Bins with >0 counts | Bins with >2000 counts | High rate bins dominated by noise | Noise dominated (total time) | Noise dominated (detector-on time) | Marked lightcurve |
|---|---|---|---|---|---|---|---|
| A | 37817 | 9212 | 0 | 0 | 0.00% | 0.00% | 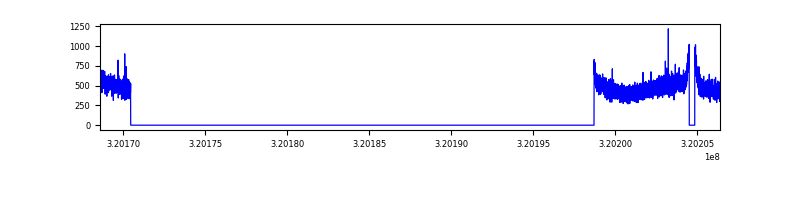 |
| B | 37818 | 9212 | 26 | 26 | 0.07% | 0.28% | 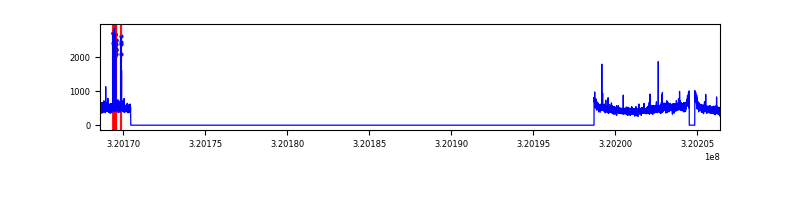 |
| C | 37818 | 9211 | 2 | 2 | 0.01% | 0.02% | 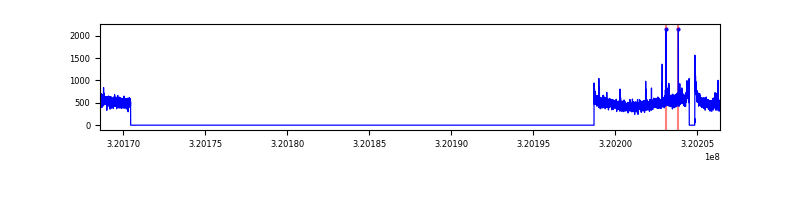 |
| D | 37818 | 9213 | 2986 | 2986 | 7.90% | 32.41% | 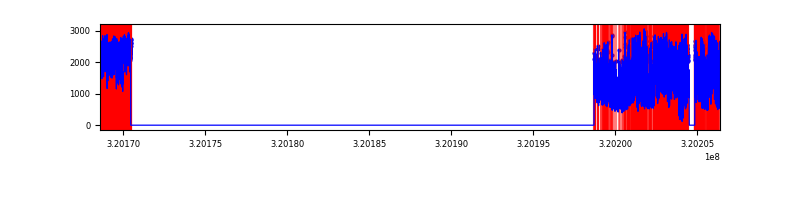 |
Top three noisy pixels from each quadrant. If the there are fewer than three noisy pixels in the level2.evt file, extra rows are filled as -1
| Pixel properties | Quadrant properties | ||||||
|---|---|---|---|---|---|---|---|
| Quadrant | DetID | PixID | Counts | Sigma | Mean | Median | Sigma |
| A | 13 | 254 | 15787 | 62.65 | 1159 | 1137 | 233.9 |
| A | 3 | 137 | 10144 | 38.52 | 1159 | 1137 | 233.9 |
| A | 0 | 226 | 9853 | 37.27 | 1159 | 1137 | 233.9 |
| B | 3 | 64 | 112304 | 501.98 | 1159 | 1131 | 221.5 |
| B | 12 | 111 | 26606 | 115.03 | 1159 | 1131 | 221.5 |
| B | 11 | 111 | 23476 | 100.89 | 1159 | 1131 | 221.5 |
| C | 14 | 238 | 183490 | 691.45 | 1129 | 1140 | 263.7 |
| C | 0 | 10 | 62622 | 233.13 | 1129 | 1140 | 263.7 |
| C | 0 | 207 | 30792 | 112.44 | 1129 | 1140 | 263.7 |
| D | 13 | 174 | 3923609 | 16515.35 | 987 | 961 | 237.5 |
| D | 1 | 52 | 3716720 | 15644.3 | 987 | 961 | 237.5 |
| D | 8 | 195 | 3131769 | 13181.5 | 987 | 961 | 237.5 |
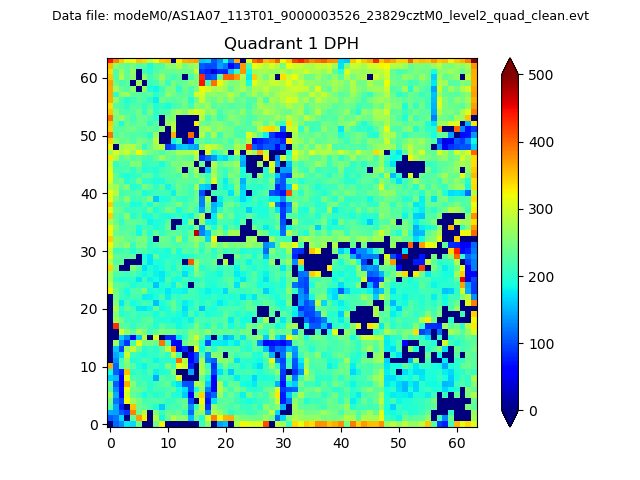
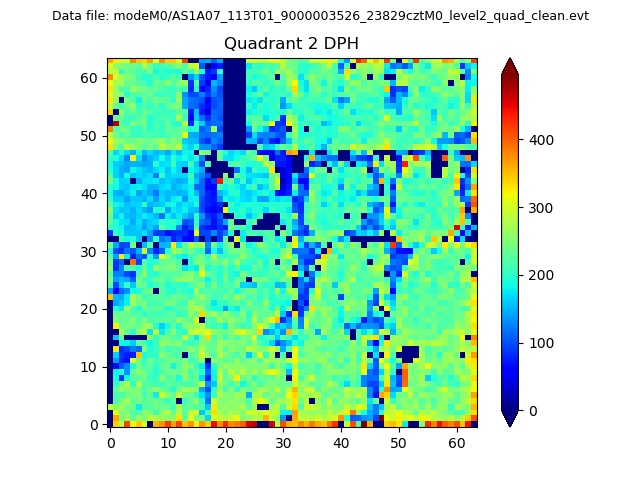
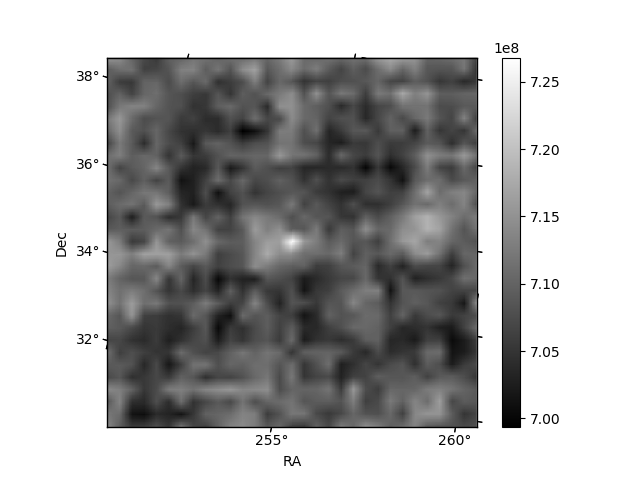
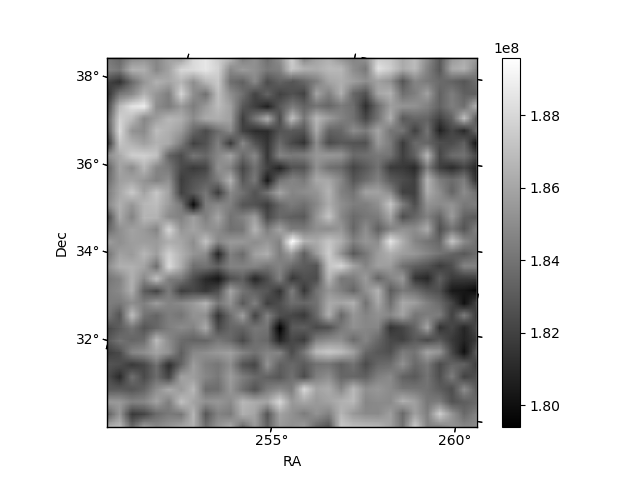
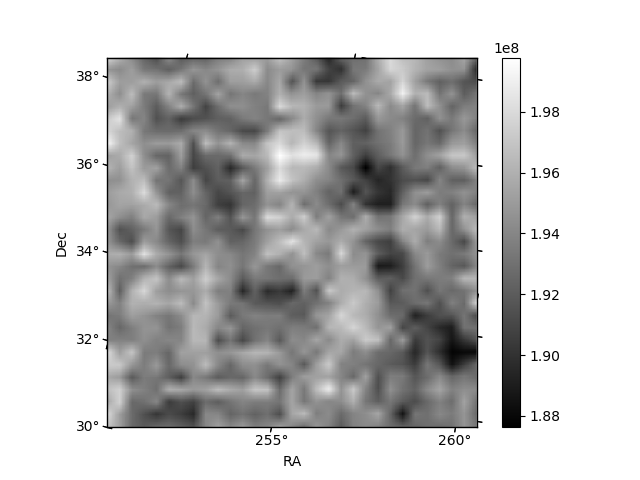
Histogram calculated using DETX and DETY for each event in the final _common_clean file
| Quadrant A |  |
 |
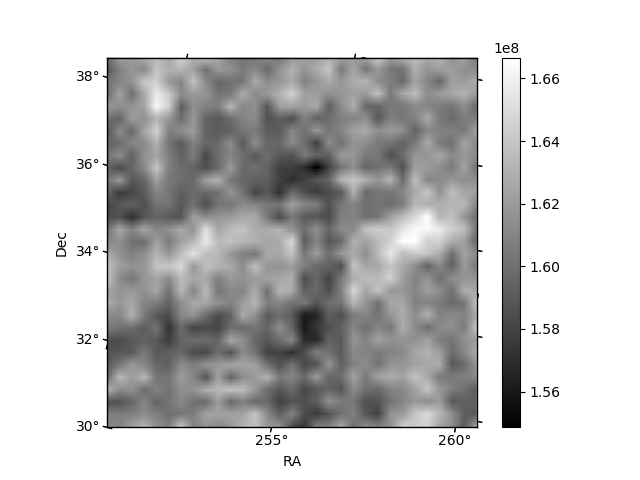
Quadrant B |
|---|---|---|---|
| Quadrant D | 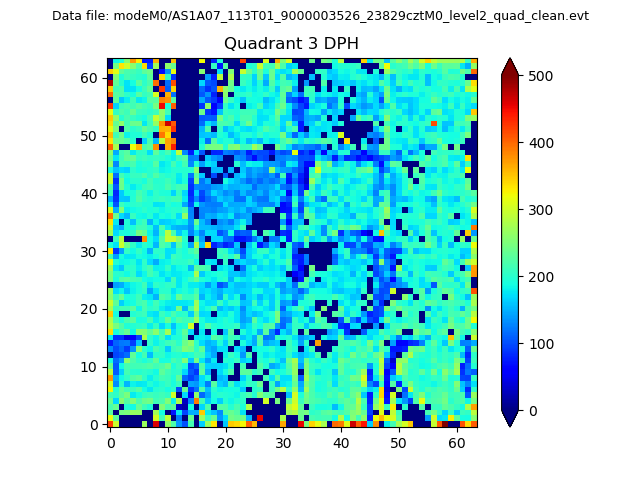 |
 |
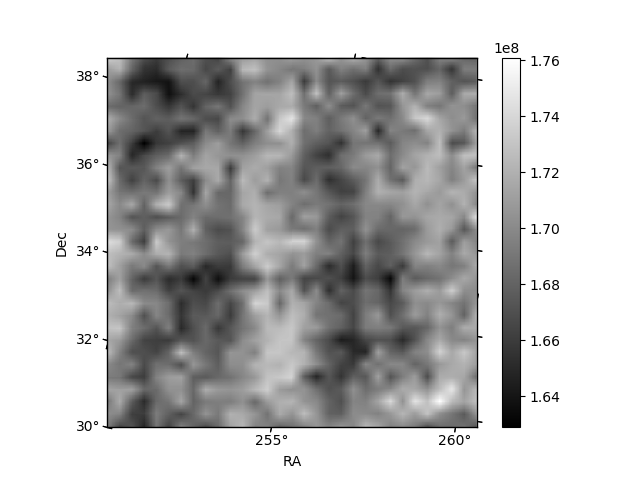
Quadrant C |
| Plot type | Count rate plots | Images |
|---|---|---|
| Comparison with Poisson distribution Blue bars denote a histogram of data divided into 1 sec bins. Red curve is a Poisson curve with rate = median count rate of data. |
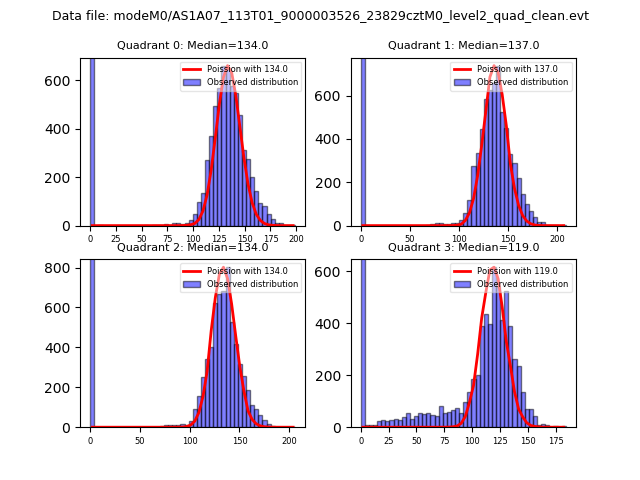 |
 |
| Quadrant-wise count rates Data is divided into 100 sec bins |
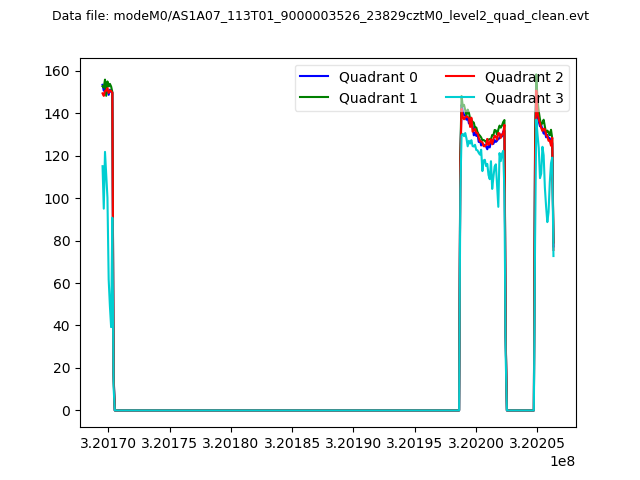 |
|
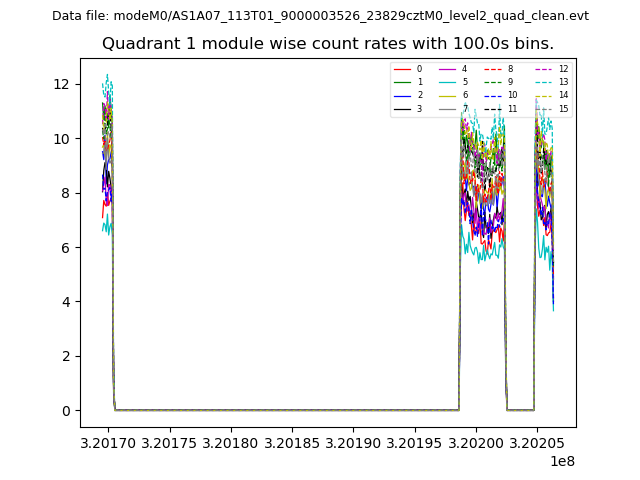
| Module-wise count rates for Quadrant A Data is divided into 100 sec bins |
 |
 |
| Module-wise count rates for Quadrant B Data is divided into 100 sec bins |
 |
 |
| Module-wise count rates for Quadrant C Data is divided into 100 sec bins |
 |
 |
| Module-wise count rates for Quadrant D Data is divided into 100 sec bins |
 |
 |
| Parameter | Plot |
|---|---|
| CZT HV Monitor | 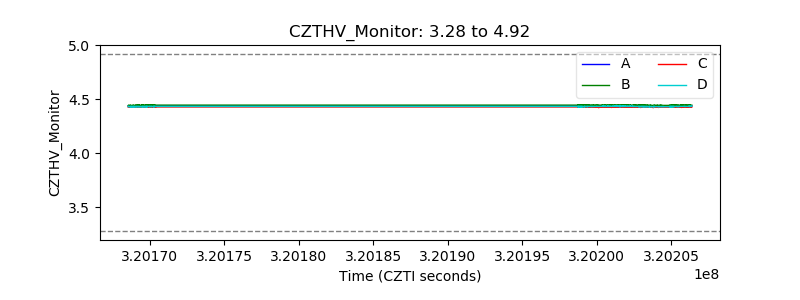 |
| D_VDD | 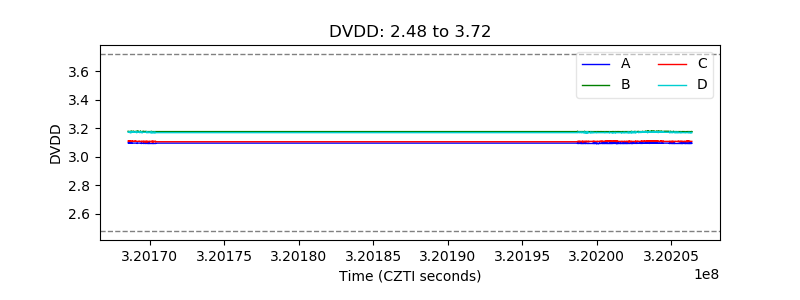 |
| Temperature 1 | 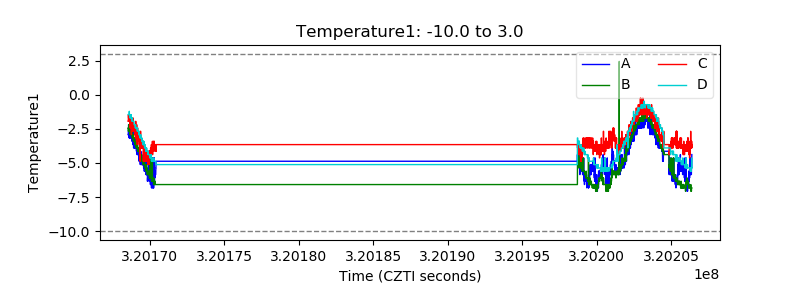 |
| Veto HV Monitor | 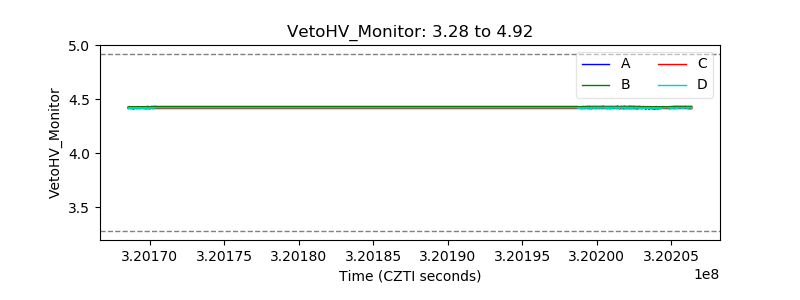 |
| Veto LLD | 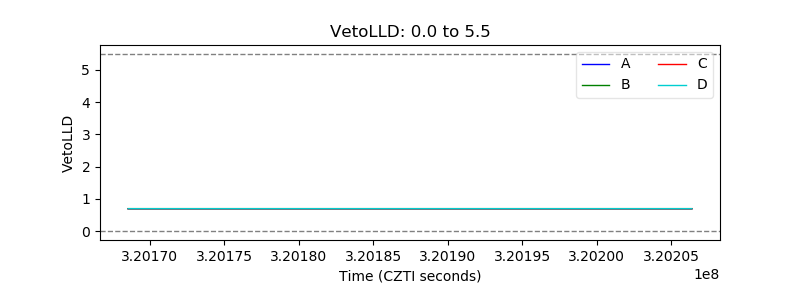 |
| Alpha Counter | 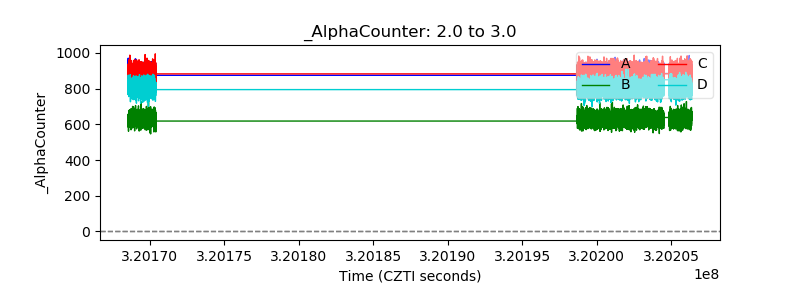 |
| _CPM_Rate | 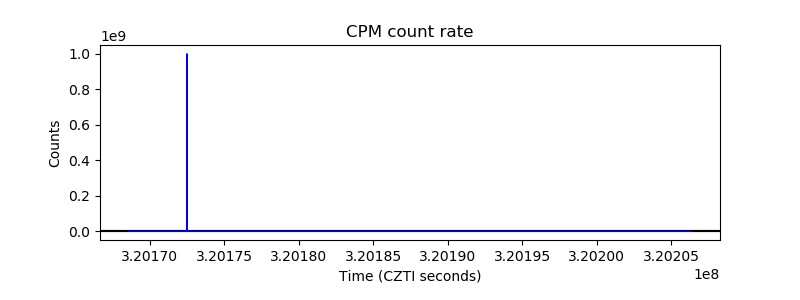 |
| CZT Counter | 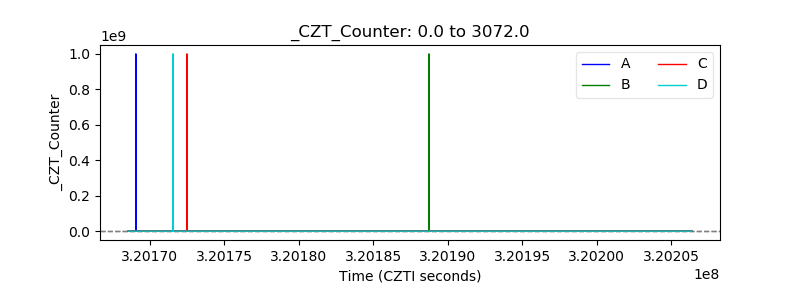 |
| +2.5 Volts monitor |  |
| +5 Volts monitor |  |
| _ROLL_ROT | 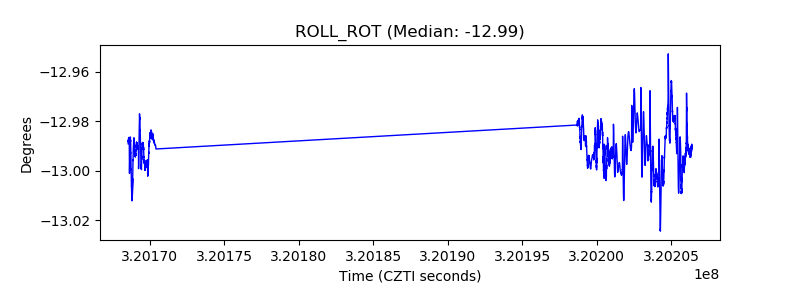 |
| _Roll_DEC | 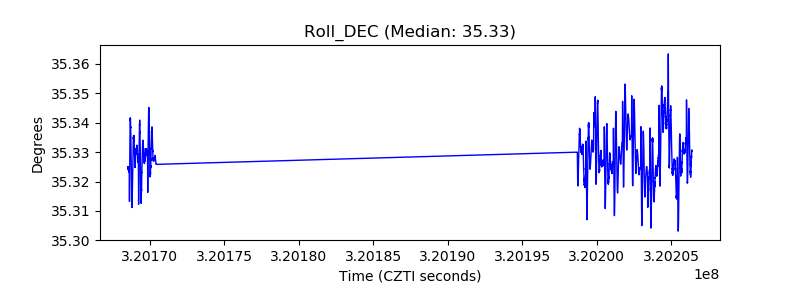 |
| _Roll_RA |  |
| Veto Counter | 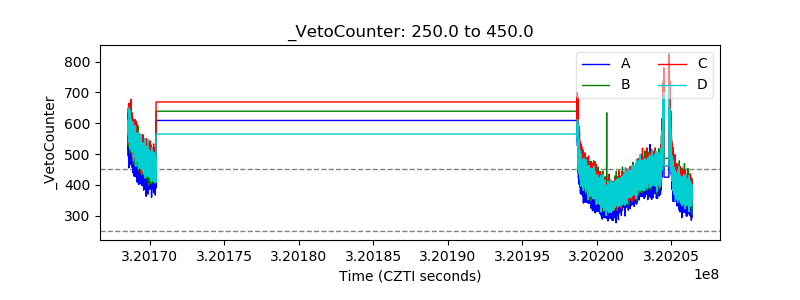 |