| Param | Original file | Final file |
|---|---|---|
| Filename | modeM0/AS1A07_113T01_9000003526_23831cztM0_level2.evt | modeM0/AS1A07_113T01_9000003526_23831cztM0_level2_quad_clean.evt |
| Size (bytes) | 354,778,560 | 62,694,720 |
| Size | 338.3 MB | 59.8 MB |
| Events in quadrant A | 2,124,193 | 407,659 |
| Events in quadrant B | 2,206,535 | 414,912 |
| Events in quadrant C | 2,302,846 | 401,772 |
| Events in quadrant D | 3,797,437 | 351,123 |
| Mode M9 | |||
|---|---|---|---|
| Quadrant | BADHDUFLAG | Total packets | Discarded packets |
| A | 0 | 3 | 1 |
| B | 0 | 3 | 0 |
| C | 0 | 3 | 1 |
| D | 0 | 3 | 2 |
| Mode SS | |||
|---|---|---|---|
| Quadrant | BADHDUFLAG | Total packets | Discarded packets |
| A | 0 | 137 | 31 |
| B | 0 | 138 | 50 |
| C | 0 | 138 | 38 |
| D | 0 | 137 | 45 |
| Mode M0 | |||
|---|---|---|---|
| Quadrant | BADHDUFLAG | Total packets | Discarded packets |
| A | 0 | 13898 | 4371 |
| B | 0 | 14280 | 4592 |
| C | 0 | 14404 | 4491 |
| D | 0 | 25978 | 11798 |
| Quadrant | Total seconds | Saturated seconds | Saturation percentage |
|---|---|---|---|
| A | 4707 | 6 | 0.127470% |
| B | 4708 | 20 | 0.424809% |
| C | 4713 | 45 | 0.954806% |
| D | 4162 | 240 | 5.766458% |
Noise dominated data is calculated using 1-second bins in cleaned event files. If a bin has >2000 counts, and if more than 50% of those come from <1% of pixels, then it is considered to be noise-dominated and hence unusable.
| Quadrant | # 1 sec bins | Bins with >0 counts | Bins with >2000 counts | High rate bins dominated by noise | Noise dominated (total time) | Noise dominated (detector-on time) | Marked lightcurve |
|---|---|---|---|---|---|---|---|
| A | 7120 | 5335 | 0 | 0 | 0.00% | 0.00% | 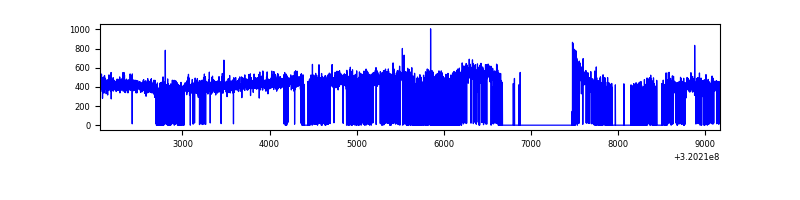 |
| B | 7119 | 5293 | 4 | 4 | 0.06% | 0.08% | 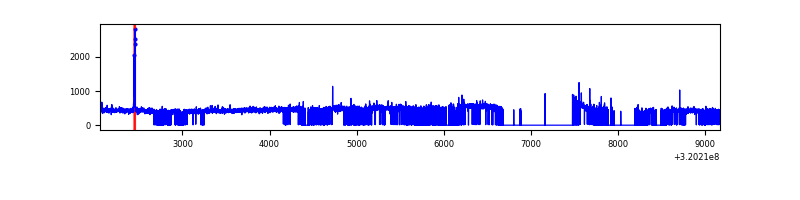 |
| C | 7120 | 5332 | 18 | 18 | 0.25% | 0.34% | 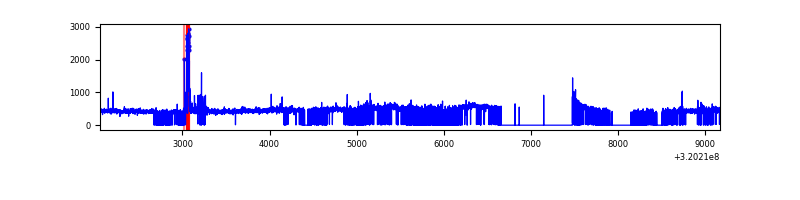 |
| D | 7119 | 4784 | 169 | 169 | 2.37% | 3.53% | 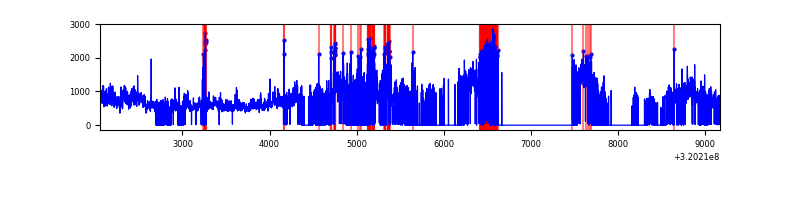 |
Top three noisy pixels from each quadrant. If the there are fewer than three noisy pixels in the level2.evt file, extra rows are filled as -1
| Pixel properties | Quadrant properties | ||||||
|---|---|---|---|---|---|---|---|
| Quadrant | DetID | PixID | Counts | Sigma | Mean | Median | Sigma |
| A | 13 | 254 | 7623 | 63.16 | 550 | 539 | 112.2 |
| A | 3 | 137 | 4924 | 39.09 | 550 | 539 | 112.2 |
| A | 0 | 226 | 4845 | 38.39 | 550 | 539 | 112.2 |
| B | 3 | 209 | 25381 | 232.9 | 550 | 537 | 106.7 |
| B | 12 | 111 | 12883 | 115.74 | 550 | 537 | 106.7 |
| B | 3 | 64 | 11759 | 105.2 | 550 | 537 | 106.7 |
| C | 2 | 16 | 86134 | 684.14 | 528 | 533 | 125.1 |
| C | 14 | 238 | 83534 | 663.36 | 528 | 533 | 125.1 |
| C | 0 | 239 | 31691 | 249.02 | 528 | 533 | 125.1 |
| D | 8 | 195 | 1212674 | 10738.72 | 458 | 445 | 112.9 |
| D | 13 | 174 | 421345 | 3728.61 | 458 | 445 | 112.9 |
| D | 1 | 52 | 410798 | 3635.18 | 458 | 445 | 112.9 |
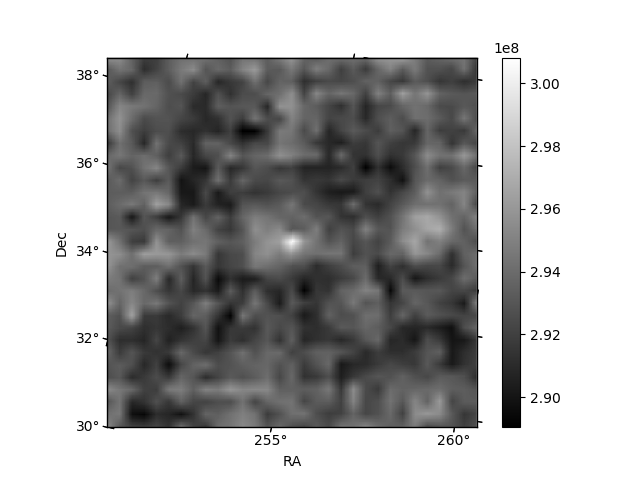
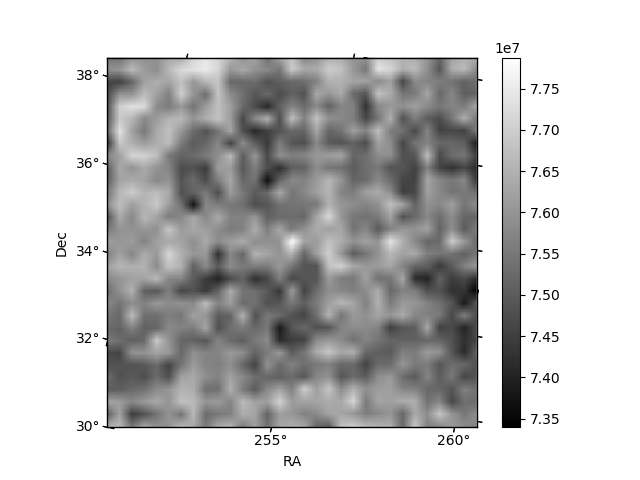
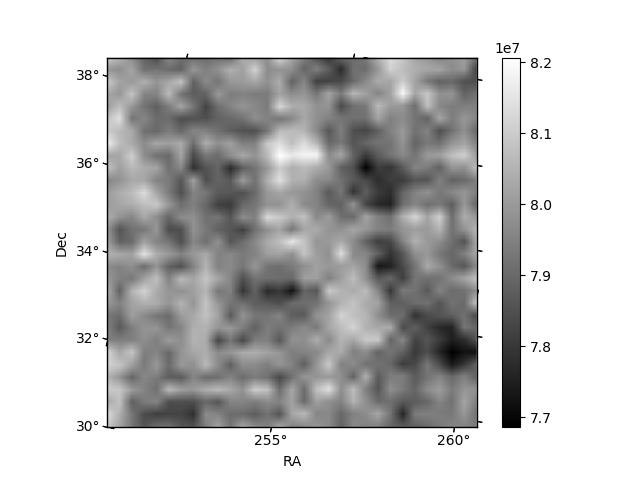
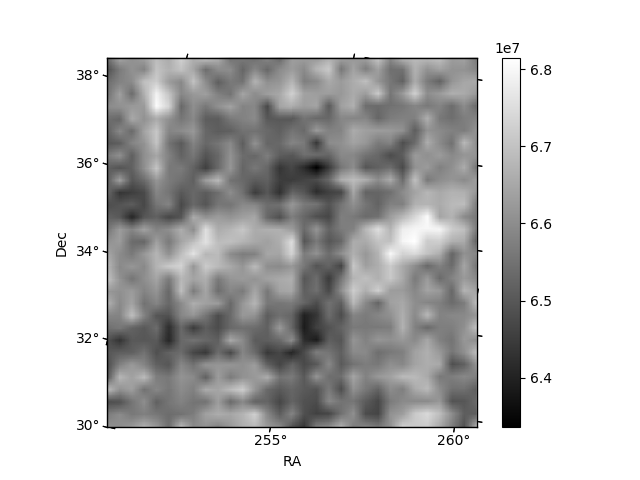
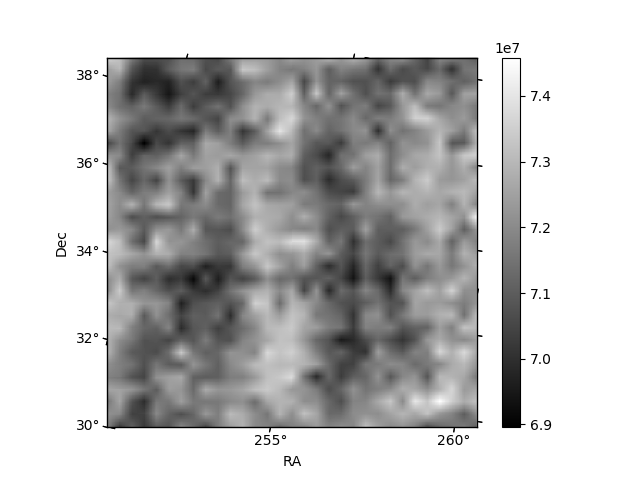
Histogram calculated using DETX and DETY for each event in the final _common_clean file
| Quadrant A | 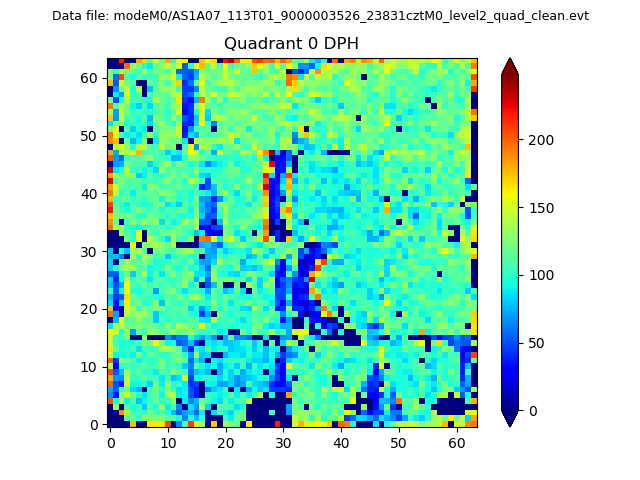 |
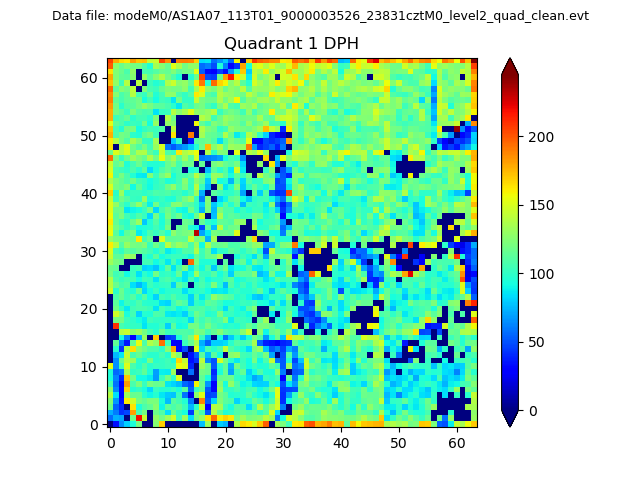 |
Quadrant B |
|---|---|---|---|
| Quadrant D | 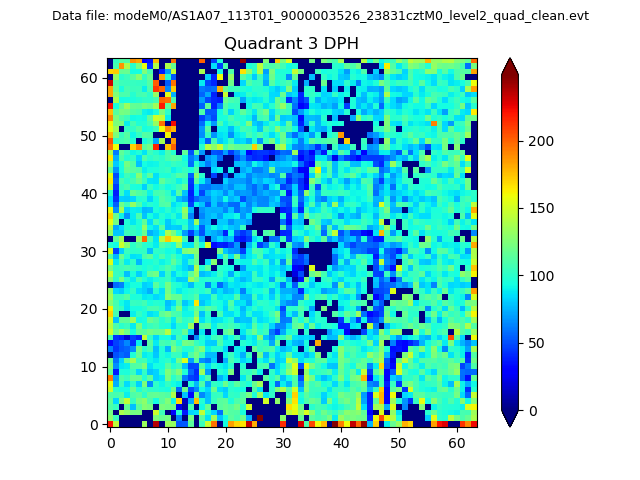 |
 |
Quadrant C |
| Plot type | Count rate plots | Images |
|---|---|---|
| Comparison with Poisson distribution Blue bars denote a histogram of data divided into 1 sec bins. Red curve is a Poisson curve with rate = median count rate of data. |
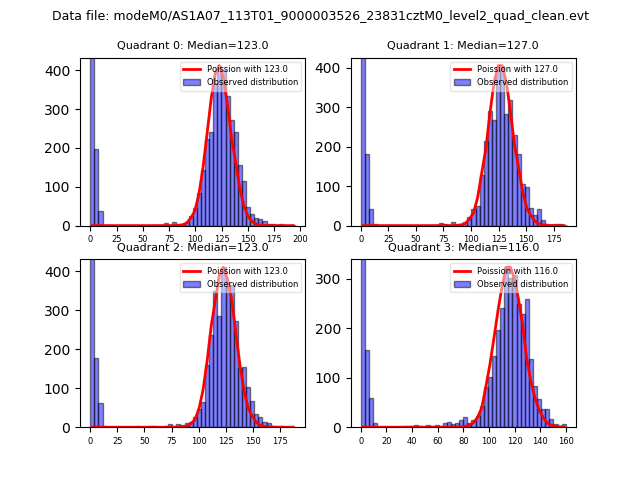 |
 |
| Quadrant-wise count rates Data is divided into 100 sec bins |
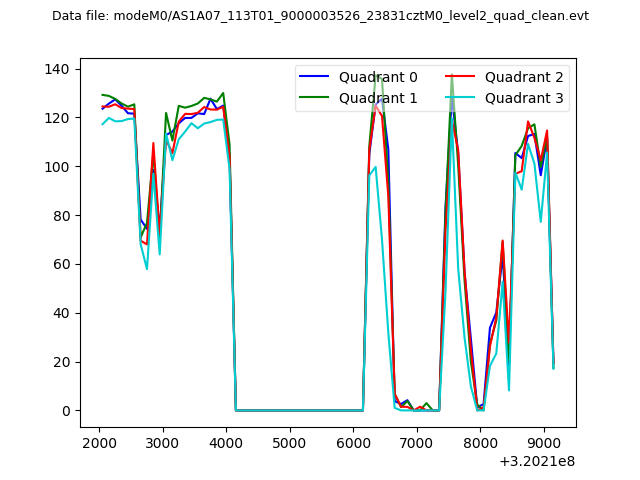 |
|
| Module-wise count rates for Quadrant A Data is divided into 100 sec bins |
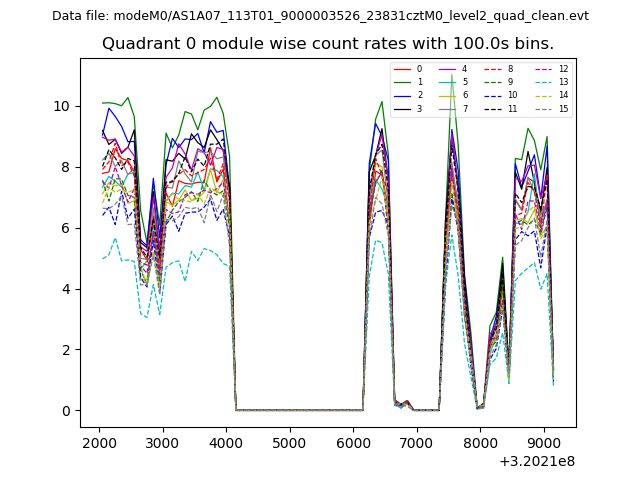 |
 |
| Module-wise count rates for Quadrant B Data is divided into 100 sec bins |
 |
 |
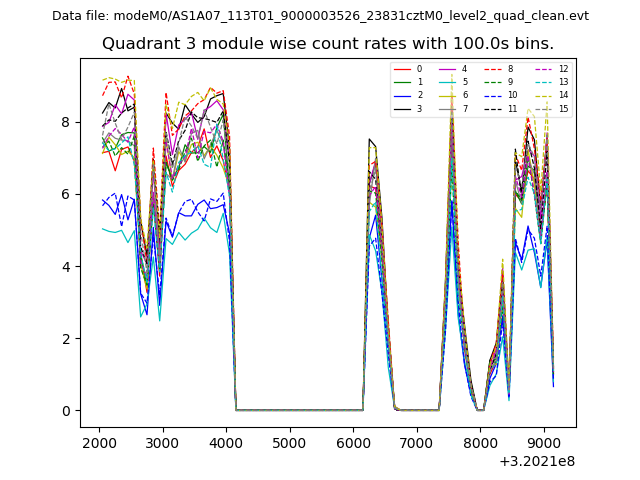
| Module-wise count rates for Quadrant C Data is divided into 100 sec bins |
 |
 |
| Module-wise count rates for Quadrant D Data is divided into 100 sec bins |
 |
 |
| Parameter | Plot |
|---|---|
| CZT HV Monitor | 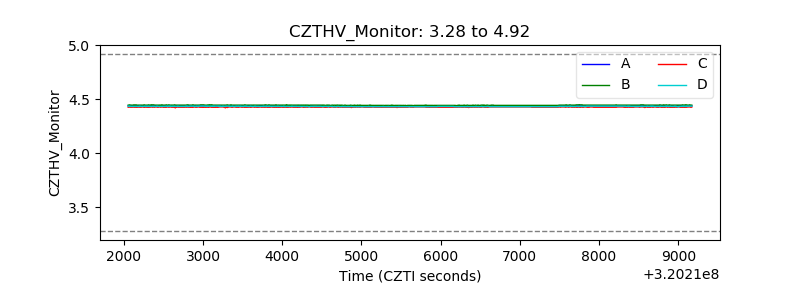 |
| D_VDD | 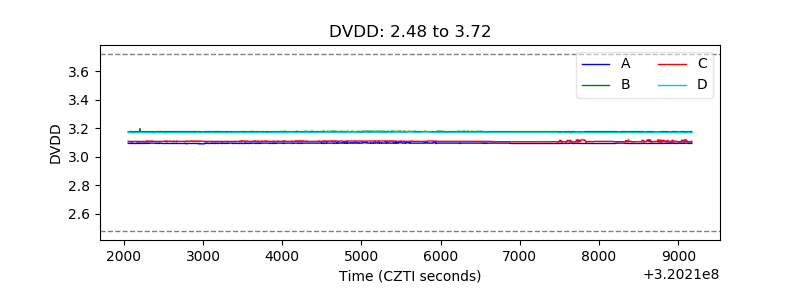 |
| Temperature 1 |  |
| Veto HV Monitor | 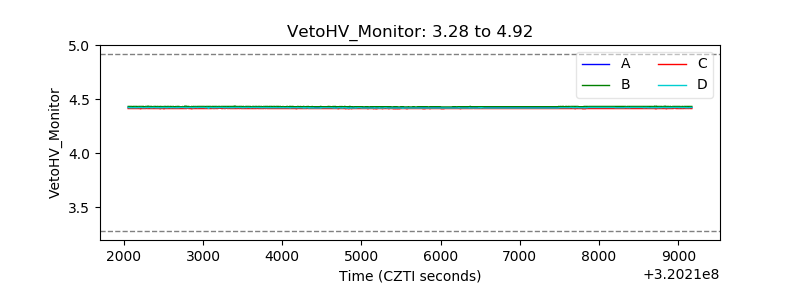 |
| Veto LLD |  |
| Alpha Counter | 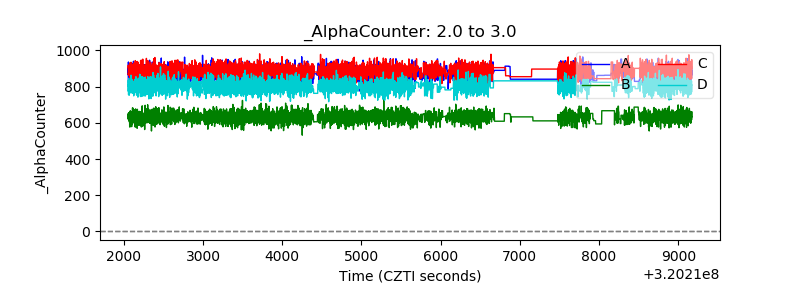 |
| _CPM_Rate | 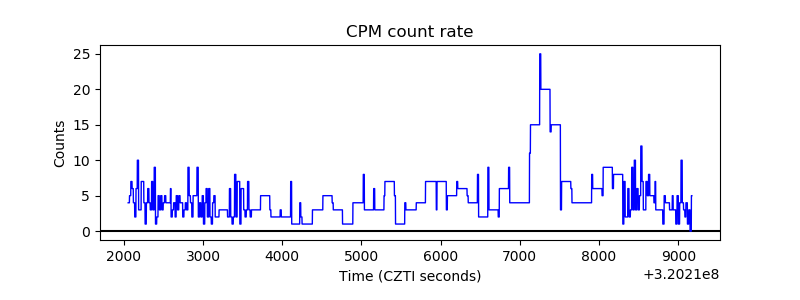 |
| CZT Counter | 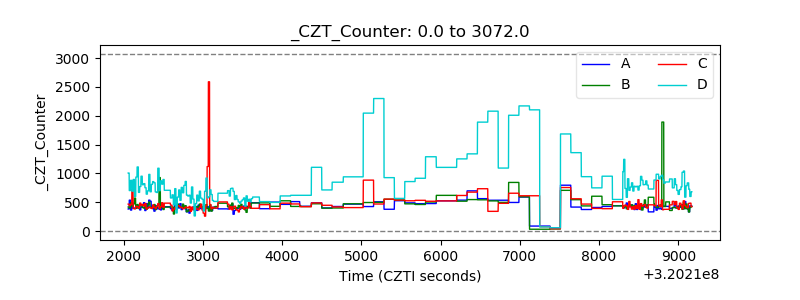 |
| +2.5 Volts monitor |  |
| +5 Volts monitor | 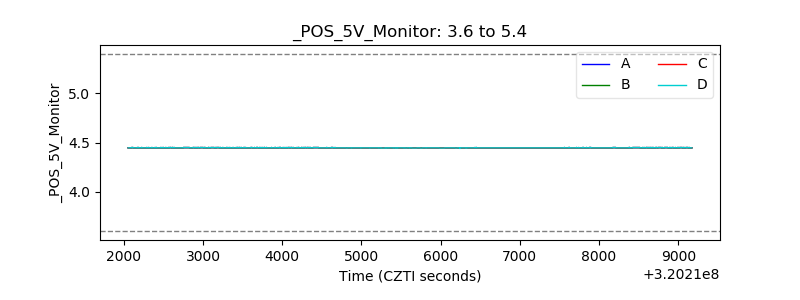 |
| _ROLL_ROT | 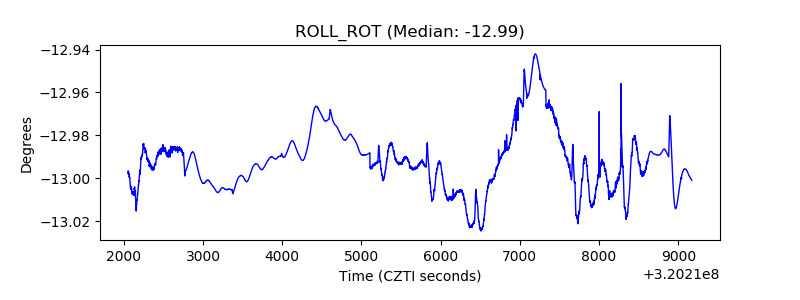 |
| _Roll_DEC | 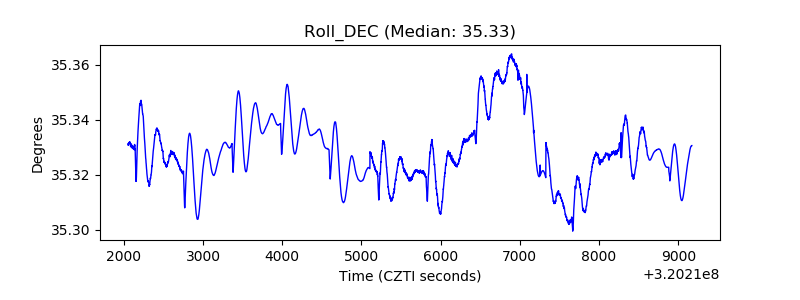 |
| _Roll_RA | 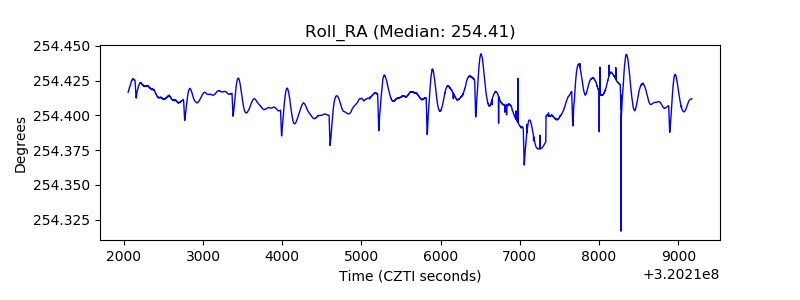 |
| Veto Counter | 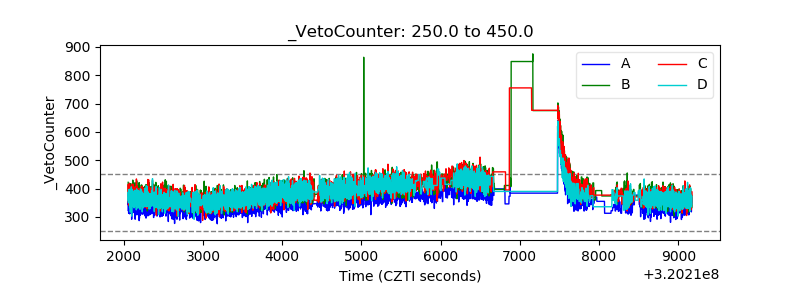 |