| Param | Original file | Final file |
|---|---|---|
| Filename | modeM0/AS1A07_113T01_9000003526_23833cztM0_level2.evt | modeM0/AS1A07_113T01_9000003526_23833cztM0_level2_quad_clean.evt |
| Size (bytes) | 1,181,957,760 | 210,628,800 |
| Size | 1.1 GB | 200.9 MB |
| Events in quadrant A | 6,748,177 | 1,350,776 |
| Events in quadrant B | 7,078,443 | 1,388,313 |
| Events in quadrant C | 7,438,145 | 1,347,753 |
| Events in quadrant D | 13,550,390 | 1,289,066 |
| Mode M9 | |||
|---|---|---|---|
| Quadrant | BADHDUFLAG | Total packets | Discarded packets |
| A | 0 | 12 | 0 |
| B | 0 | 12 | 0 |
| C | 0 | 12 | 0 |
| D | 0 | 12 | 0 |
| Mode SS | |||
|---|---|---|---|
| Quadrant | BADHDUFLAG | Total packets | Discarded packets |
| A | 0 | 294 | 0 |
| B | 0 | 294 | 0 |
| C | 0 | 294 | 0 |
| D | 0 | 294 | 0 |
| Mode M0 | |||
|---|---|---|---|
| Quadrant | BADHDUFLAG | Total packets | Discarded packets |
| A | 0 | 29457 | 2 |
| B | 0 | 30219 | 2 |
| C | 0 | 31193 | 2 |
| D | 0 | 50583 | 2 |
| Quadrant | Total seconds | Saturated seconds | Saturation percentage |
|---|---|---|---|
| A | 14540 | 94 | 0.646492% |
| B | 14541 | 143 | 0.983426% |
| C | 14542 | 225 | 1.547242% |
| D | 14542 | 361 | 2.482465% |
Noise dominated data is calculated using 1-second bins in cleaned event files. If a bin has >2000 counts, and if more than 50% of those come from <1% of pixels, then it is considered to be noise-dominated and hence unusable.
| Quadrant | # 1 sec bins | Bins with >0 counts | Bins with >2000 counts | High rate bins dominated by noise | Noise dominated (total time) | Noise dominated (detector-on time) | Marked lightcurve |
|---|---|---|---|---|---|---|---|
| A | 44404 | 14543 | 0 | 0 | 0.00% | 0.00% |  |
| B | 44404 | 14544 | 13 | 13 | 0.03% | 0.09% | 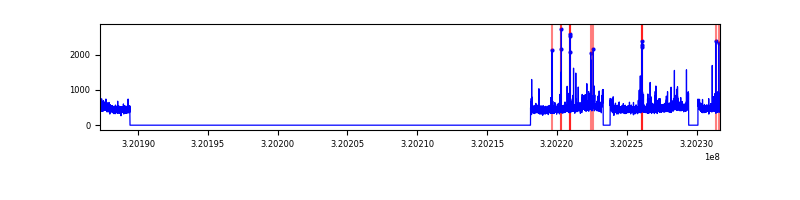 |
| C | 44405 | 14545 | 48 | 48 | 0.11% | 0.33% | 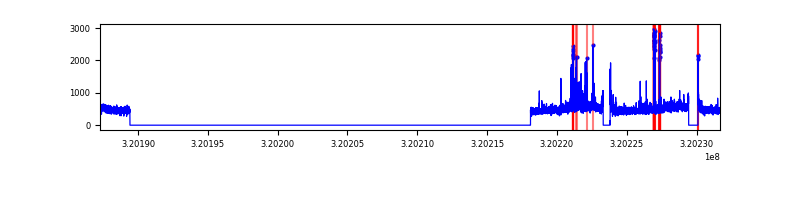 |
| D | 44405 | 14545 | 130 | 130 | 0.29% | 0.89% | 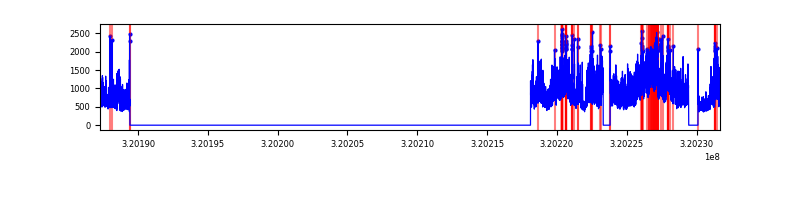 |
Top three noisy pixels from each quadrant. If the there are fewer than three noisy pixels in the level2.evt file, extra rows are filled as -1
| Pixel properties | Quadrant properties | ||||||
|---|---|---|---|---|---|---|---|
| Quadrant | DetID | PixID | Counts | Sigma | Mean | Median | Sigma |
| A | 13 | 254 | 25627 | 68.09 | 1746 | 1710 | 351.3 |
| A | 3 | 137 | 15481 | 39.21 | 1746 | 1710 | 351.3 |
| A | 0 | 226 | 15118 | 38.17 | 1746 | 1710 | 351.3 |
| B | 3 | 64 | 193512 | 582.69 | 1742 | 1701 | 329.2 |
| B | 12 | 111 | 40537 | 117.98 | 1742 | 1701 | 329.2 |
| B | 11 | 111 | 35959 | 104.07 | 1742 | 1701 | 329.2 |
| C | 14 | 238 | 264806 | 671.42 | 1682 | 1696 | 391.9 |
| C | 0 | 239 | 214889 | 544.04 | 1682 | 1696 | 391.9 |
| C | 0 | 207 | 148390 | 374.34 | 1682 | 1696 | 391.9 |
| D | 8 | 195 | 3543399 | 8658.66 | 1689 | 1640 | 409.0 |
| D | 13 | 174 | 3090301 | 7550.96 | 1689 | 1640 | 409.0 |
| D | 1 | 52 | 195729 | 474.5 | 1689 | 1640 | 409.0 |
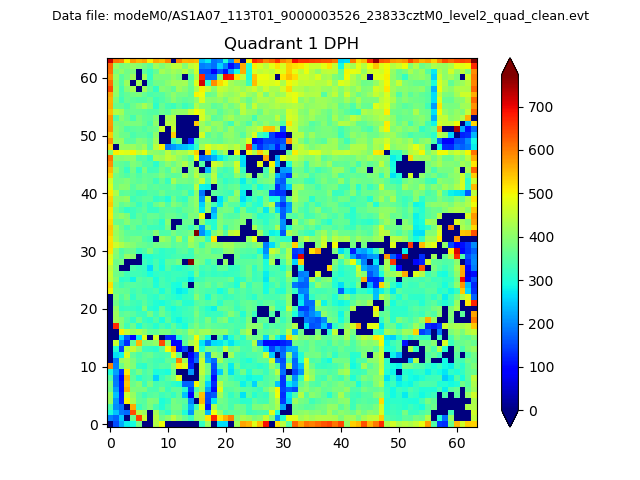
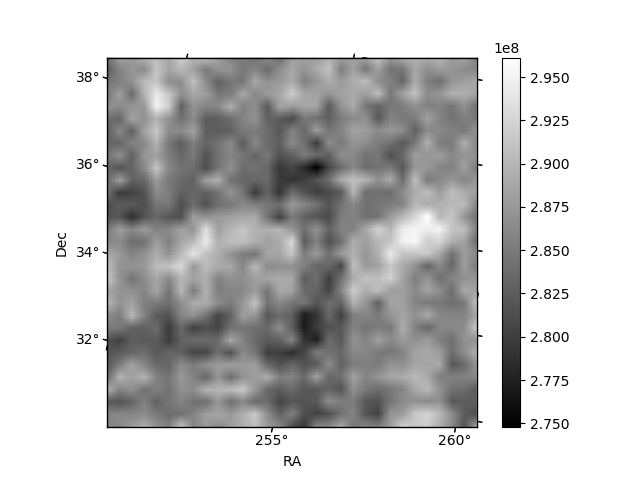
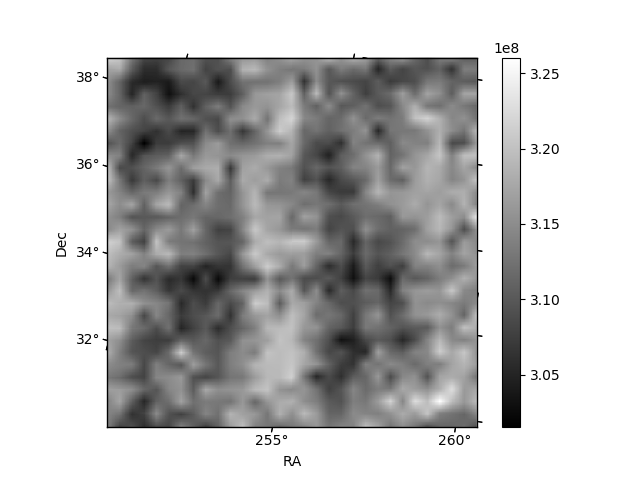
Histogram calculated using DETX and DETY for each event in the final _common_clean file
| Quadrant A | 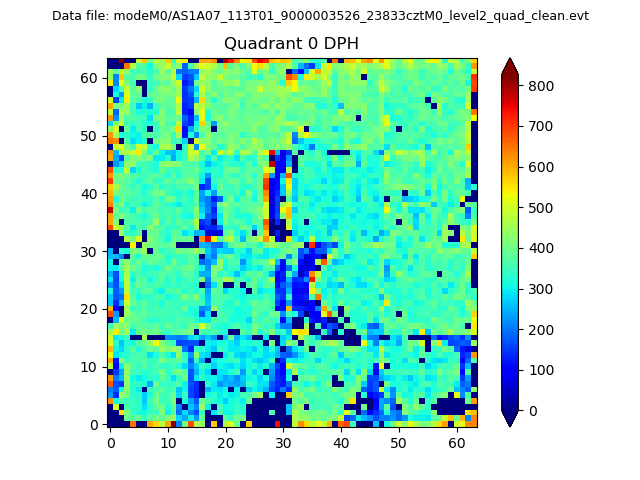 |
 |
Quadrant B |
|---|---|---|---|
| Quadrant D | 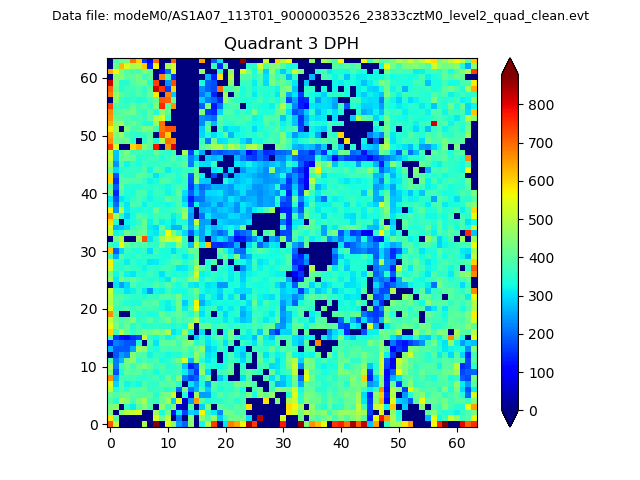 |
 |
Quadrant C |
| Plot type | Count rate plots | Images |
|---|---|---|
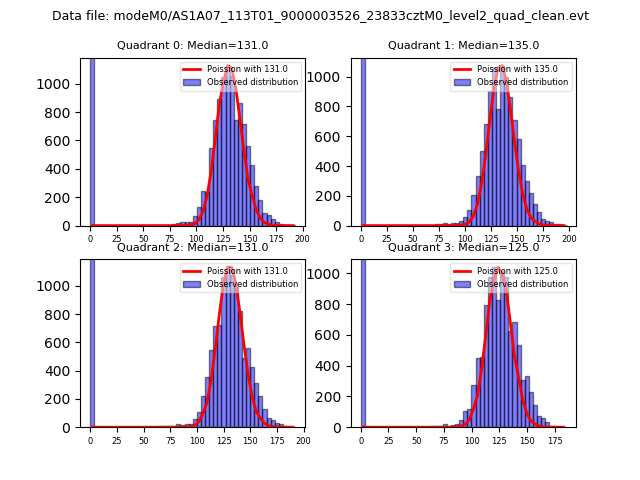
| Comparison with Poisson distribution Blue bars denote a histogram of data divided into 1 sec bins. Red curve is a Poisson curve with rate = median count rate of data. |
 |
 |
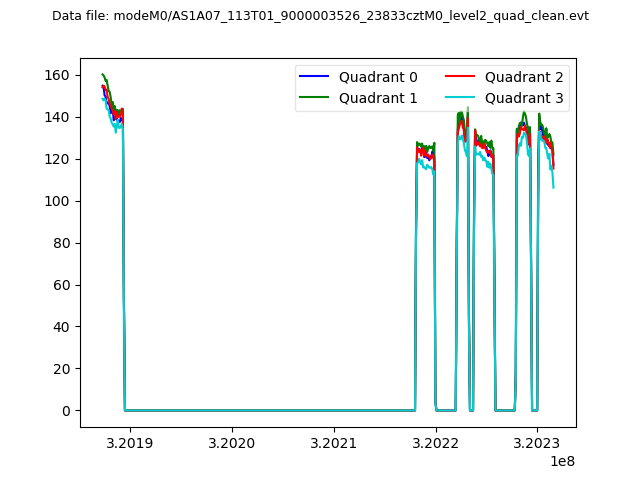
| Quadrant-wise count rates Data is divided into 100 sec bins |
 |
|
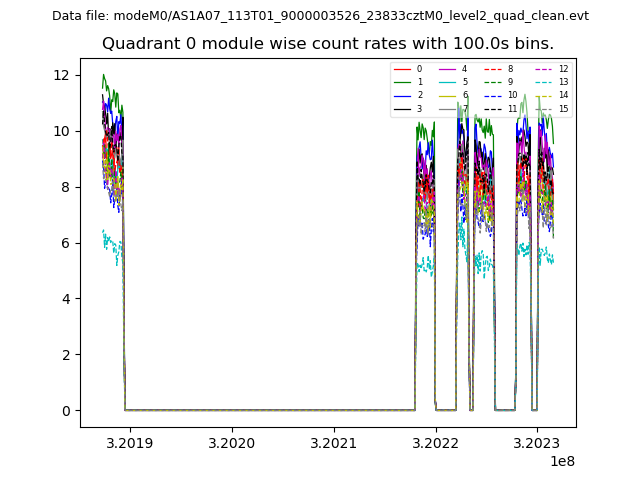
| Module-wise count rates for Quadrant A Data is divided into 100 sec bins |
 |
 |
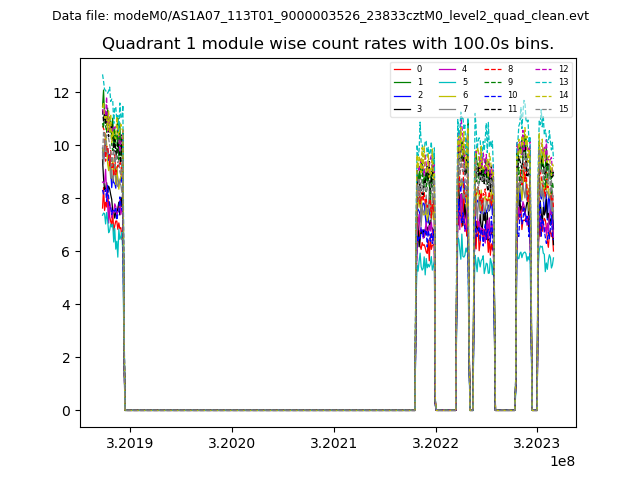
| Module-wise count rates for Quadrant B Data is divided into 100 sec bins |
 |
 |
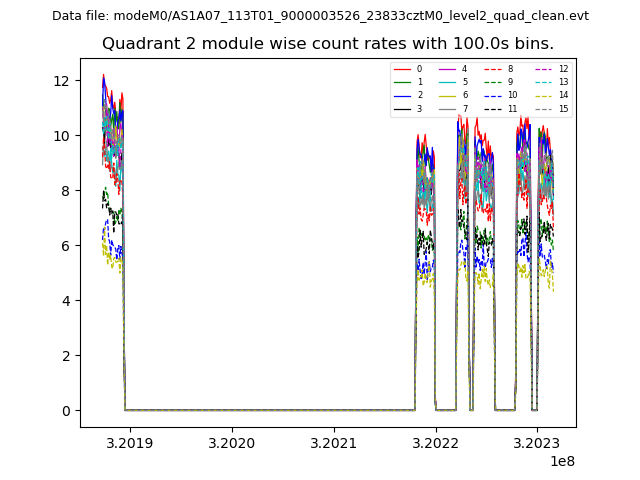
| Module-wise count rates for Quadrant C Data is divided into 100 sec bins |
 |
 |
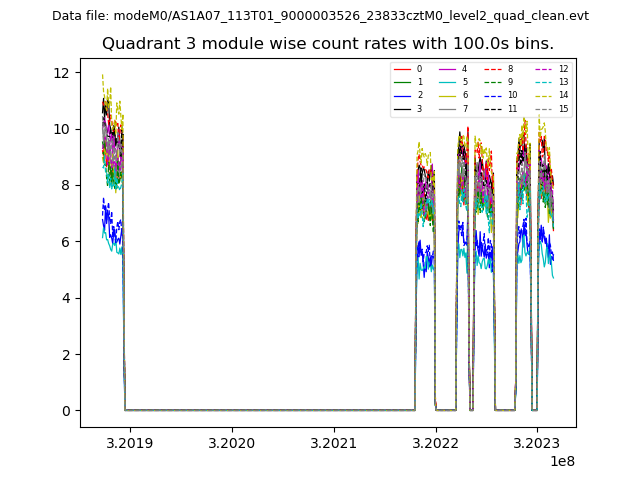
| Module-wise count rates for Quadrant D Data is divided into 100 sec bins |
 |
 |
| Parameter | Plot |
|---|---|
| CZT HV Monitor | 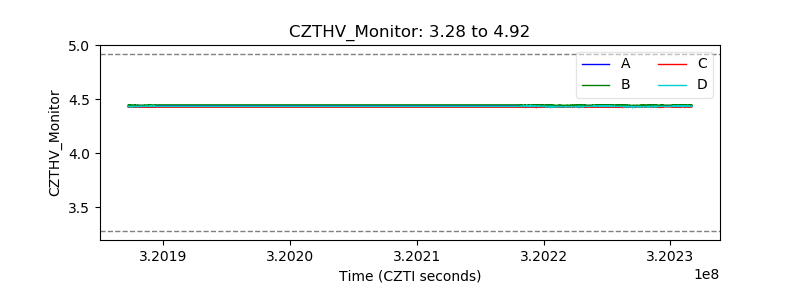 |
| D_VDD | 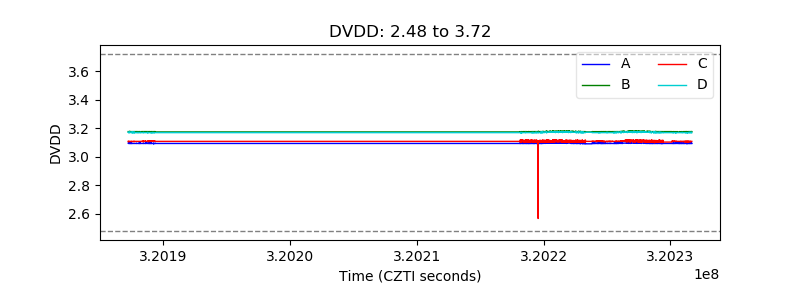 |
| Temperature 1 | 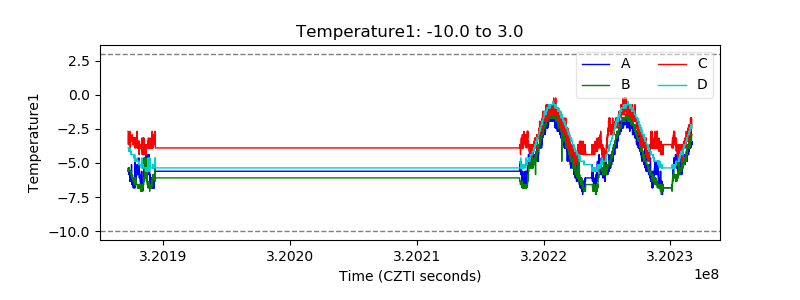 |
| Veto HV Monitor | 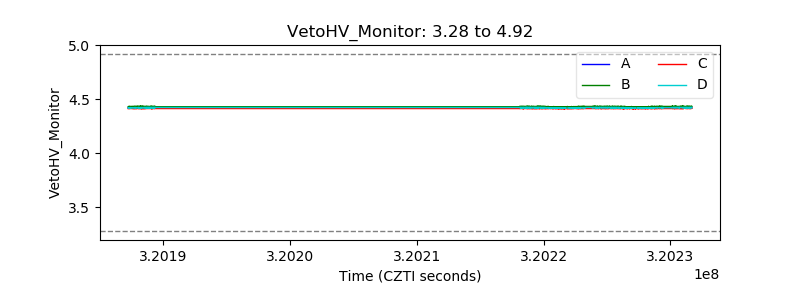 |
| Veto LLD | 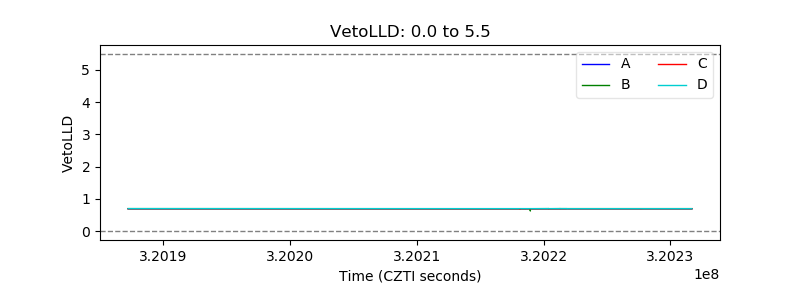 |
| Alpha Counter | 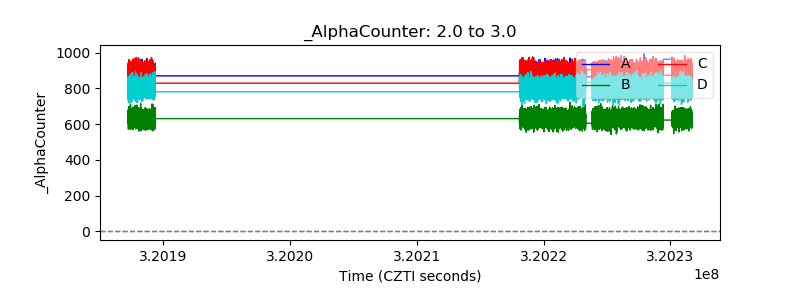 |
| _CPM_Rate | 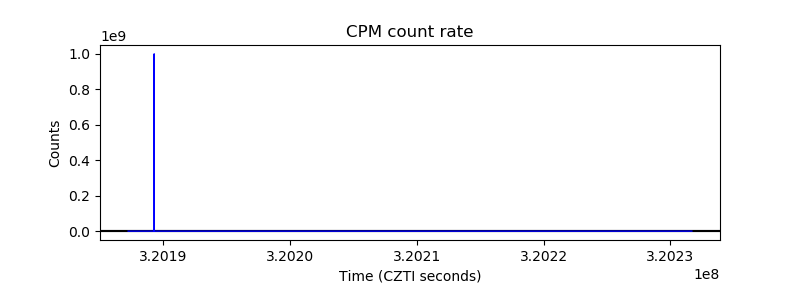 |
| CZT Counter |  |
| +2.5 Volts monitor | 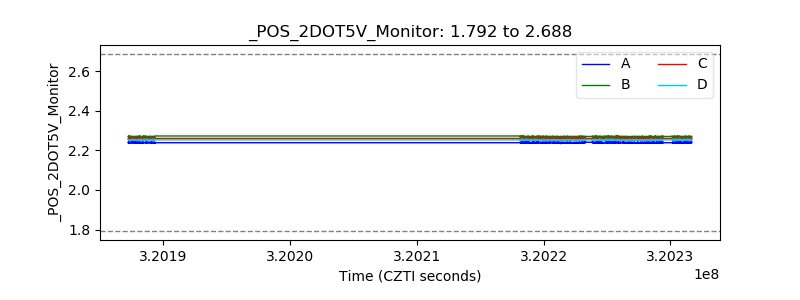 |
| +5 Volts monitor |  |
| _ROLL_ROT | 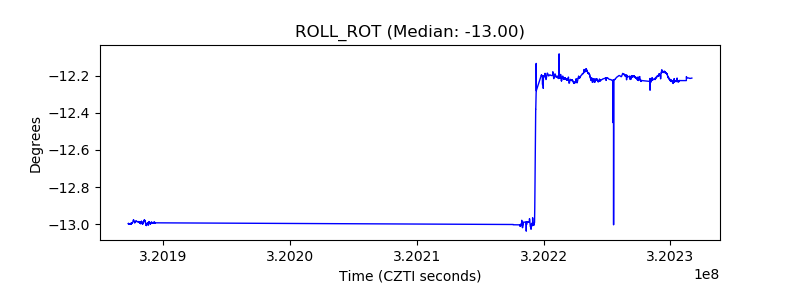 |
| _Roll_DEC | 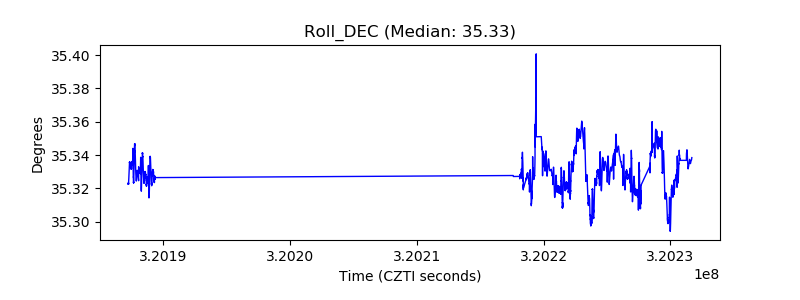 |
| _Roll_RA | 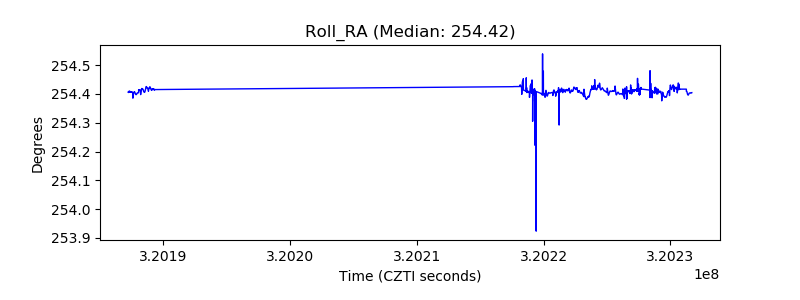 |
| Veto Counter | 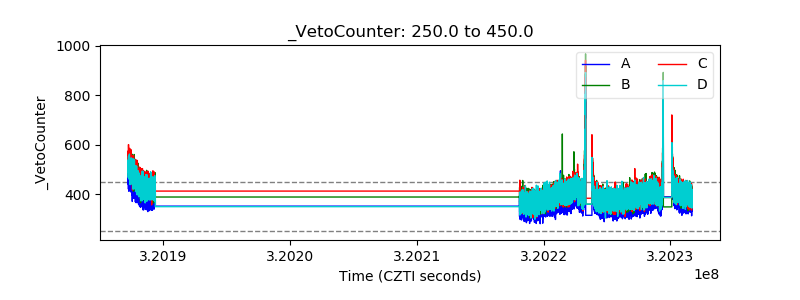 |