| Param | Original file | Final file |
|---|---|---|
| Filename | modeM0/AS1A07_113T01_9000003526_23837cztM0_level2.evt | modeM0/AS1A07_113T01_9000003526_23837cztM0_level2_quad_clean.evt |
| Size (bytes) | 598,196,160 | 68,664,960 |
| Size | 570.5 MB | 65.5 MB |
| Events in quadrant A | 3,271,102 | 416,955 |
| Events in quadrant B | 3,389,394 | 424,453 |
| Events in quadrant C | 3,534,893 | 409,560 |
| Events in quadrant D | 7,492,594 | 385,633 |
| Mode M9 | |||
|---|---|---|---|
| Quadrant | BADHDUFLAG | Total packets | Discarded packets |
| A | 0 | 12 | 0 |
| B | 0 | 12 | 0 |
| C | 0 | 12 | 0 |
| D | 0 | 12 | 0 |
| Mode SS | |||
|---|---|---|---|
| Quadrant | BADHDUFLAG | Total packets | Discarded packets |
| A | 0 | 128 | 0 |
| B | 0 | 128 | 0 |
| C | 0 | 128 | 0 |
| D | 0 | 128 | 0 |
| Mode M0 | |||
|---|---|---|---|
| Quadrant | BADHDUFLAG | Total packets | Discarded packets |
| A | 0 | 13725 | 1 |
| B | 0 | 13987 | 1 |
| C | 0 | 14610 | 1 |
| D | 0 | 26785 | 1 |
| Quadrant | Total seconds | Saturated seconds | Saturation percentage |
|---|---|---|---|
| A | 6341 | 81 | 1.277401% |
| B | 6342 | 85 | 1.340271% |
| C | 6342 | 121 | 1.907915% |
| D | 6342 | 465 | 7.332072% |
Noise dominated data is calculated using 1-second bins in cleaned event files. If a bin has >2000 counts, and if more than 50% of those come from <1% of pixels, then it is considered to be noise-dominated and hence unusable.
| Quadrant | # 1 sec bins | Bins with >0 counts | Bins with >2000 counts | High rate bins dominated by noise | Noise dominated (total time) | Noise dominated (detector-on time) | Marked lightcurve |
|---|---|---|---|---|---|---|---|
| A | 7496 | 6342 | 0 | 0 | 0.00% | 0.00% |  |
| B | 7497 | 6343 | 10 | 10 | 0.13% | 0.16% |  |
| C | 7497 | 6343 | 1 | 1 | 0.01% | 0.02% |  |
| D | 7497 | 6343 | 263 | 263 | 3.51% | 4.15% |  |
Top three noisy pixels from each quadrant. If the there are fewer than three noisy pixels in the level2.evt file, extra rows are filled as -1
| Pixel properties | Quadrant properties | ||||||
|---|---|---|---|---|---|---|---|
| Quadrant | DetID | PixID | Counts | Sigma | Mean | Median | Sigma |
| A | 13 | 254 | 10593 | 57.27 | 848 | 830 | 170.5 |
| A | 0 | 226 | 7449 | 38.82 | 848 | 830 | 170.5 |
| A | 3 | 137 | 6973 | 36.03 | 848 | 830 | 170.5 |
| B | 3 | 64 | 54501 | 340.09 | 839 | 822 | 157.8 |
| B | 0 | 190 | 21556 | 131.36 | 839 | 822 | 157.8 |
| B | 12 | 111 | 18562 | 112.39 | 839 | 822 | 157.8 |
| C | 0 | 239 | 151106 | 796.38 | 815 | 822 | 188.7 |
| C | 14 | 238 | 131926 | 694.74 | 815 | 822 | 188.7 |
| C | 0 | 10 | 47611 | 247.94 | 815 | 822 | 188.7 |
| D | 8 | 195 | 2346871 | 11936.76 | 807 | 786 | 196.5 |
| D | 13 | 174 | 1109521 | 5641.19 | 807 | 786 | 196.5 |
| D | 1 | 52 | 904141 | 4596.22 | 807 | 786 | 196.5 |
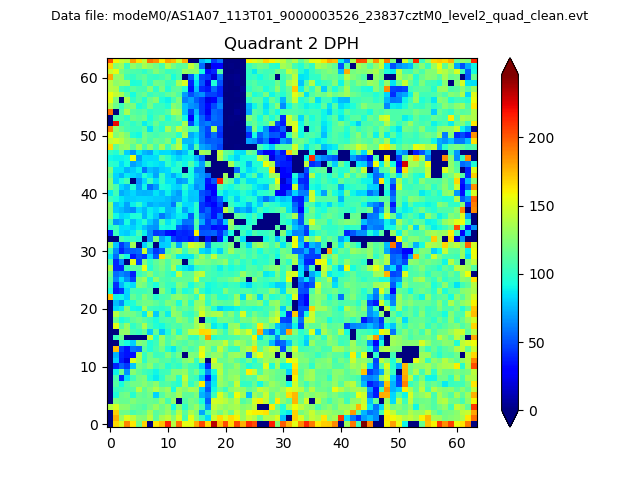
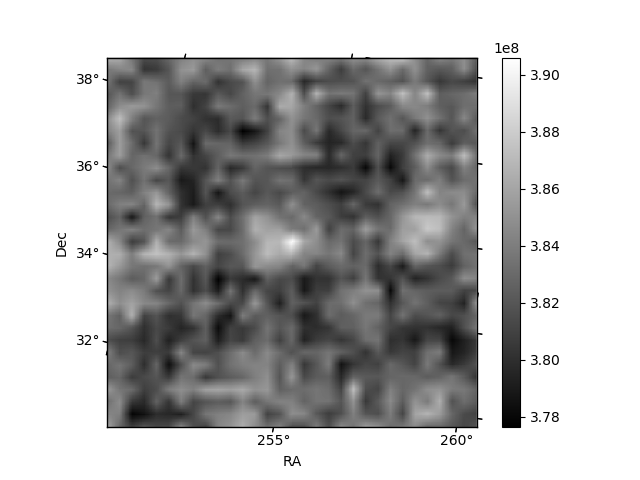
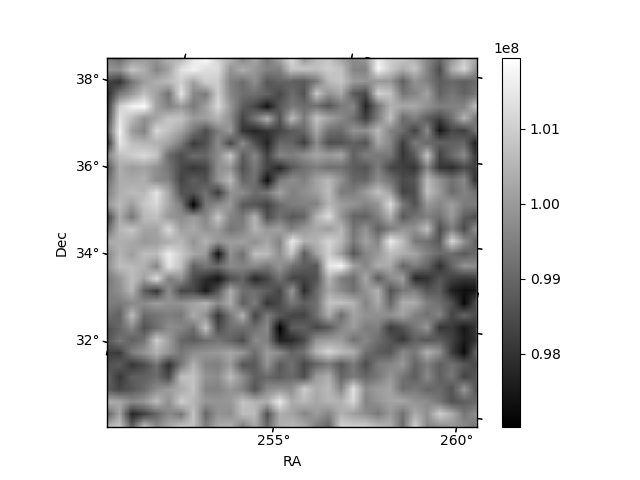
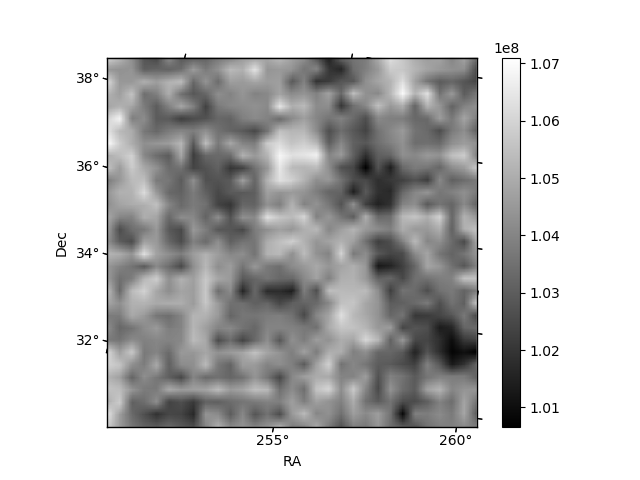
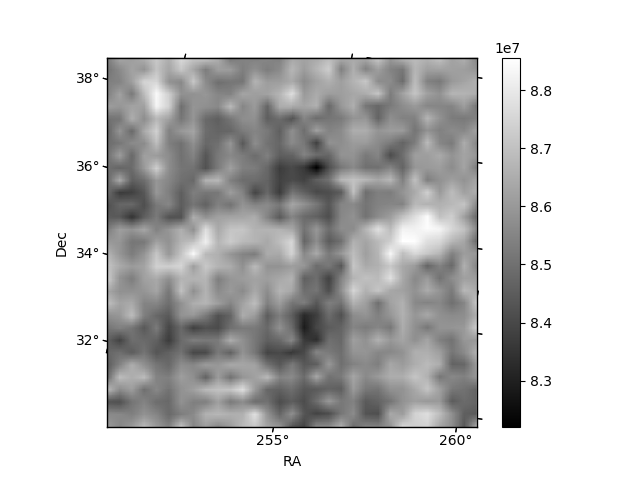
Histogram calculated using DETX and DETY for each event in the final _common_clean file
| Quadrant A | 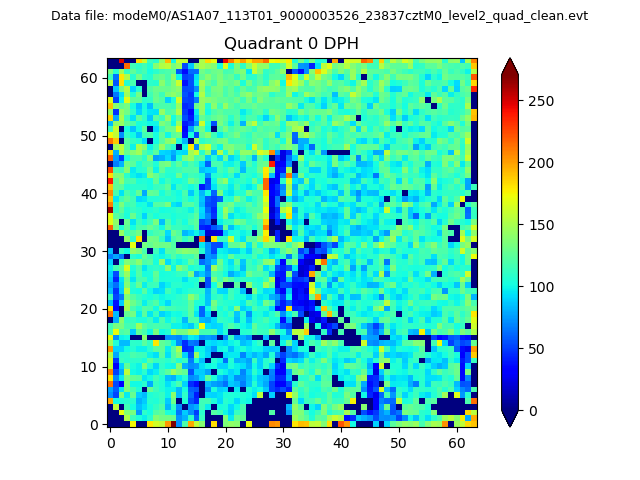 |
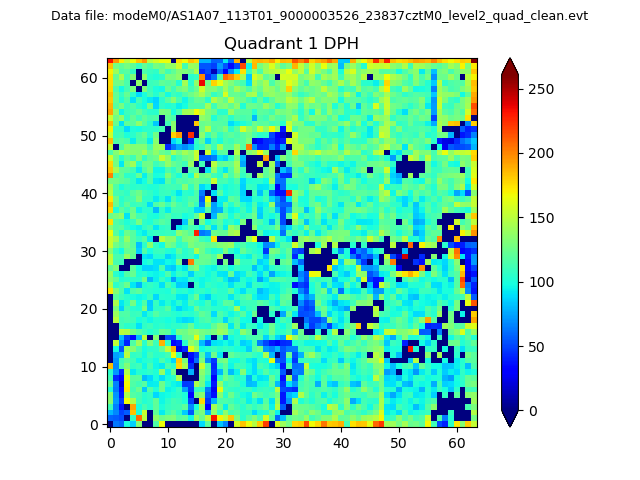 |
Quadrant B |
|---|---|---|---|
| Quadrant D | 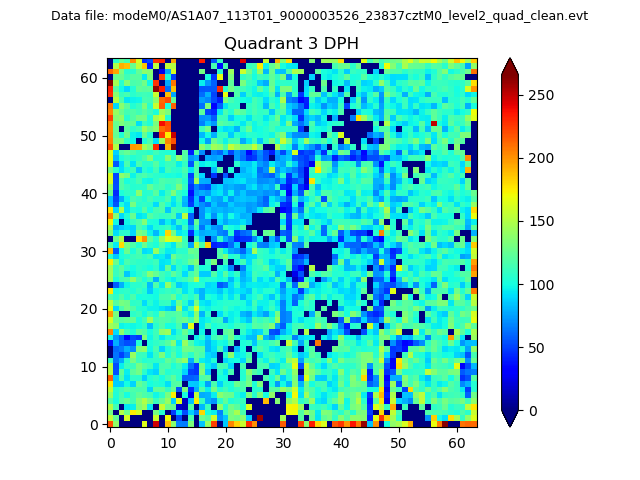 |
 |
Quadrant C |
| Plot type | Count rate plots | Images |
|---|---|---|
| Comparison with Poisson distribution Blue bars denote a histogram of data divided into 1 sec bins. Red curve is a Poisson curve with rate = median count rate of data. |
 |
 |
| Quadrant-wise count rates Data is divided into 100 sec bins |
 |
|
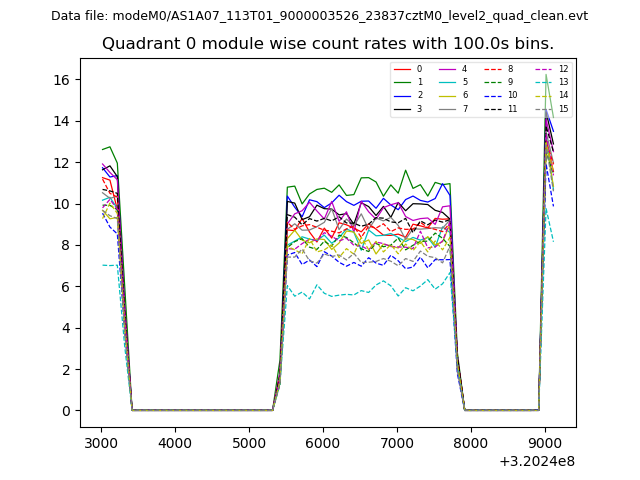
| Module-wise count rates for Quadrant A Data is divided into 100 sec bins |
 |
 |
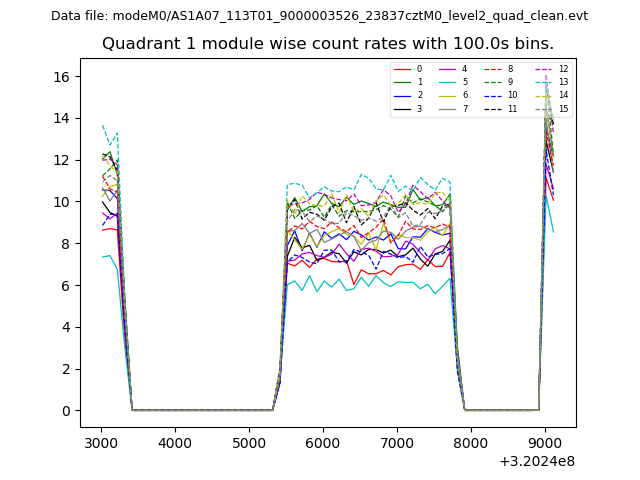
| Module-wise count rates for Quadrant B Data is divided into 100 sec bins |
 |
 |
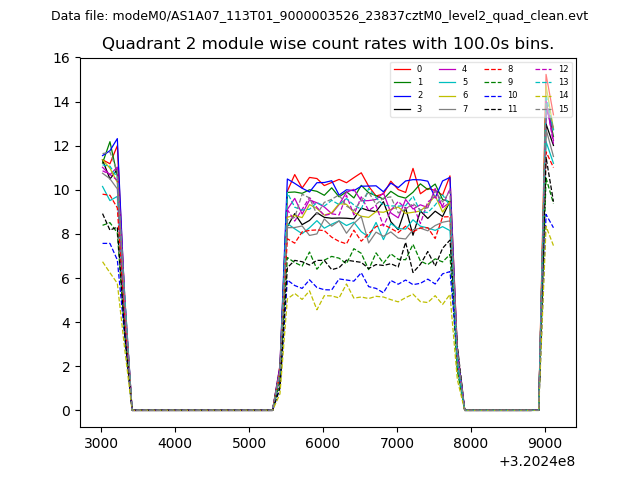
| Module-wise count rates for Quadrant C Data is divided into 100 sec bins |
 |
 |
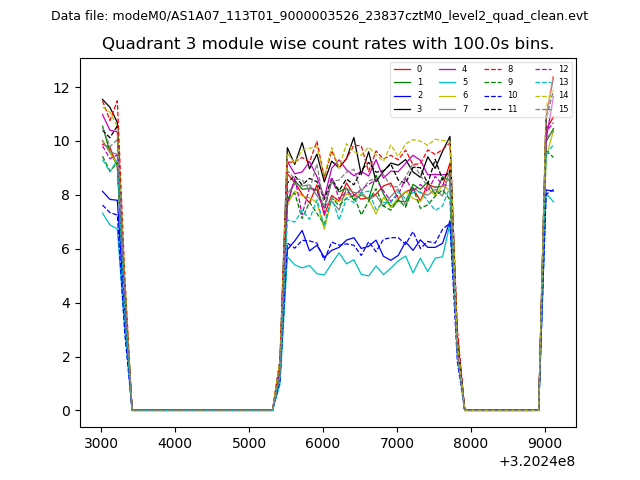
| Module-wise count rates for Quadrant D Data is divided into 100 sec bins |
 |
 |
| Parameter | Plot |
|---|---|
| CZT HV Monitor | 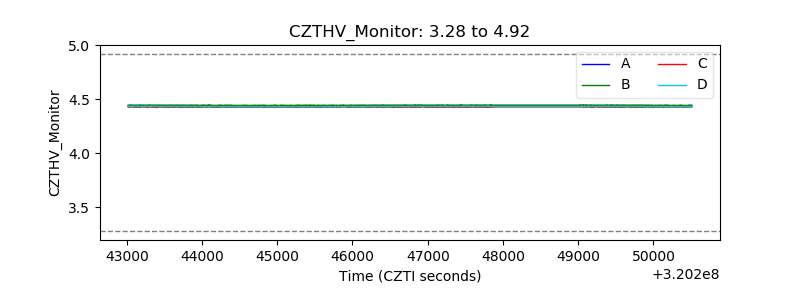 |
| D_VDD | 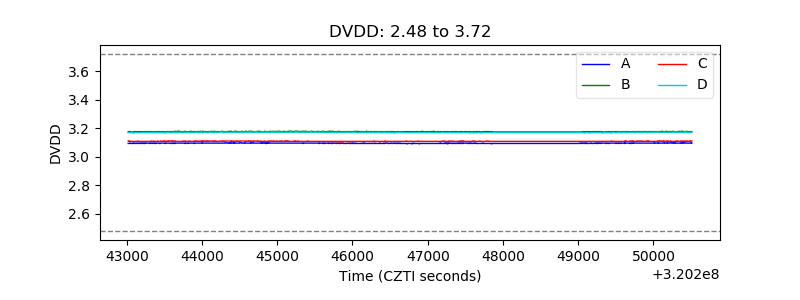 |
| Temperature 1 | 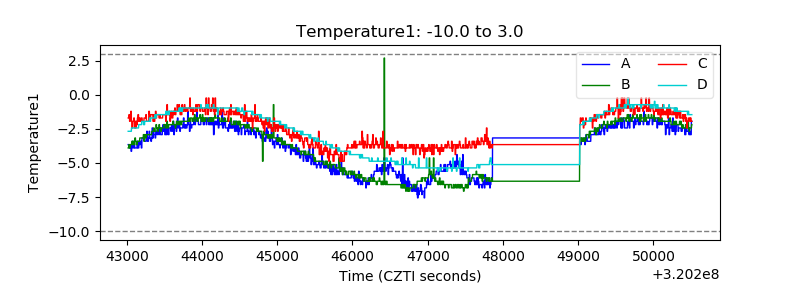 |
| Veto HV Monitor | 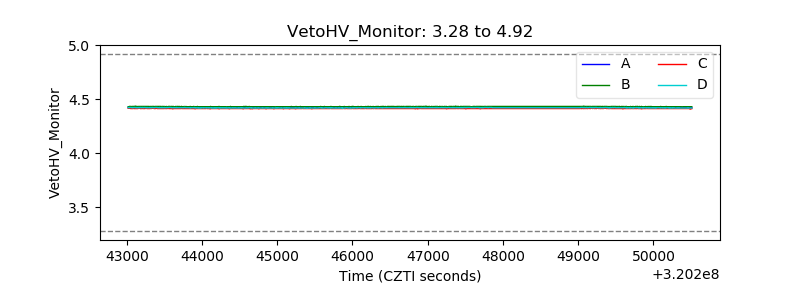 |
| Veto LLD | 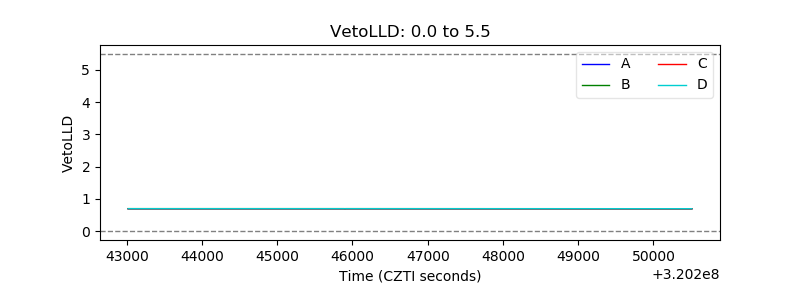 |
| Alpha Counter | 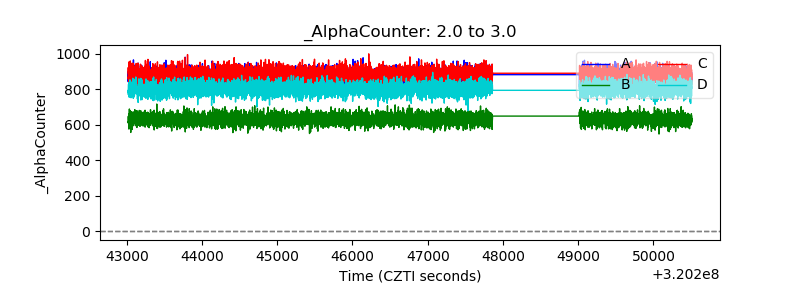 |
| _CPM_Rate |  |
| CZT Counter | 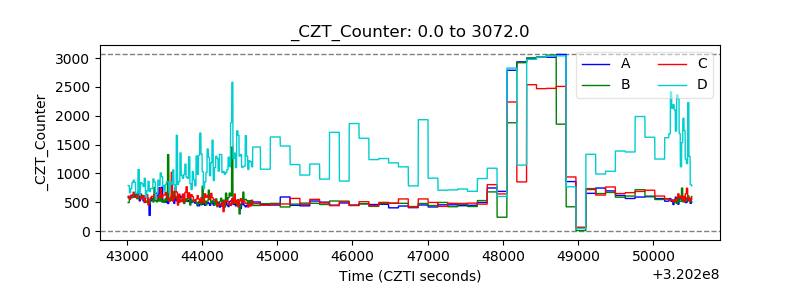 |
| +2.5 Volts monitor |  |
| +5 Volts monitor |  |
| _ROLL_ROT | 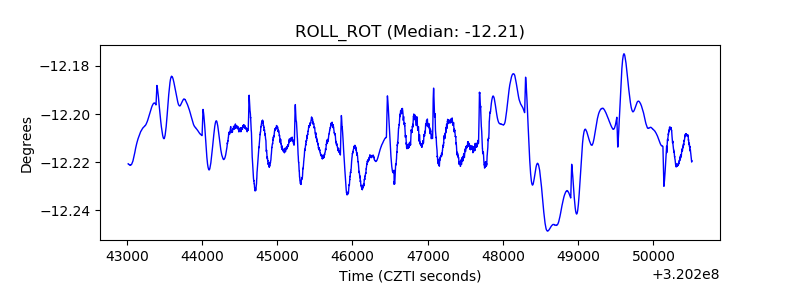 |
| _Roll_DEC | 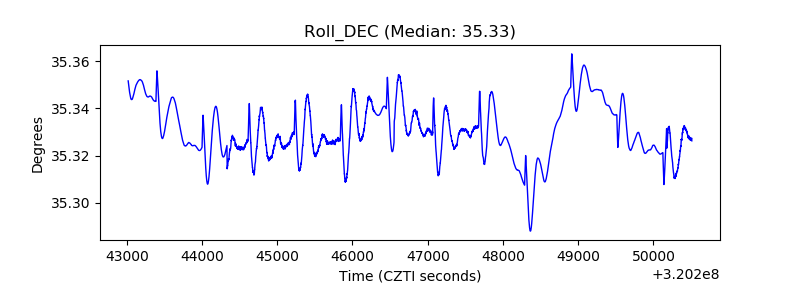 |
| _Roll_RA | 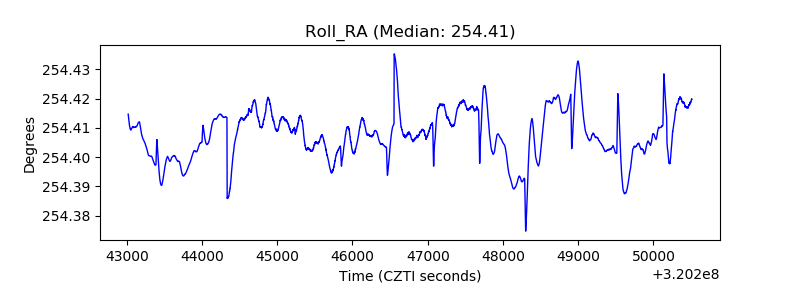 |
| Veto Counter | 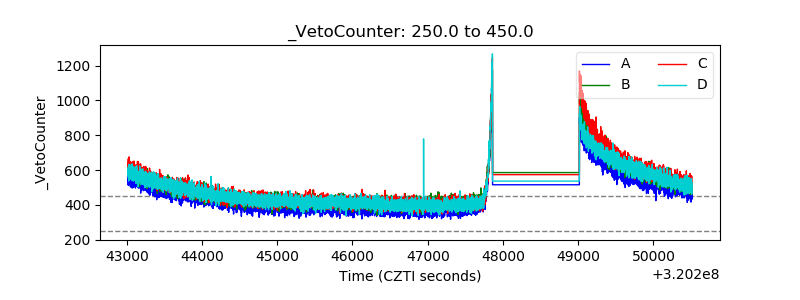 |