| Param | Original file | Final file |
|---|---|---|
| Filename | modeM0/AS1A07_027T03_9000003528cztM0_level2.fits | modeM0/AS1A07_027T03_9000003528cztM0_level2_quad_clean.evt |
| Size (bytes) | 375,347,520 | 262,290,240 |
| Size | 358.0 MB | 250.1 MB |
| Events in quadrant A | 2,369,672 | 1,424,586 |
| Events in quadrant B | 2,257,438 | 1,436,593 |
| Events in quadrant C | 2,280,740 | 1,352,341 |
| Events in quadrant D | 1,900,614 | 1,169,495 |
| Mode SS | |||
|---|---|---|---|
| Quadrant | BADHDUFLAG | Total packets | Discarded packets |
| A | 0 | 758 | 0 |
| B | 0 | 758 | 0 |
| C | 0 | 758 | 0 |
| D | 0 | 758 | 0 |
| Mode M0 | |||
|---|---|---|---|
| Quadrant | BADHDUFLAG | Total packets | Discarded packets |
| A | 0 | 77543 | 0 |
| B | 0 | 79213 | 0 |
| C | 0 | 82931 | 0 |
| D | 0 | 133987 | 0 |
| Mode M9 | |||
|---|---|---|---|
| Quadrant | BADHDUFLAG | Total packets | Discarded packets |
| A | 0 | 72 | 0 |
| B | 0 | 72 | 0 |
| C | 0 | 72 | 0 |
| D | 0 | 72 | 0 |
| Quadrant | Total seconds | Saturated seconds | Saturation percentage |
|---|---|---|---|
| A | 37254 | 256 | 0.687175% |
| B | 37254 | 486 | 1.304558% |
| C | 37254 | 864 | 2.319214% |
| D | 37254 | 2717 | 7.293177% |
Noise dominated data is calculated using 1-second bins in cleaned event files. If a bin has >2000 counts, and if more than 50% of those come from <1% of pixels, then it is considered to be noise-dominated and hence unusable.
| Quadrant | # 1 sec bins | Bins with >0 counts | Bins with >2000 counts | High rate bins dominated by noise | Noise dominated (total time) | Noise dominated (detector-on time) | Marked lightcurve |
|---|---|---|---|---|---|---|---|
| A | 44404 | 37254 | 0 | 0 | 0.00% | 0.00% |  |
| B | 44404 | 37253 | 0 | 0 | 0.00% | 0.00% |  |
| C | 44404 | 37255 | 0 | 0 | 0.00% | 0.00% |  |
| D | 44404 | 37234 | 0 | 0 | 0.00% | 0.00% |  |
Top three noisy pixels from each quadrant. If the there are fewer than three noisy pixels in the level2.evt file, extra rows are filled as -1
| Pixel properties | Quadrant properties | ||||||
|---|---|---|---|---|---|---|---|
| Quadrant | DetID | PixID | Counts | Sigma | Mean | Median | Sigma |
| A | 0 | 29 | 2221 | 10.67 | 616 | 580 | 153.8 |
| A | 7 | 110 | 1896 | 8.55 | 616 | 580 | 153.8 |
| A | 9 | 19 | 1770 | 7.73 | 616 | 580 | 153.8 |
| B | 2 | 9 | 1867 | 10.86 | 598 | 574 | 119.1 |
| B | 2 | 8 | 1548 | 8.18 | 598 | 574 | 119.1 |
| B | 3 | 17 | 1520 | 7.95 | 598 | 574 | 119.1 |
| C | 1 | 81 | 1737 | 7.62 | 601 | 564 | 154.0 |
| C | 1 | 80 | 1733 | 7.59 | 601 | 564 | 154.0 |
| C | 12 | 241 | 1569 | 6.53 | 601 | 564 | 154.0 |
| D | 3 | 14 | 1385 | 6.17 | 542 | 496 | 144.1 |
| D | 6 | 231 | 1347 | 5.9 | 542 | 496 | 144.1 |
| D | 10 | 113 | 1345 | 5.89 | 542 | 496 | 144.1 |
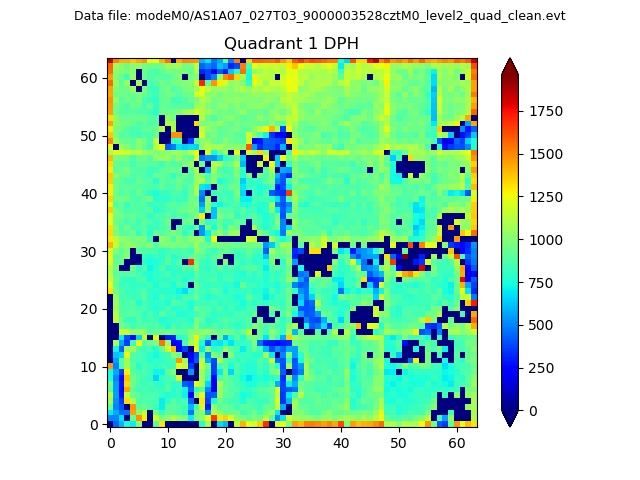
Histogram calculated using DETX and DETY for each event in the final _common_clean file
| Quadrant A |  |
 |
Quadrant B |
|---|---|---|---|
| Quadrant D |  |
 |
Quadrant C |
| Plot type | Count rate plots | Images |
|---|---|---|
| Comparison with Poisson distribution Blue bars denote a histogram of data divided into 1 sec bins. Red curve is a Poisson curve with rate = median count rate of data. |
 |
 |
| Quadrant-wise count rates Data is divided into 100 sec bins |
 |
|
| Module-wise count rates for Quadrant A Data is divided into 100 sec bins |
 |
 |
| Module-wise count rates for Quadrant B Data is divided into 100 sec bins |
 |
 |
| Module-wise count rates for Quadrant C Data is divided into 100 sec bins |
 |
 |
| Module-wise count rates for Quadrant D Data is divided into 100 sec bins |
 |
 |
| Parameter | Plot |
|---|---|
| CZT HV Monitor |  |
| D_VDD | 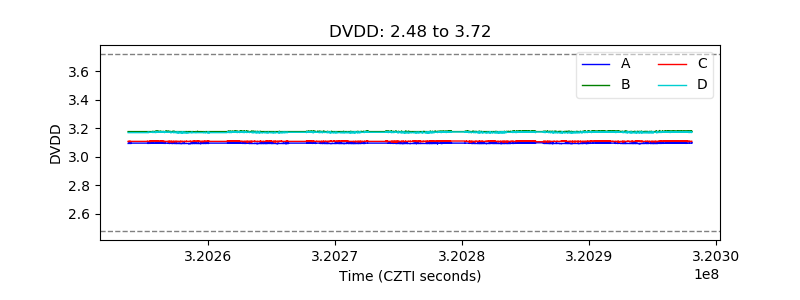 |
| Temperature 1 |  |
| Veto HV Monitor |  |
| Veto LLD |  |
| Alpha Counter |  |
| _CPM_Rate |  |
| CZT Counter |  |
| +2.5 Volts monitor |  |
| +5 Volts monitor |  |
| _ROLL_ROT |  |
| _Roll_DEC |  |
| _Roll_RA |  |
| Veto Counter |  |