| Param | Original file | Final file |
|---|---|---|
| Filename | modeM0/AS1A07_027T03_9000003528_23839cztM0_level2.evt | modeM0/AS1A07_027T03_9000003528_23839cztM0_level2_quad_clean.evt |
| Size (bytes) | 516,562,560 | 91,886,400 |
| Size | 492.6 MB | 87.6 MB |
| Events in quadrant A | 2,934,669 | 615,135 |
| Events in quadrant B | 3,057,773 | 628,662 |
| Events in quadrant C | 3,260,065 | 584,302 |
| Events in quadrant D | 6,001,645 | 551,612 |
| Mode SS | |||
|---|---|---|---|
| Quadrant | BADHDUFLAG | Total packets | Discarded packets |
| A | 0 | 116 | 0 |
| B | 0 | 116 | 0 |
| C | 0 | 116 | 0 |
| D | 0 | 116 | 0 |
| Mode M0 | |||
|---|---|---|---|
| Quadrant | BADHDUFLAG | Total packets | Discarded packets |
| A | 0 | 12222 | 1 |
| B | 0 | 12558 | 1 |
| C | 0 | 13161 | 1 |
| D | 0 | 22002 | 1 |
| Mode M9 | |||
|---|---|---|---|
| Quadrant | BADHDUFLAG | Total packets | Discarded packets |
| A | 0 | 14 | 0 |
| B | 0 | 14 | 0 |
| C | 0 | 14 | 0 |
| D | 0 | 14 | 0 |
| Quadrant | Total seconds | Saturated seconds | Saturation percentage |
|---|---|---|---|
| A | 5767 | 27 | 0.468181% |
| B | 5768 | 41 | 0.710818% |
| C | 5768 | 102 | 1.768377% |
| D | 5768 | 173 | 2.999307% |
Noise dominated data is calculated using 1-second bins in cleaned event files. If a bin has >2000 counts, and if more than 50% of those come from <1% of pixels, then it is considered to be noise-dominated and hence unusable.
| Quadrant | # 1 sec bins | Bins with >0 counts | Bins with >2000 counts | High rate bins dominated by noise | Noise dominated (total time) | Noise dominated (detector-on time) | Marked lightcurve |
|---|---|---|---|---|---|---|---|
| A | 7142 | 5768 | 0 | 0 | 0.00% | 0.00% | 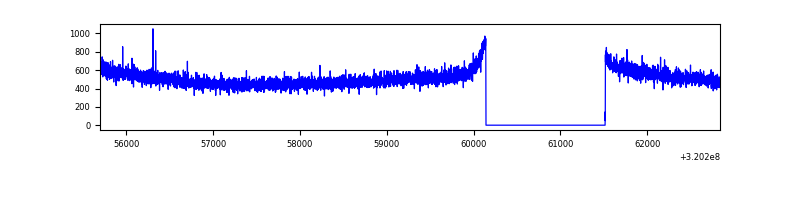 |
| B | 7143 | 5769 | 6 | 6 | 0.08% | 0.10% | 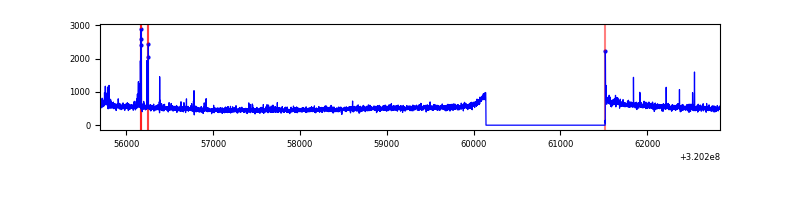 |
| C | 7143 | 5769 | 18 | 18 | 0.25% | 0.31% | 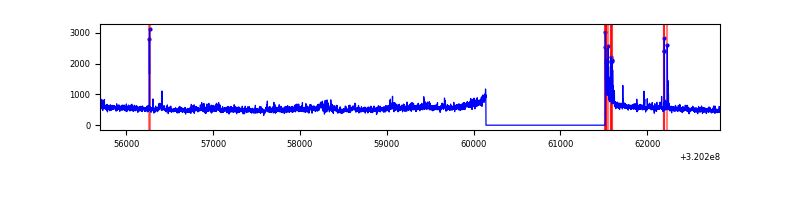 |
| D | 7143 | 5769 | 192 | 192 | 2.69% | 3.33% | 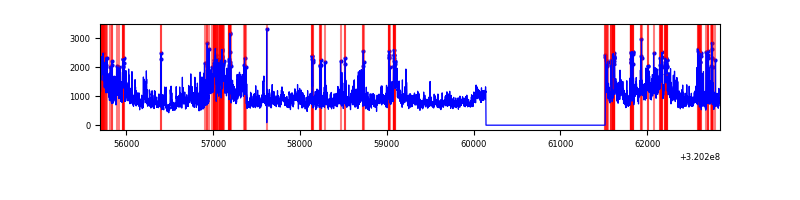 |
Top three noisy pixels from each quadrant. If the there are fewer than three noisy pixels in the level2.evt file, extra rows are filled as -1
| Pixel properties | Quadrant properties | ||||||
|---|---|---|---|---|---|---|---|
| Quadrant | DetID | PixID | Counts | Sigma | Mean | Median | Sigma |
| A | 13 | 254 | 10224 | 62.73 | 761 | 748 | 151.1 |
| A | 0 | 226 | 6723 | 39.56 | 761 | 748 | 151.1 |
| A | 3 | 137 | 6226 | 36.26 | 761 | 748 | 151.1 |
| B | 3 | 64 | 46757 | 324.8 | 760 | 745 | 141.7 |
| B | 0 | 229 | 18180 | 123.08 | 760 | 745 | 141.7 |
| B | 12 | 111 | 16016 | 107.8 | 760 | 745 | 141.7 |
| C | 0 | 239 | 206403 | 1251.18 | 715 | 721 | 164.4 |
| C | 14 | 238 | 117085 | 707.85 | 715 | 721 | 164.4 |
| C | 0 | 10 | 81336 | 490.39 | 715 | 721 | 164.4 |
| D | 8 | 195 | 1885291 | 10737.03 | 719 | 699 | 175.5 |
| D | 1 | 52 | 701810 | 3994.42 | 719 | 699 | 175.5 |
| D | 13 | 174 | 512881 | 2918.04 | 719 | 699 | 175.5 |
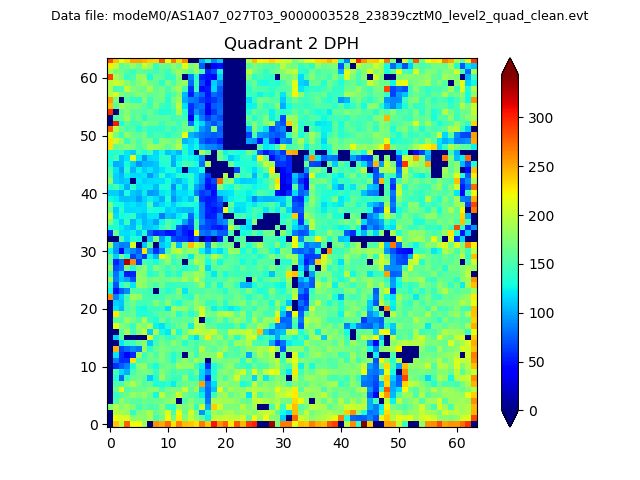
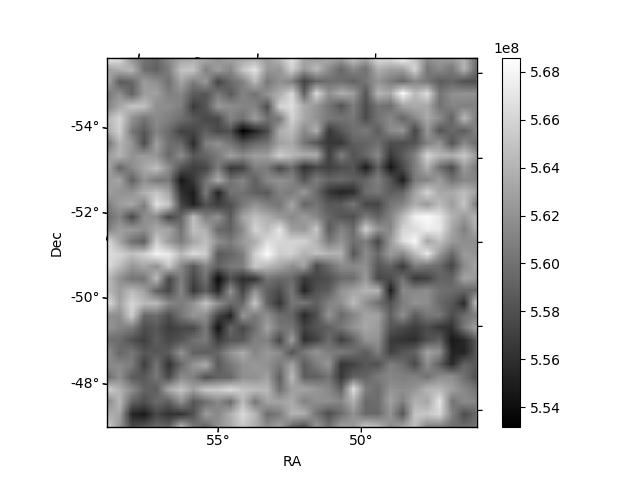
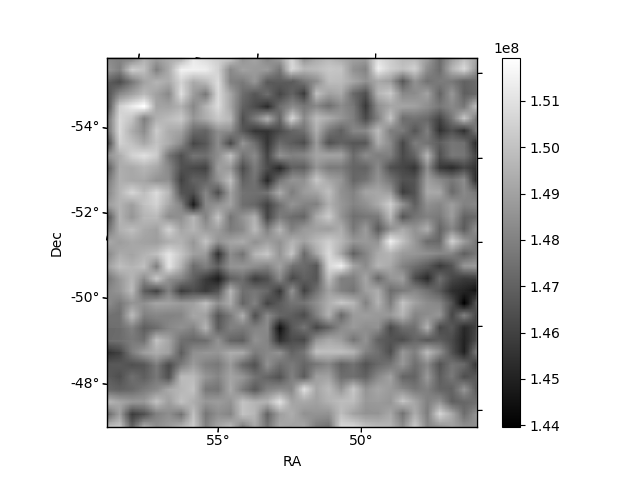
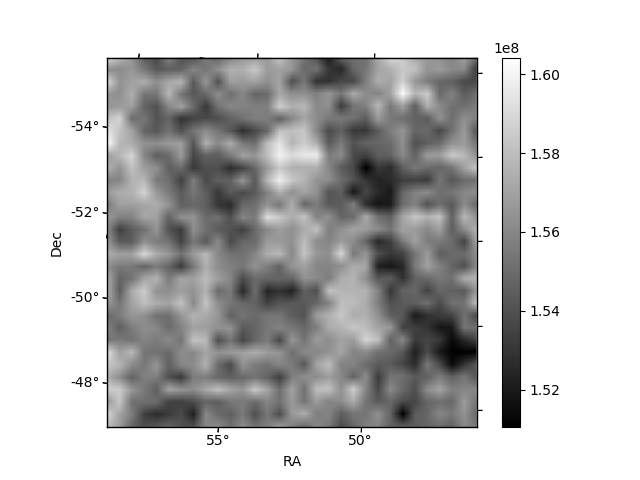
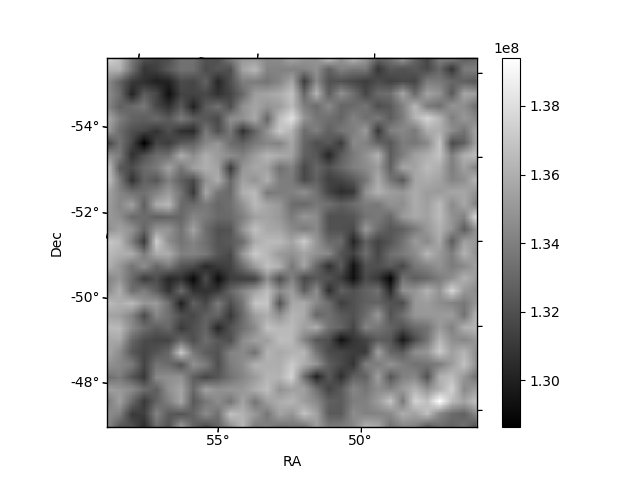
Histogram calculated using DETX and DETY for each event in the final _common_clean file
| Quadrant A | 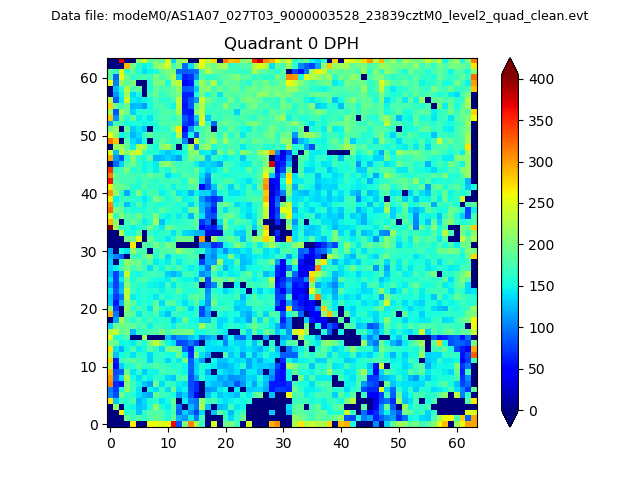 |
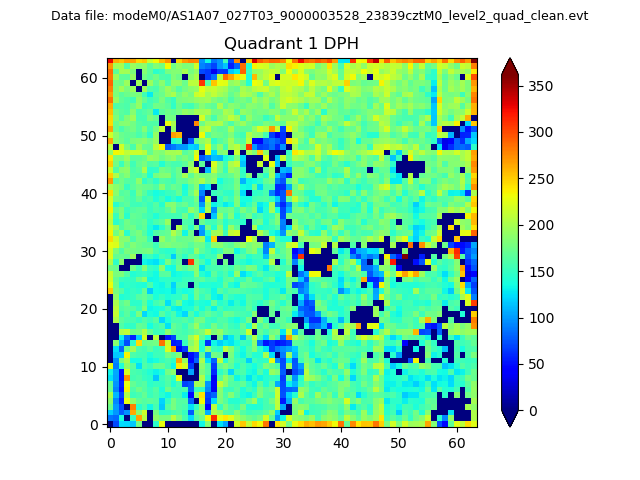 |
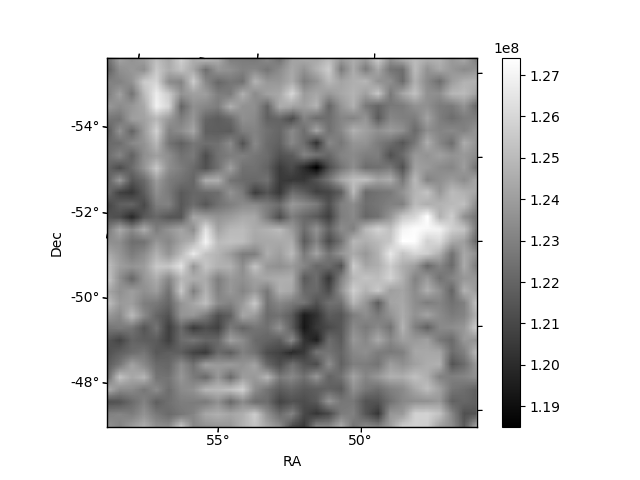
Quadrant B |
|---|---|---|---|
| Quadrant D | 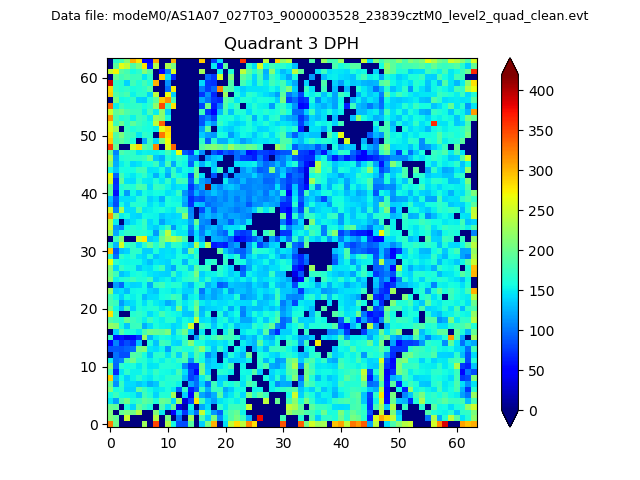 |
 |
Quadrant C |
| Plot type | Count rate plots | Images |
|---|---|---|
| Comparison with Poisson distribution Blue bars denote a histogram of data divided into 1 sec bins. Red curve is a Poisson curve with rate = median count rate of data. |
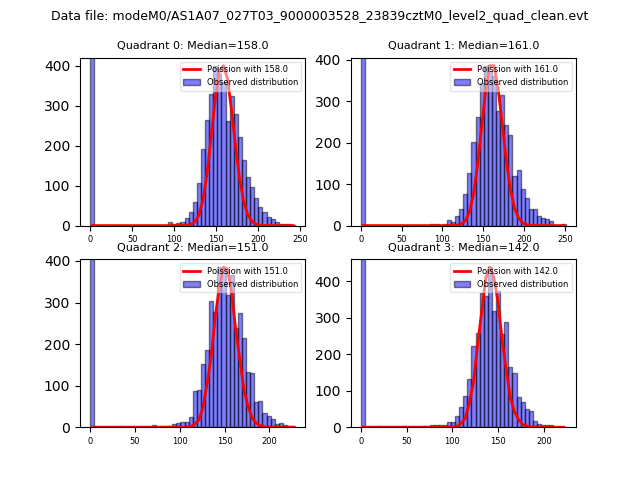 |
 |
| Quadrant-wise count rates Data is divided into 100 sec bins |
 |
|
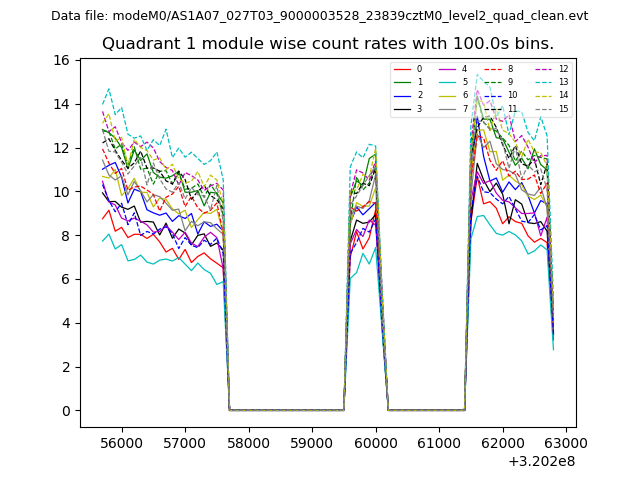
| Module-wise count rates for Quadrant A Data is divided into 100 sec bins |
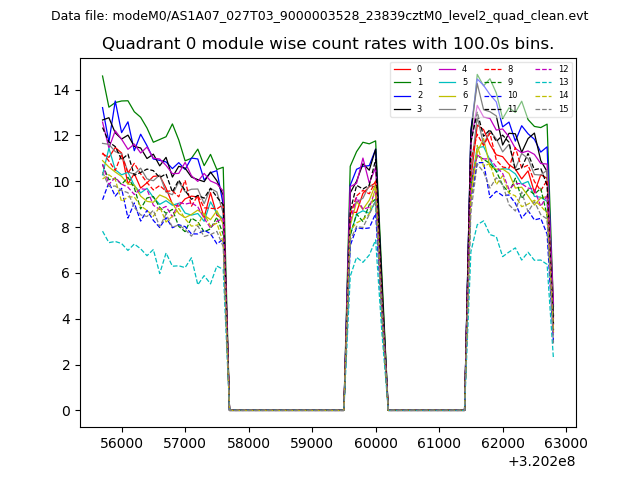 |
 |
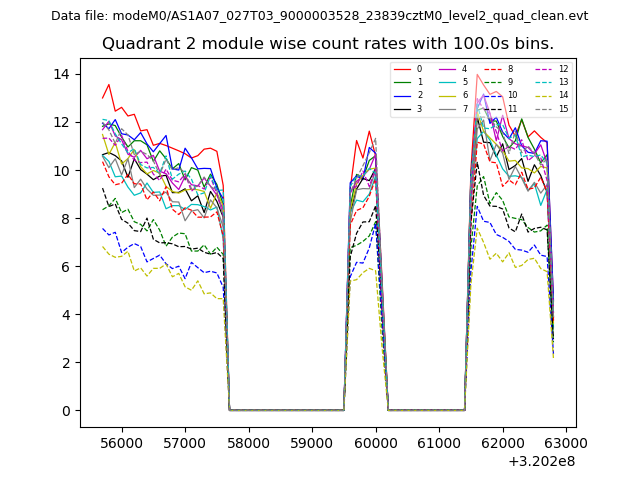
| Module-wise count rates for Quadrant B Data is divided into 100 sec bins |
 |
 |
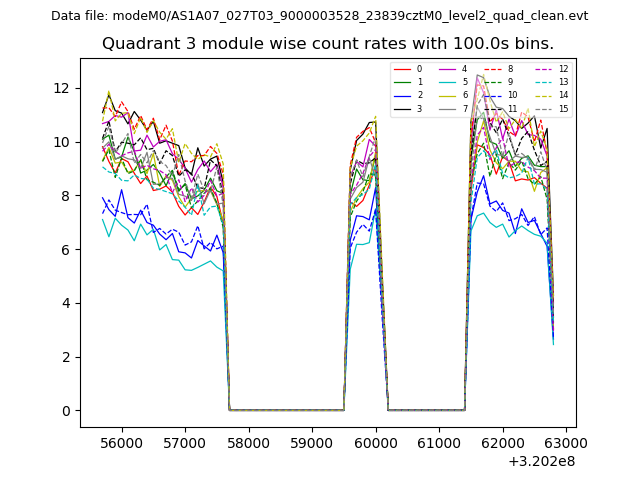
| Module-wise count rates for Quadrant C Data is divided into 100 sec bins |
 |
 |
| Module-wise count rates for Quadrant D Data is divided into 100 sec bins |
 |
 |
| Parameter | Plot |
|---|---|
| CZT HV Monitor | 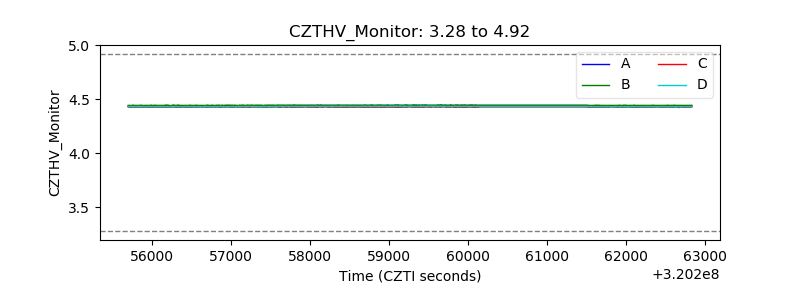 |
| D_VDD | 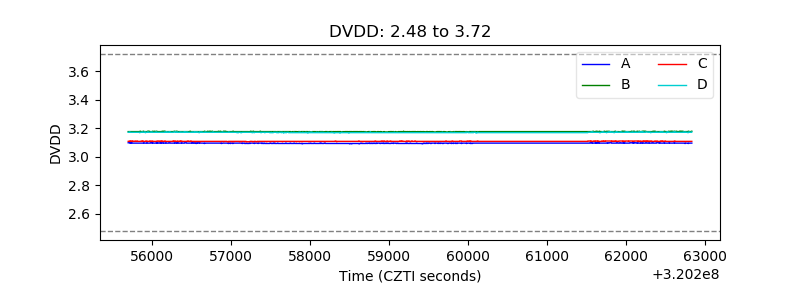 |
| Temperature 1 | 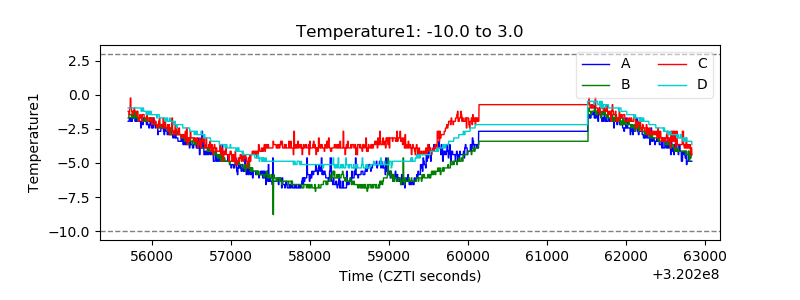 |
| Veto HV Monitor | 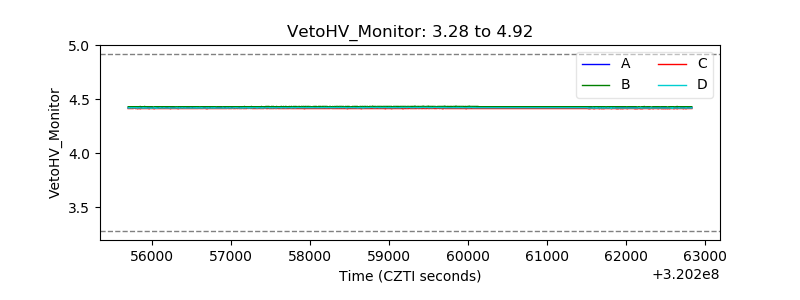 |
| Veto LLD | 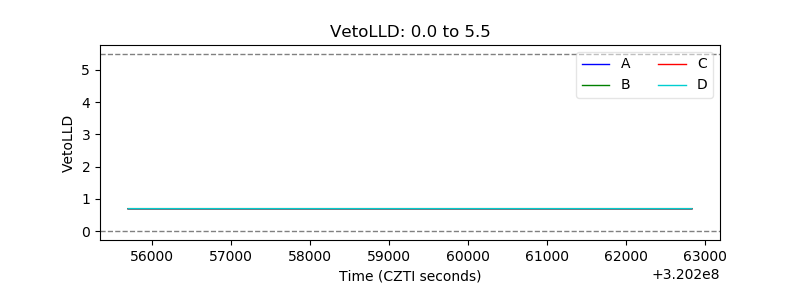 |
| Alpha Counter |  |
| _CPM_Rate |  |
| CZT Counter | 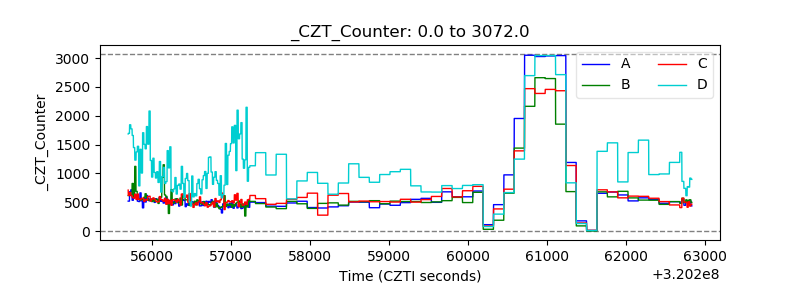 |
| +2.5 Volts monitor |  |
| +5 Volts monitor |  |
| _ROLL_ROT | 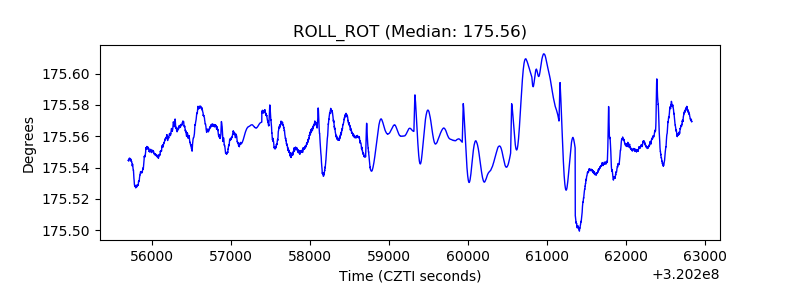 |
| _Roll_DEC | 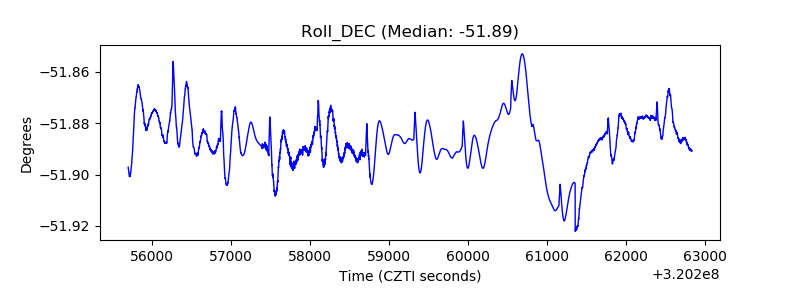 |
| _Roll_RA | 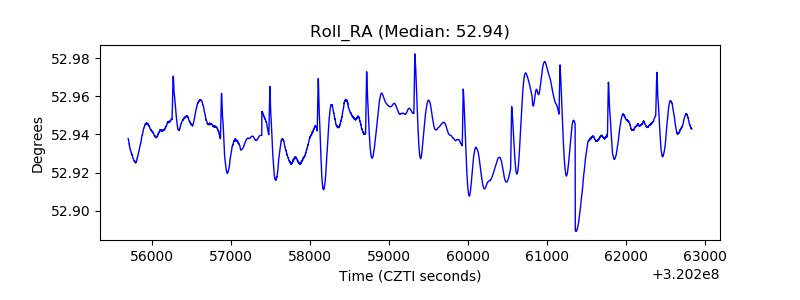 |
| Veto Counter | 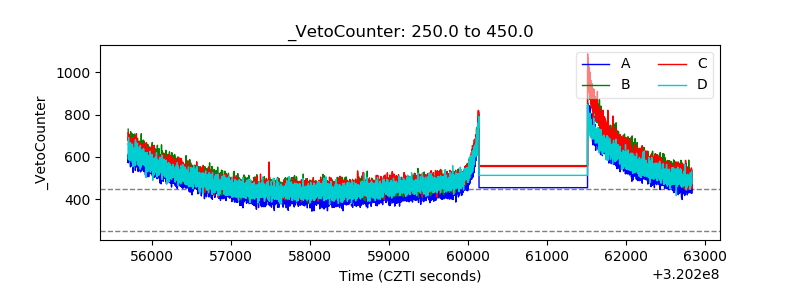 |