| Param | Original file | Final file |
|---|---|---|
| Filename | modeM0/AS1A07_027T03_9000003528_23840cztM0_level2.evt | modeM0/AS1A07_027T03_9000003528_23840cztM0_level2_quad_clean.evt |
| Size (bytes) | 532,278,720 | 91,998,720 |
| Size | 507.6 MB | 87.7 MB |
| Events in quadrant A | 2,944,196 | 614,742 |
| Events in quadrant B | 3,099,578 | 626,538 |
| Events in quadrant C | 3,132,844 | 588,989 |
| Events in quadrant D | 6,548,199 | 547,526 |
| Mode SS | |||
|---|---|---|---|
| Quadrant | BADHDUFLAG | Total packets | Discarded packets |
| A | 0 | 118 | 0 |
| B | 0 | 118 | 0 |
| C | 0 | 118 | 0 |
| D | 0 | 118 | 0 |
| Mode M0 | |||
|---|---|---|---|
| Quadrant | BADHDUFLAG | Total packets | Discarded packets |
| A | 0 | 12264 | 1 |
| B | 0 | 12655 | 1 |
| C | 0 | 12851 | 1 |
| D | 0 | 23614 | 1 |
| Mode M9 | |||
|---|---|---|---|
| Quadrant | BADHDUFLAG | Total packets | Discarded packets |
| A | 0 | 14 | 0 |
| B | 0 | 14 | 0 |
| C | 0 | 14 | 0 |
| D | 0 | 14 | 0 |
| Quadrant | Total seconds | Saturated seconds | Saturation percentage |
|---|---|---|---|
| A | 5844 | 24 | 0.410678% |
| B | 5845 | 95 | 1.625321% |
| C | 5845 | 97 | 1.659538% |
| D | 5844 | 230 | 3.935661% |
Noise dominated data is calculated using 1-second bins in cleaned event files. If a bin has >2000 counts, and if more than 50% of those come from <1% of pixels, then it is considered to be noise-dominated and hence unusable.
| Quadrant | # 1 sec bins | Bins with >0 counts | Bins with >2000 counts | High rate bins dominated by noise | Noise dominated (total time) | Noise dominated (detector-on time) | Marked lightcurve |
|---|---|---|---|---|---|---|---|
| A | 7224 | 5845 | 0 | 0 | 0.00% | 0.00% | 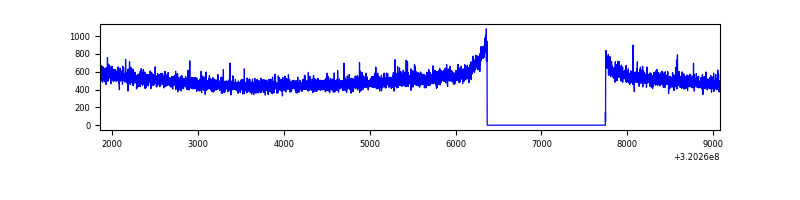 |
| B | 7225 | 5846 | 18 | 18 | 0.25% | 0.31% | 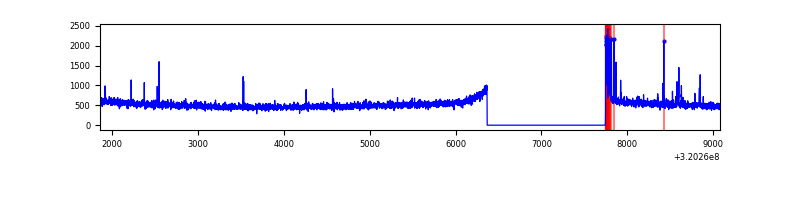 |
| C | 7225 | 5846 | 17 | 17 | 0.24% | 0.29% | 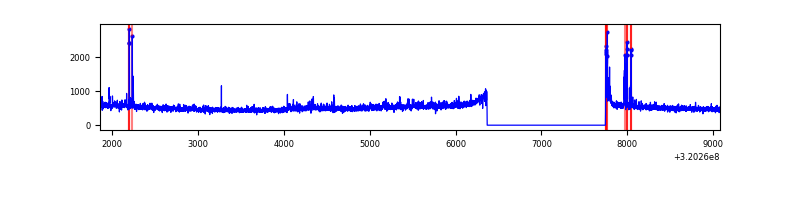 |
| D | 7224 | 5845 | 195 | 195 | 2.70% | 3.34% | 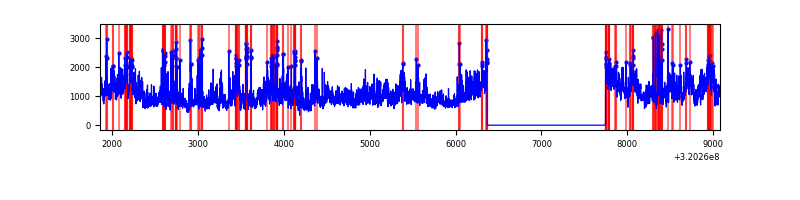 |
Top three noisy pixels from each quadrant. If the there are fewer than three noisy pixels in the level2.evt file, extra rows are filled as -1
| Pixel properties | Quadrant properties | ||||||
|---|---|---|---|---|---|---|---|
| Quadrant | DetID | PixID | Counts | Sigma | Mean | Median | Sigma |
| A | 13 | 254 | 10755 | 65.71 | 763 | 750 | 152.3 |
| A | 0 | 226 | 6600 | 38.42 | 763 | 750 | 152.3 |
| A | 3 | 137 | 6160 | 35.53 | 763 | 750 | 152.3 |
| B | 3 | 64 | 97958 | 687.8 | 759 | 742 | 141.3 |
| B | 12 | 111 | 16133 | 108.89 | 759 | 742 | 141.3 |
| B | 11 | 111 | 14216 | 95.33 | 759 | 742 | 141.3 |
| C | 14 | 238 | 117241 | 701.02 | 720 | 727 | 166.2 |
| C | 0 | 10 | 89360 | 533.27 | 720 | 727 | 166.2 |
| C | 0 | 207 | 61930 | 368.24 | 720 | 727 | 166.2 |
| D | 8 | 195 | 3025502 | 17718.1 | 714 | 694 | 170.7 |
| D | 1 | 52 | 770921 | 4511.68 | 714 | 694 | 170.7 |
| D | 12 | 235 | 25871 | 147.48 | 714 | 694 | 170.7 |
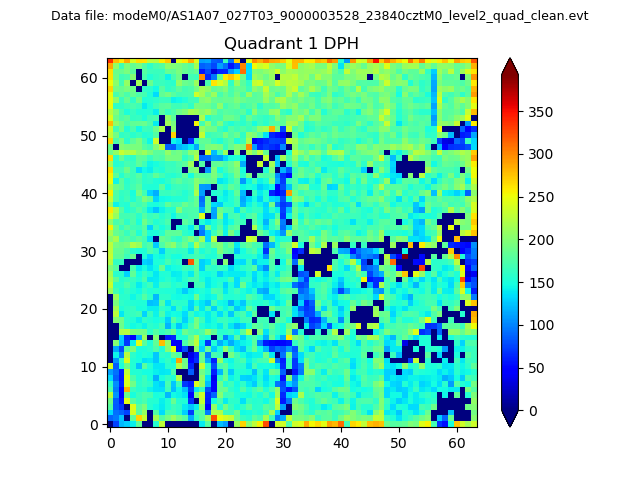
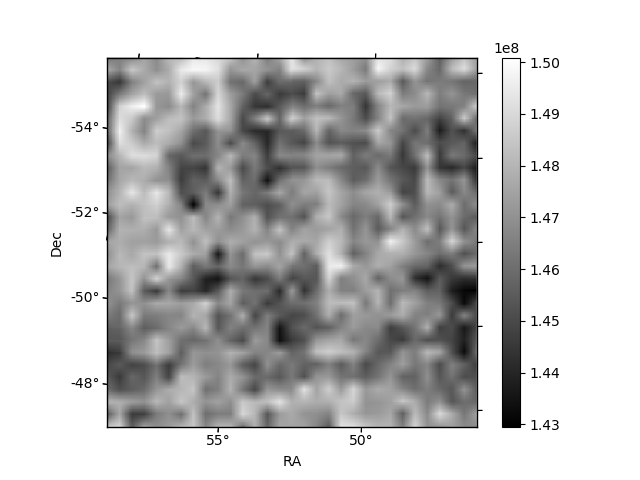
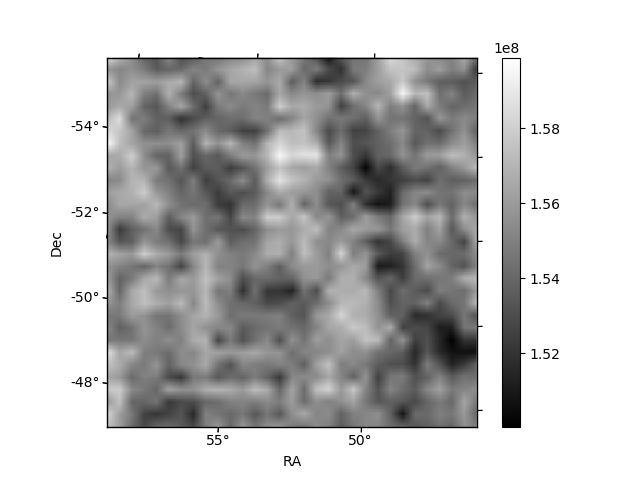
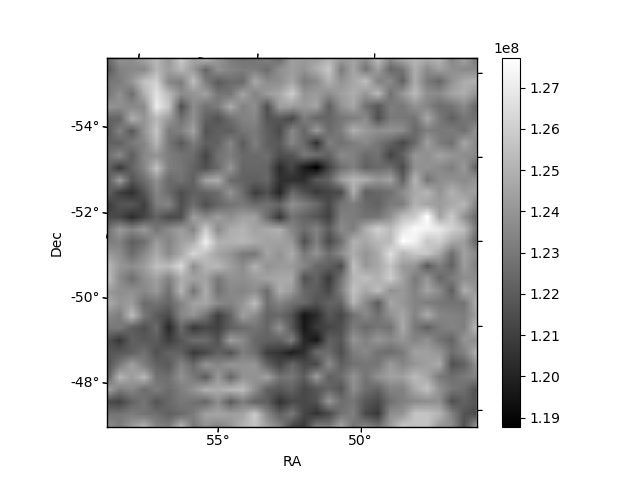
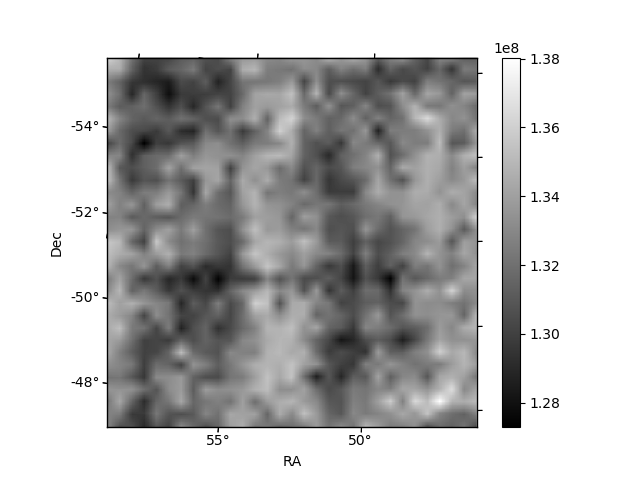
Histogram calculated using DETX and DETY for each event in the final _common_clean file
| Quadrant A |  |
 |
Quadrant B |
|---|---|---|---|
| Quadrant D | 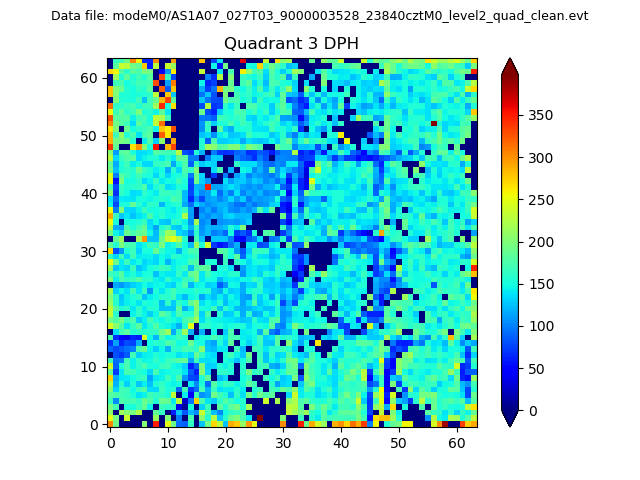 |
 |
Quadrant C |
| Plot type | Count rate plots | Images |
|---|---|---|
| Comparison with Poisson distribution Blue bars denote a histogram of data divided into 1 sec bins. Red curve is a Poisson curve with rate = median count rate of data. |
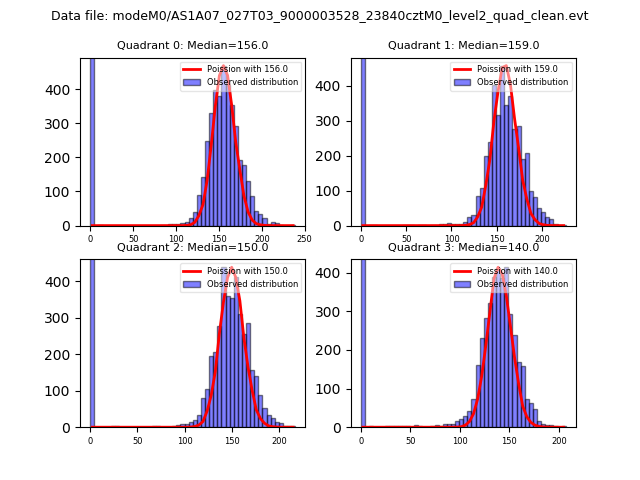 |
 |
| Quadrant-wise count rates Data is divided into 100 sec bins |
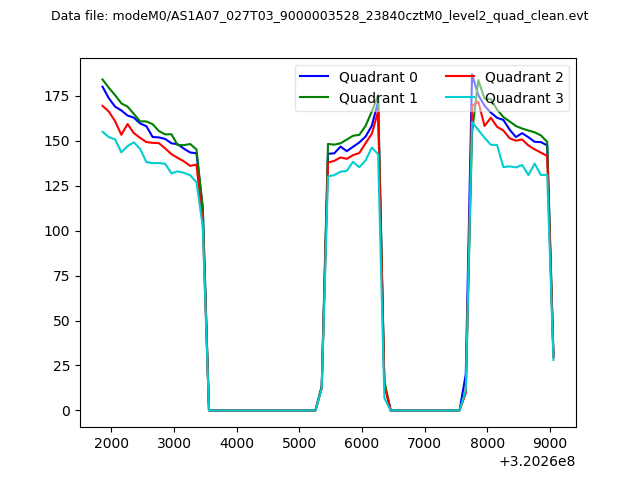 |
|
| Module-wise count rates for Quadrant A Data is divided into 100 sec bins |
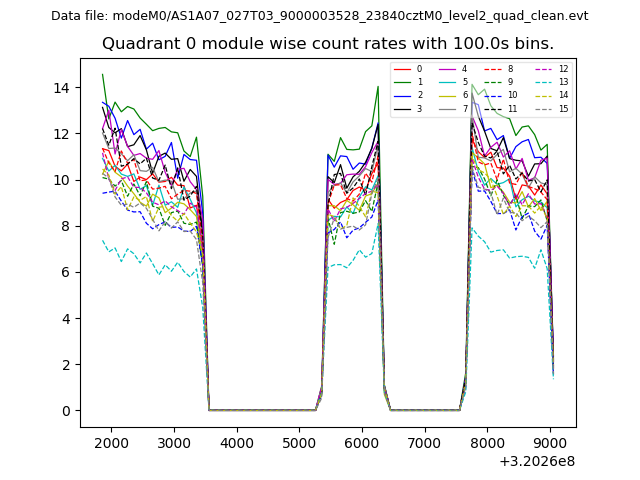 |
 |
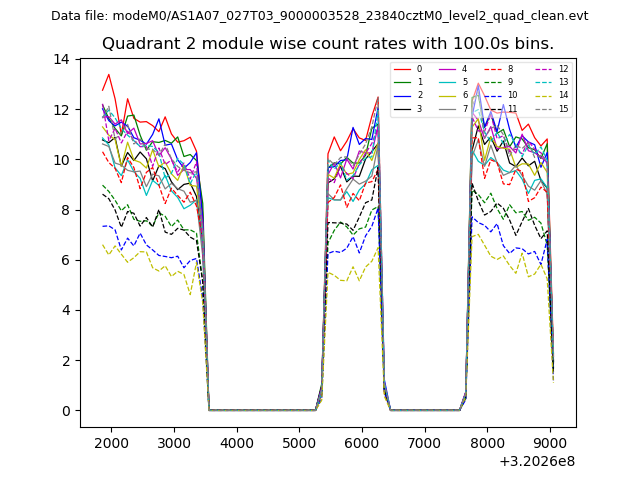
| Module-wise count rates for Quadrant B Data is divided into 100 sec bins |
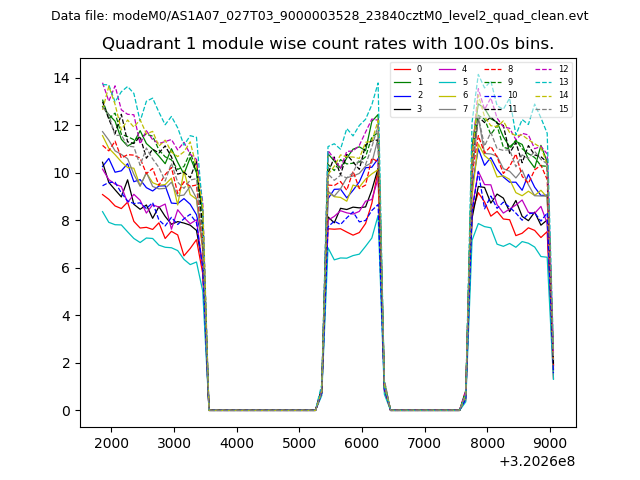 |
 |
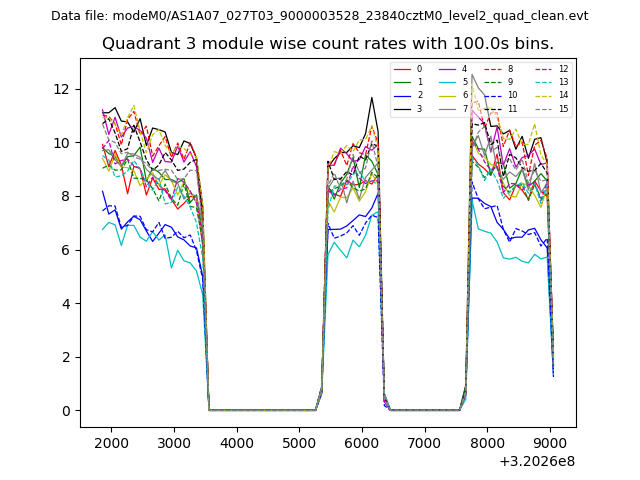
| Module-wise count rates for Quadrant C Data is divided into 100 sec bins |
 |
 |
| Module-wise count rates for Quadrant D Data is divided into 100 sec bins |
 |
 |
| Parameter | Plot |
|---|---|
| CZT HV Monitor | 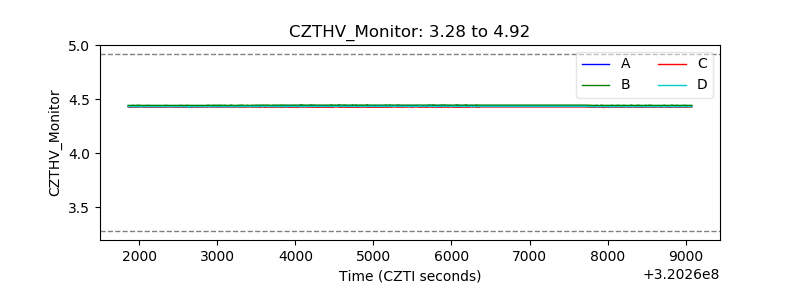 |
| D_VDD | 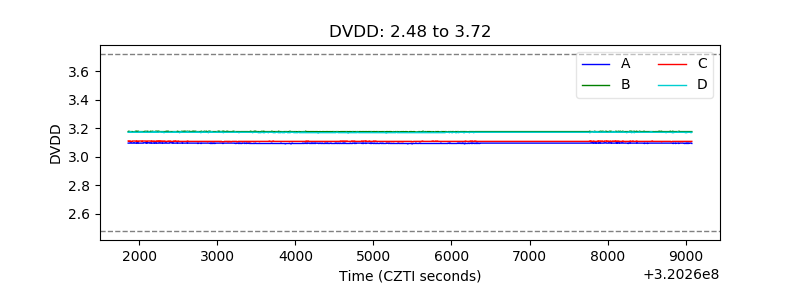 |
| Temperature 1 | 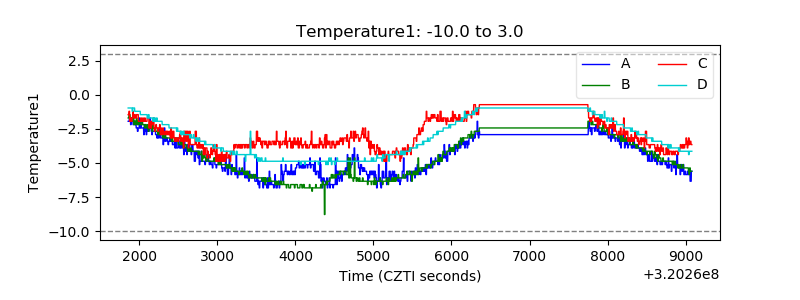 |
| Veto HV Monitor | 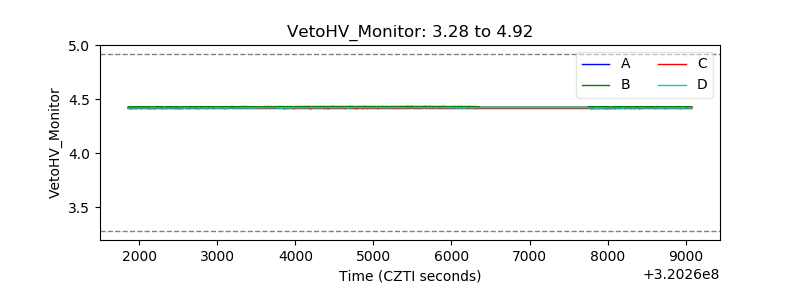 |
| Veto LLD | 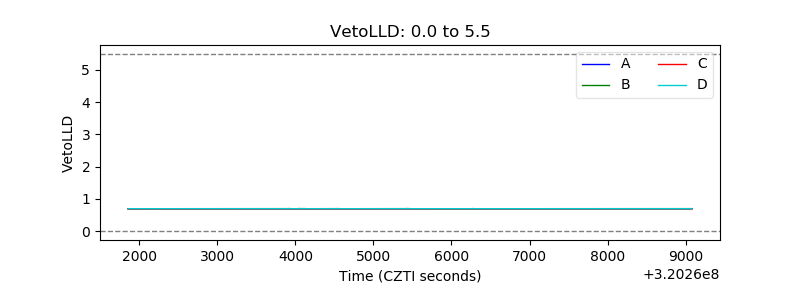 |
| Alpha Counter | 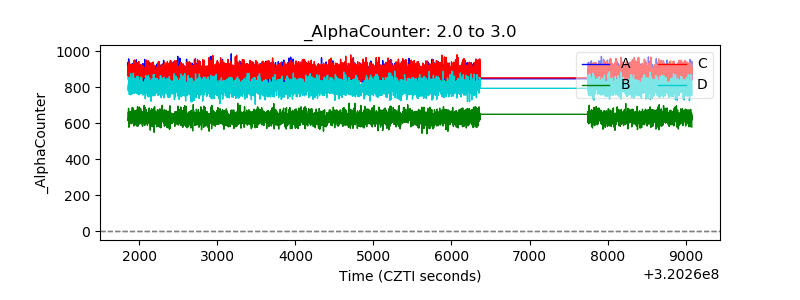 |
| _CPM_Rate | 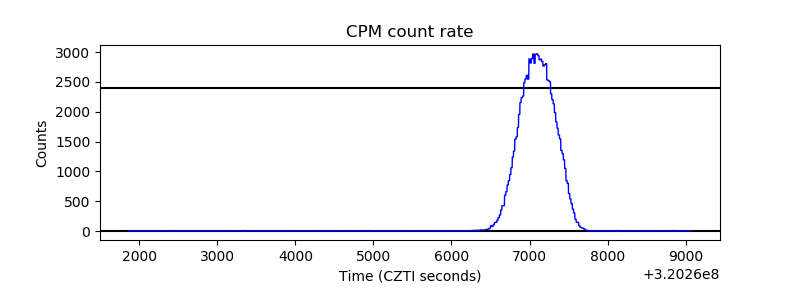 |
| CZT Counter | 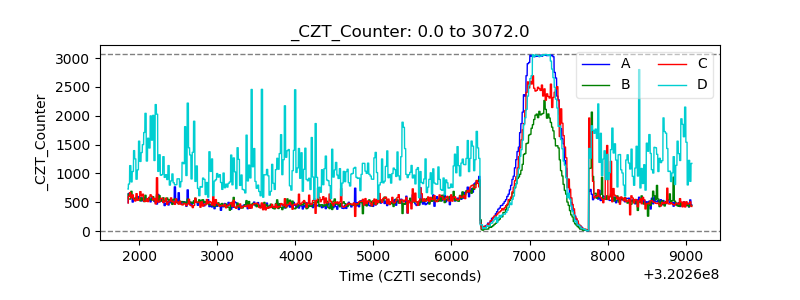 |
| +2.5 Volts monitor |  |
| +5 Volts monitor | 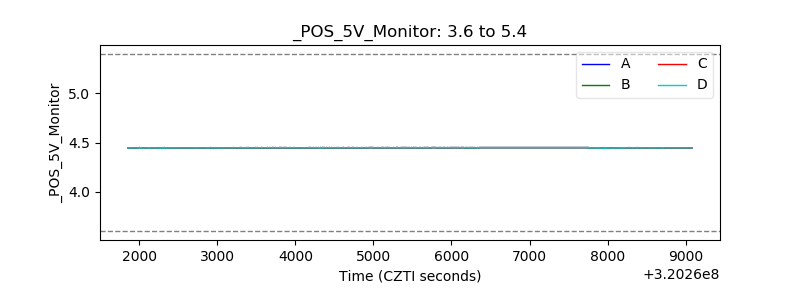 |
| _ROLL_ROT | 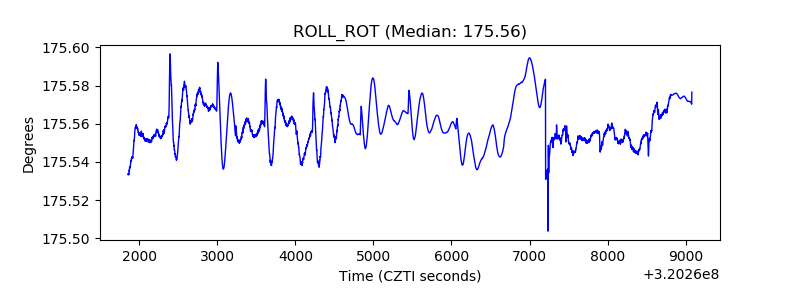 |
| _Roll_DEC | 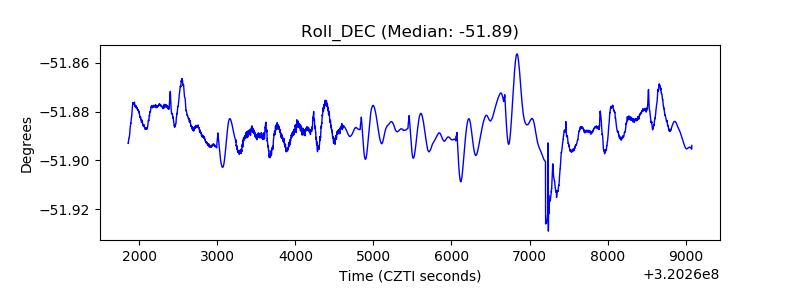 |
| _Roll_RA |  |
| Veto Counter | 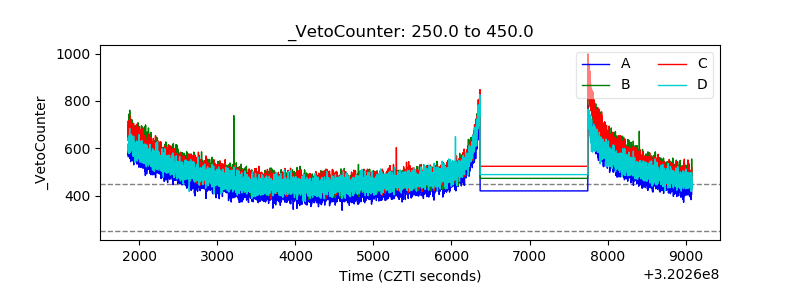 |