| Param | Original file | Final file |
|---|---|---|
| Filename | modeM0/AS1A07_027T03_9000003528_23842cztM0_level2.evt | modeM0/AS1A07_027T03_9000003528_23842cztM0_level2_quad_clean.evt |
| Size (bytes) | 572,031,360 | 88,341,120 |
| Size | 545.5 MB | 84.2 MB |
| Events in quadrant A | 3,067,557 | 580,171 |
| Events in quadrant B | 3,177,782 | 591,262 |
| Events in quadrant C | 3,680,552 | 560,284 |
| Events in quadrant D | 6,963,268 | 495,453 |
| Mode SS | |||
|---|---|---|---|
| Quadrant | BADHDUFLAG | Total packets | Discarded packets |
| A | 0 | 130 | 0 |
| B | 0 | 130 | 0 |
| C | 0 | 130 | 0 |
| D | 0 | 130 | 0 |
| Mode M0 | |||
|---|---|---|---|
| Quadrant | BADHDUFLAG | Total packets | Discarded packets |
| A | 0 | 13142 | 2 |
| B | 0 | 13421 | 2 |
| C | 0 | 14953 | 2 |
| D | 0 | 25266 | 2 |
| Mode M9 | |||
|---|---|---|---|
| Quadrant | BADHDUFLAG | Total packets | Discarded packets |
| A | 0 | 18 | 0 |
| B | 0 | 19 | 0 |
| C | 0 | 19 | 0 |
| D | 0 | 19 | 0 |
| Quadrant | Total seconds | Saturated seconds | Saturation percentage |
|---|---|---|---|
| A | 6421 | 21 | 0.327052% |
| B | 6421 | 40 | 0.622956% |
| C | 6421 | 140 | 2.180346% |
| D | 6421 | 772 | 12.023049% |
Noise dominated data is calculated using 1-second bins in cleaned event files. If a bin has >2000 counts, and if more than 50% of those come from <1% of pixels, then it is considered to be noise-dominated and hence unusable.
| Quadrant | # 1 sec bins | Bins with >0 counts | Bins with >2000 counts | High rate bins dominated by noise | Noise dominated (total time) | Noise dominated (detector-on time) | Marked lightcurve |
|---|---|---|---|---|---|---|---|
| A | 7456 | 6422 | 0 | 0 | 0.00% | 0.00% | 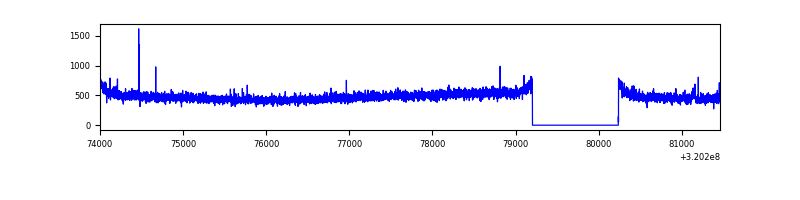 |
| B | 7456 | 6422 | 4 | 4 | 0.05% | 0.06% | 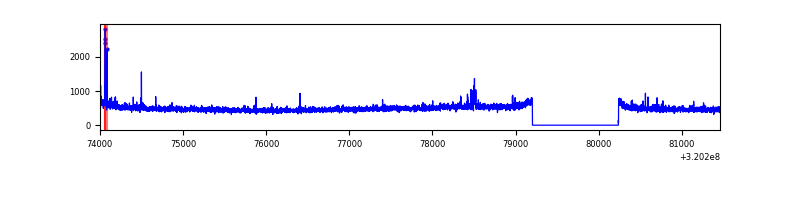 |
| C | 7456 | 6422 | 39 | 39 | 0.52% | 0.61% | 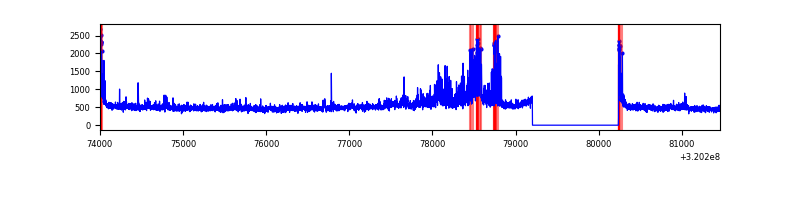 |
| D | 7456 | 6422 | 470 | 470 | 6.30% | 7.32% | 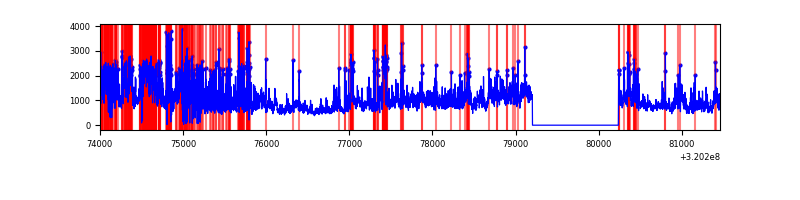 |
Top three noisy pixels from each quadrant. If the there are fewer than three noisy pixels in the level2.evt file, extra rows are filled as -1
| Pixel properties | Quadrant properties | ||||||
|---|---|---|---|---|---|---|---|
| Quadrant | DetID | PixID | Counts | Sigma | Mean | Median | Sigma |
| A | 13 | 254 | 11903 | 69.91 | 791 | 776 | 159.2 |
| A | 2 | 250 | 10426 | 60.63 | 791 | 776 | 159.2 |
| A | 3 | 137 | 6837 | 38.08 | 791 | 776 | 159.2 |
| B | 6 | 36 | 22971 | 147.99 | 792 | 773 | 150.0 |
| B | 5 | 172 | 18758 | 119.9 | 792 | 773 | 150.0 |
| B | 12 | 111 | 17667 | 112.63 | 792 | 773 | 150.0 |
| C | 0 | 10 | 560040 | 3215.44 | 753 | 757 | 173.9 |
| C | 14 | 238 | 120807 | 690.19 | 753 | 757 | 173.9 |
| C | 0 | 239 | 54744 | 310.38 | 753 | 757 | 173.9 |
| D | 8 | 195 | 2060423 | 11675.11 | 720 | 697 | 176.4 |
| D | 1 | 52 | 2041826 | 11569.7 | 720 | 697 | 176.4 |
| D | 12 | 233 | 63014 | 353.23 | 720 | 697 | 176.4 |
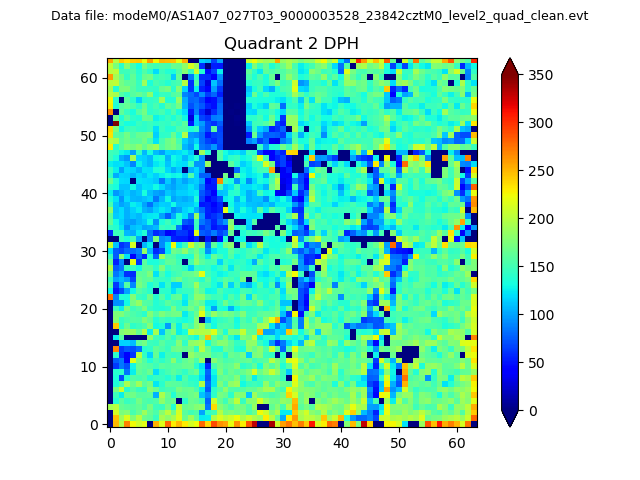
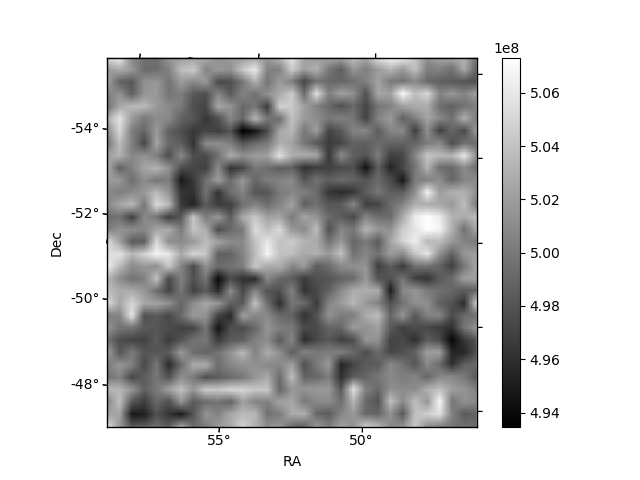
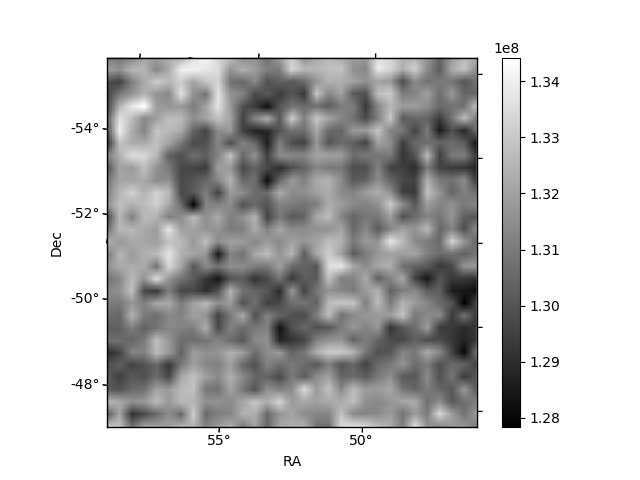
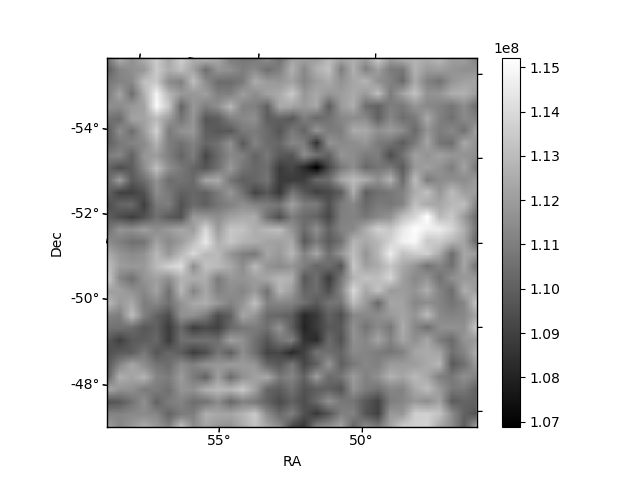
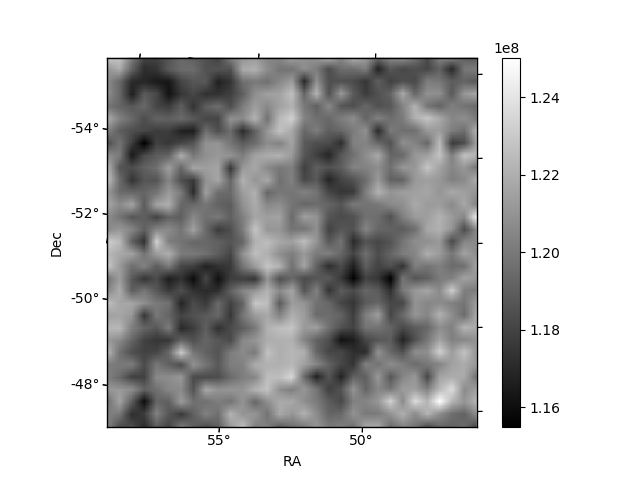
Histogram calculated using DETX and DETY for each event in the final _common_clean file
| Quadrant A | 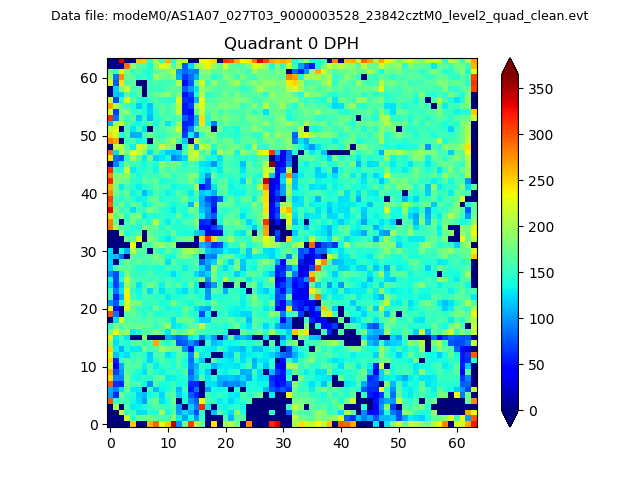 |
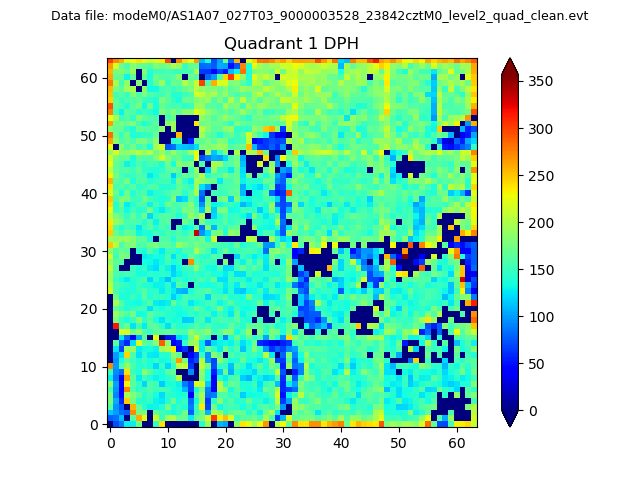 |
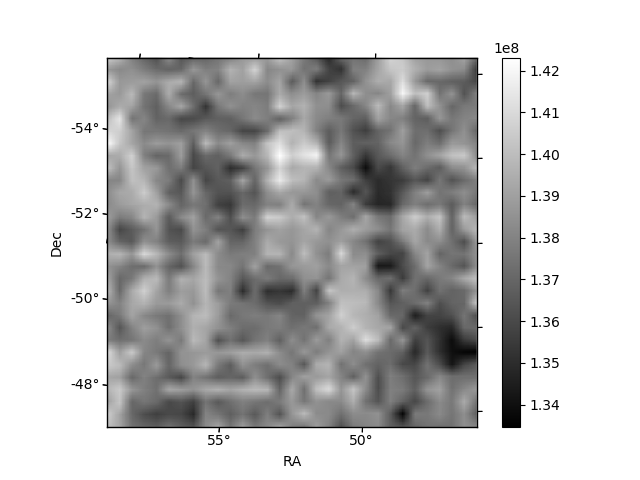
Quadrant B |
|---|---|---|---|
| Quadrant D | 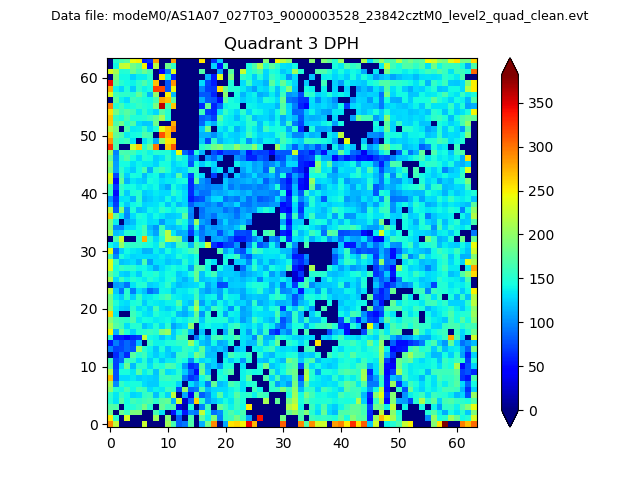 |
 |
Quadrant C |
| Plot type | Count rate plots | Images |
|---|---|---|
| Comparison with Poisson distribution Blue bars denote a histogram of data divided into 1 sec bins. Red curve is a Poisson curve with rate = median count rate of data. |
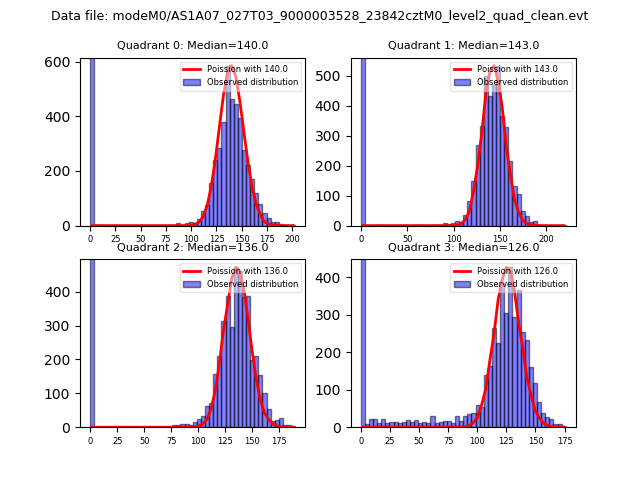 |
 |
| Quadrant-wise count rates Data is divided into 100 sec bins |
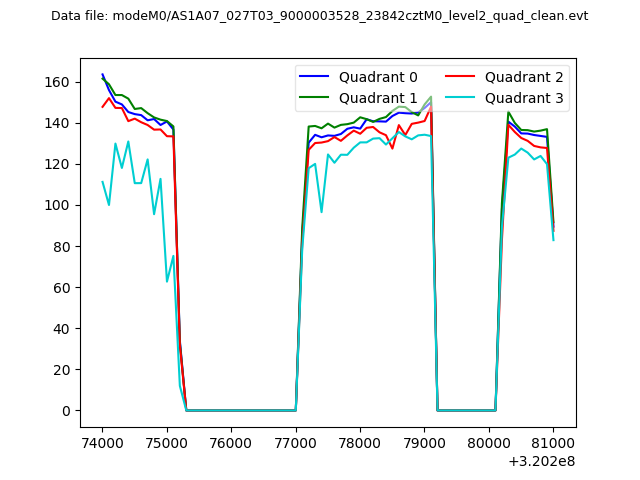 |
|
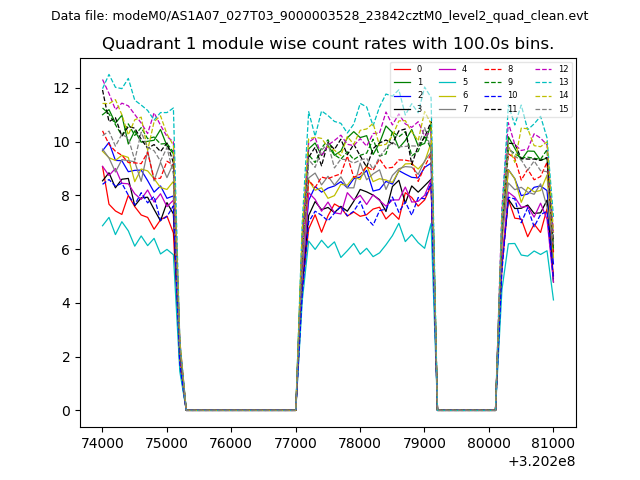
| Module-wise count rates for Quadrant A Data is divided into 100 sec bins |
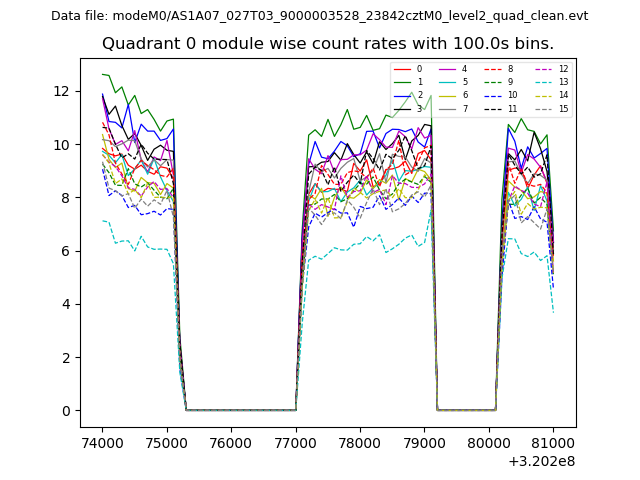 |
 |
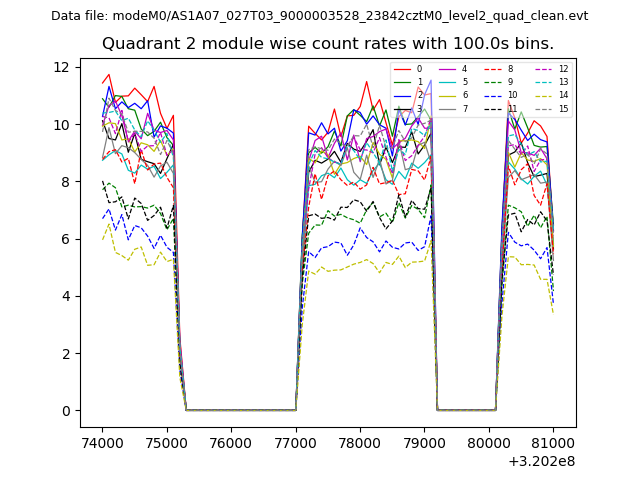
| Module-wise count rates for Quadrant B Data is divided into 100 sec bins |
 |
 |
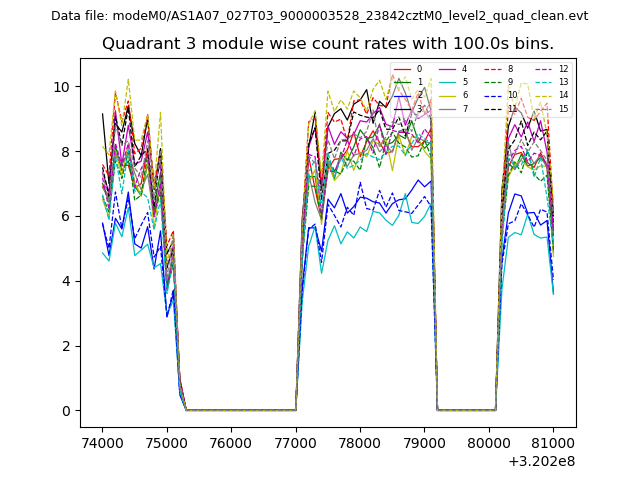
| Module-wise count rates for Quadrant C Data is divided into 100 sec bins |
 |
 |
| Module-wise count rates for Quadrant D Data is divided into 100 sec bins |
 |
 |
| Parameter | Plot |
|---|---|
| CZT HV Monitor | 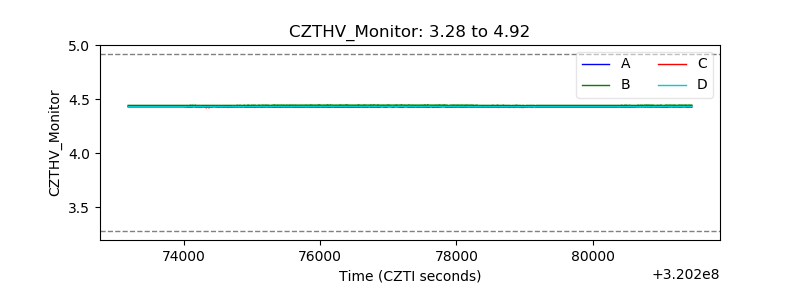 |
| D_VDD | 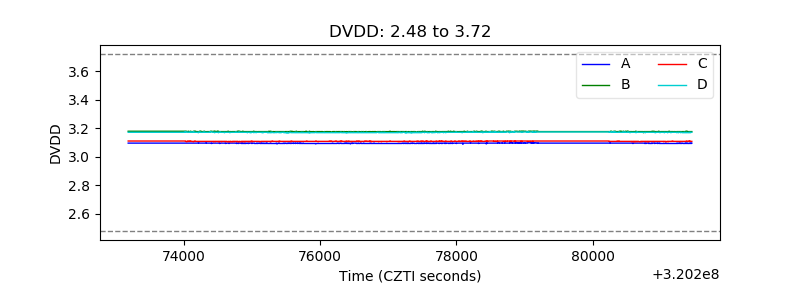 |
| Temperature 1 | 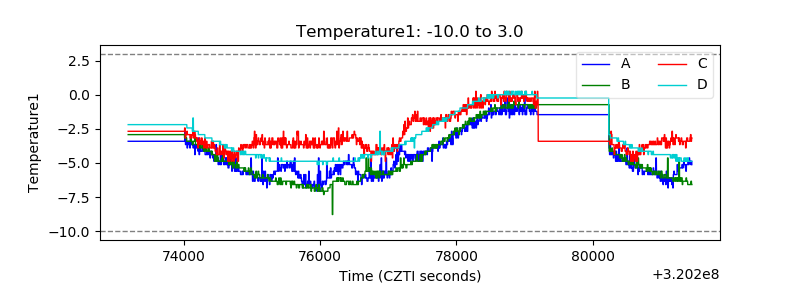 |
| Veto HV Monitor | 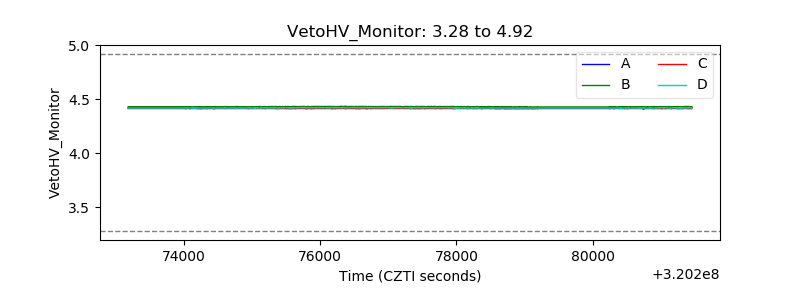 |
| Veto LLD | 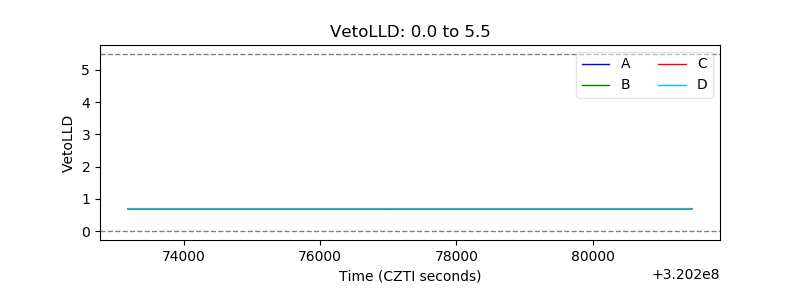 |
| Alpha Counter | 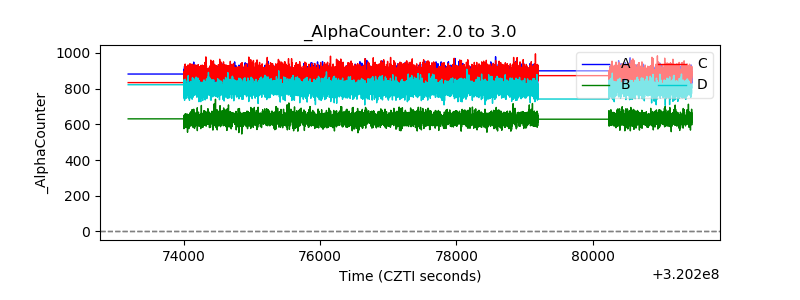 |
| _CPM_Rate | 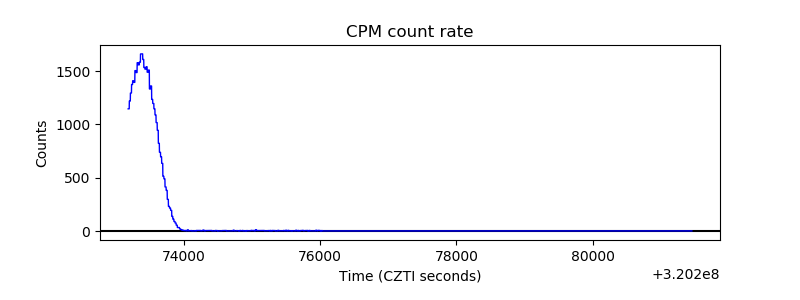 |
| CZT Counter | 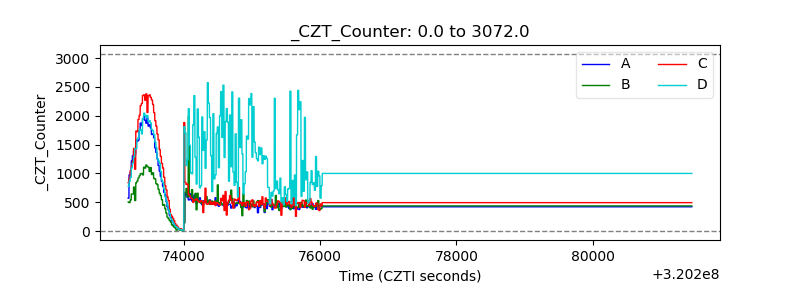 |
| +2.5 Volts monitor | 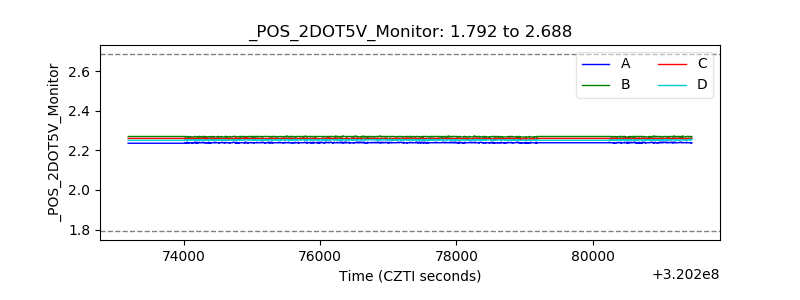 |
| +5 Volts monitor |  |
| _ROLL_ROT | 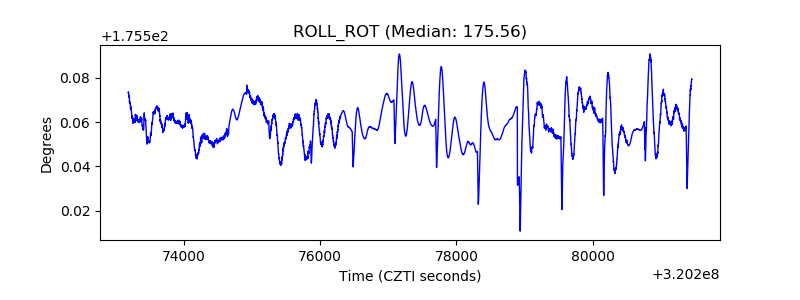 |
| _Roll_DEC | 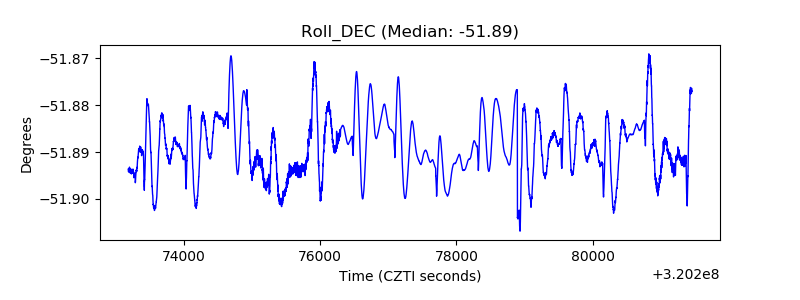 |
| _Roll_RA | 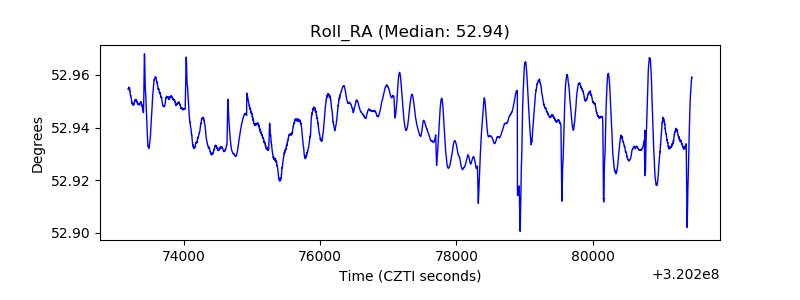 |
| Veto Counter | 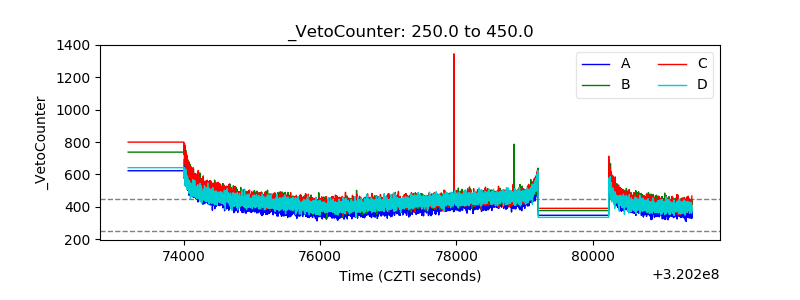 |