| Param | Original file | Final file |
|---|---|---|
| Filename | modeM0/AS1A07_027T03_9000003528_23843cztM0_level2.evt | modeM0/AS1A07_027T03_9000003528_23843cztM0_level2_quad_clean.evt |
| Size (bytes) | 632,439,360 | 91,370,880 |
| Size | 603.1 MB | 87.1 MB |
| Events in quadrant A | 3,427,813 | 582,841 |
| Events in quadrant B | 3,528,991 | 591,950 |
| Events in quadrant C | 3,721,288 | 567,179 |
| Events in quadrant D | 7,984,233 | 519,516 |
| Mode SS | |||
|---|---|---|---|
| Quadrant | BADHDUFLAG | Total packets | Discarded packets |
| A | 0 | 150 | 0 |
| B | 0 | 150 | 0 |
| C | 0 | 150 | 0 |
| D | 0 | 150 | 0 |
| Mode M0 | |||
|---|---|---|---|
| Quadrant | BADHDUFLAG | Total packets | Discarded packets |
| A | 0 | 14915 | 2 |
| B | 0 | 15088 | 2 |
| C | 0 | 15515 | 2 |
| D | 0 | 28886 | 2 |
| Mode M9 | |||
|---|---|---|---|
| Quadrant | BADHDUFLAG | Total packets | Discarded packets |
| A | 0 | 16 | 0 |
| B | 0 | 16 | 0 |
| C | 0 | 16 | 0 |
| D | 0 | 16 | 0 |
| Quadrant | Total seconds | Saturated seconds | Saturation percentage |
|---|---|---|---|
| A | 7253 | 55 | 0.758307% |
| B | 7254 | 97 | 1.337193% |
| C | 7254 | 145 | 1.998897% |
| D | 7254 | 680 | 9.374138% |
Noise dominated data is calculated using 1-second bins in cleaned event files. If a bin has >2000 counts, and if more than 50% of those come from <1% of pixels, then it is considered to be noise-dominated and hence unusable.
| Quadrant | # 1 sec bins | Bins with >0 counts | Bins with >2000 counts | High rate bins dominated by noise | Noise dominated (total time) | Noise dominated (detector-on time) | Marked lightcurve |
|---|---|---|---|---|---|---|---|
| A | 8868 | 7255 | 0 | 0 | 0.00% | 0.00% | 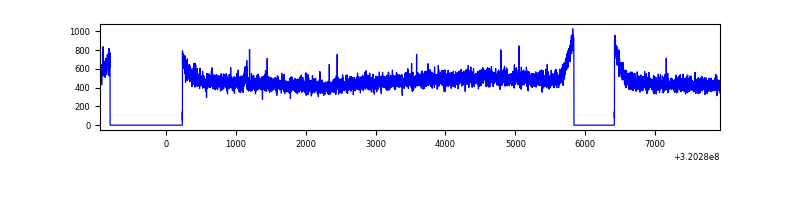 |
| B | 8869 | 7256 | 1 | 1 | 0.01% | 0.01% | 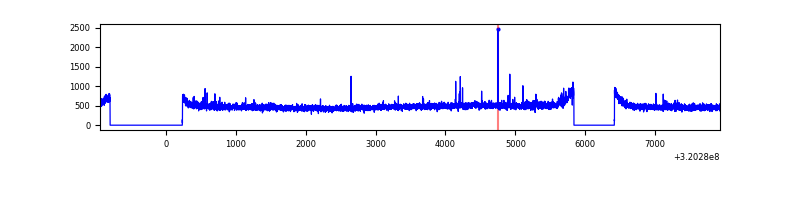 |
| C | 8869 | 7256 | 19 | 19 | 0.21% | 0.26% | 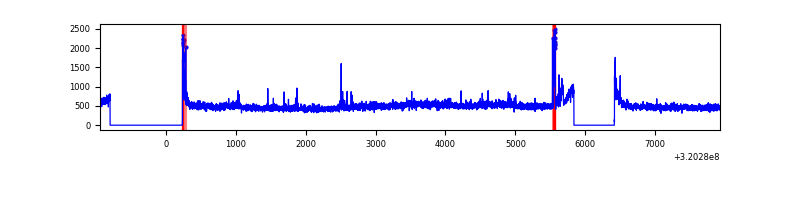 |
| D | 8869 | 7256 | 509 | 509 | 5.74% | 7.01% | 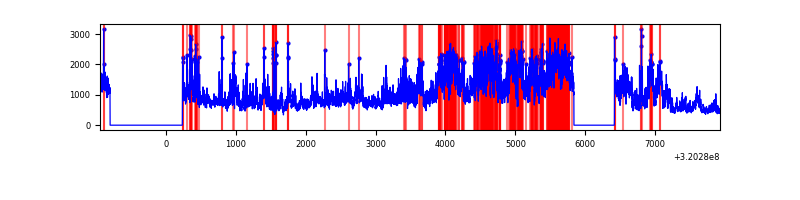 |
Top three noisy pixels from each quadrant. If the there are fewer than three noisy pixels in the level2.evt file, extra rows are filled as -1
| Pixel properties | Quadrant properties | ||||||
|---|---|---|---|---|---|---|---|
| Quadrant | DetID | PixID | Counts | Sigma | Mean | Median | Sigma |
| A | 13 | 254 | 12751 | 66.68 | 884 | 864 | 178.3 |
| A | 2 | 250 | 10969 | 56.69 | 884 | 864 | 178.3 |
| A | 13 | 252 | 7883 | 39.38 | 884 | 864 | 178.3 |
| B | 12 | 111 | 20311 | 116.77 | 885 | 862 | 166.6 |
| B | 11 | 111 | 17595 | 100.47 | 885 | 862 | 166.6 |
| B | 14 | 111 | 15264 | 86.47 | 885 | 862 | 166.6 |
| C | 14 | 238 | 134362 | 675.48 | 845 | 848 | 197.7 |
| C | 0 | 10 | 112308 | 563.9 | 845 | 848 | 197.7 |
| C | 0 | 239 | 84693 | 424.19 | 845 | 848 | 197.7 |
| D | 8 | 195 | 3381571 | 16723.06 | 833 | 807 | 202.2 |
| D | 1 | 52 | 1297444 | 6413.86 | 833 | 807 | 202.2 |
| D | 12 | 233 | 36008 | 174.12 | 833 | 807 | 202.2 |
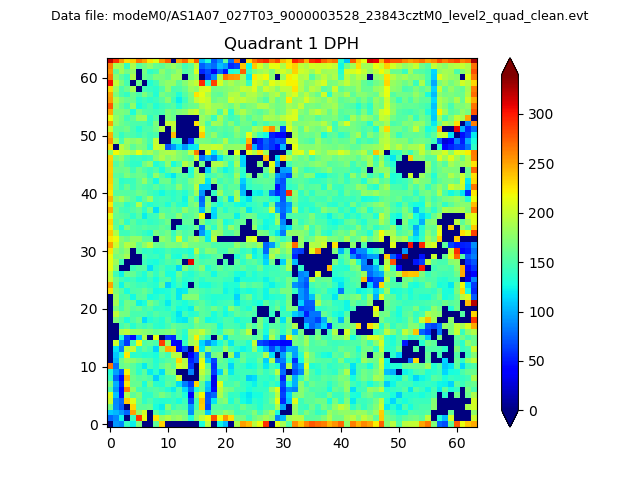
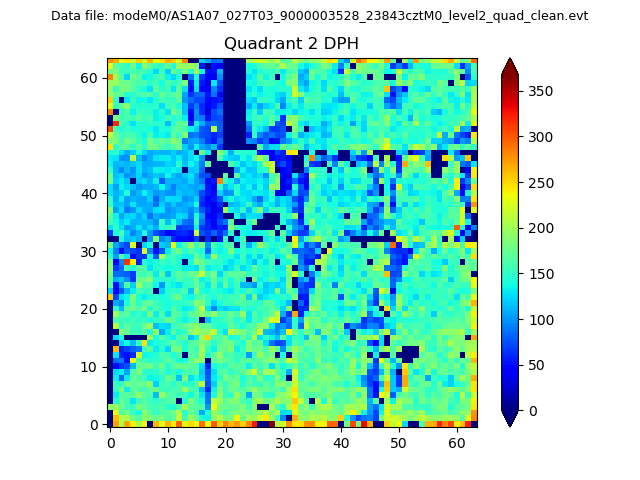
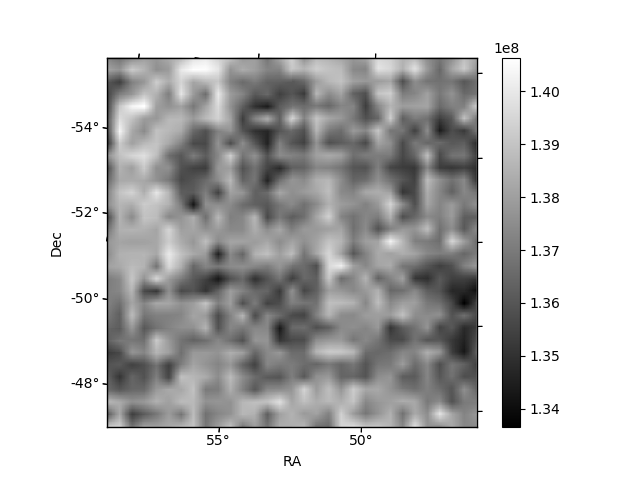
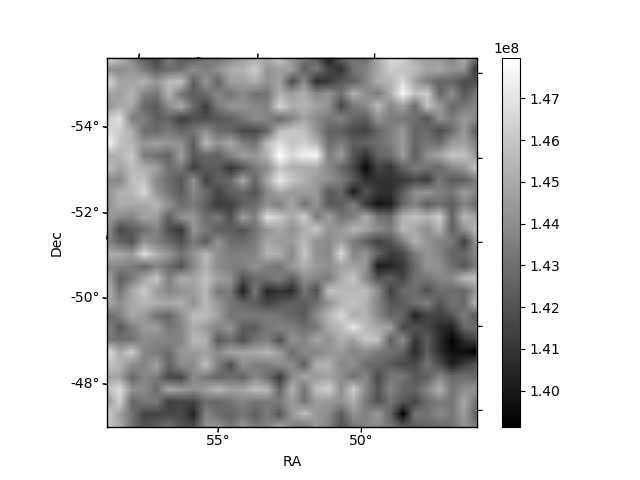
Histogram calculated using DETX and DETY for each event in the final _common_clean file
| Quadrant A |  |
 |
Quadrant B |
|---|---|---|---|
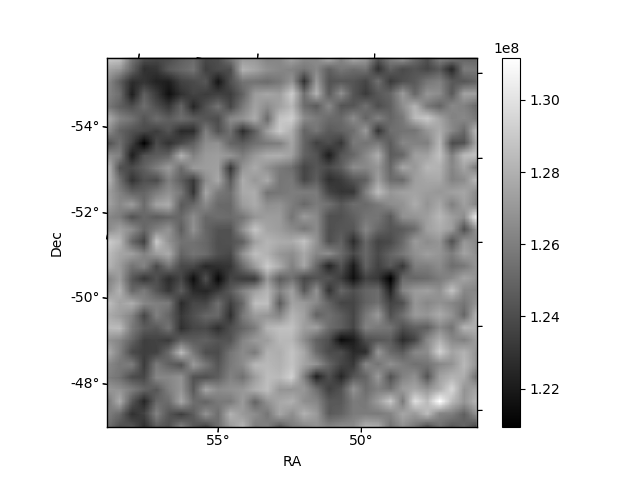
| Quadrant D | 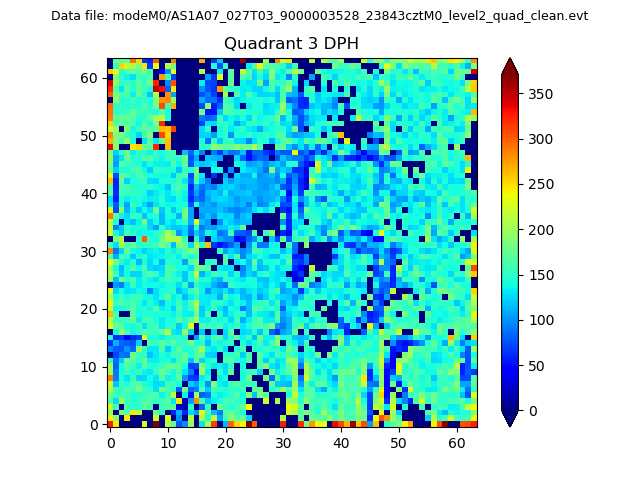 |
 |
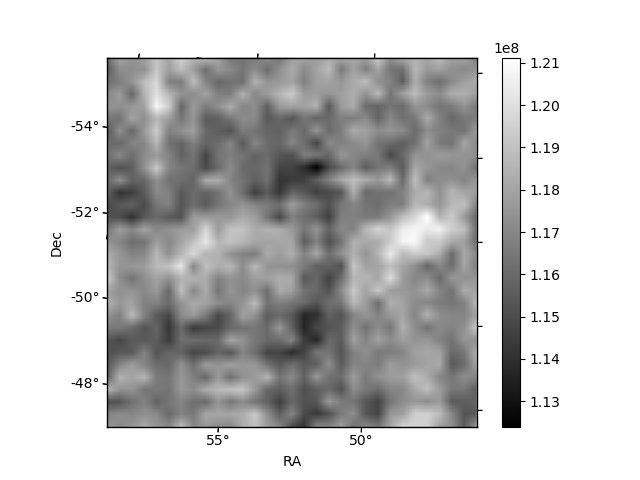
Quadrant C |
| Plot type | Count rate plots | Images |
|---|---|---|
| Comparison with Poisson distribution Blue bars denote a histogram of data divided into 1 sec bins. Red curve is a Poisson curve with rate = median count rate of data. |
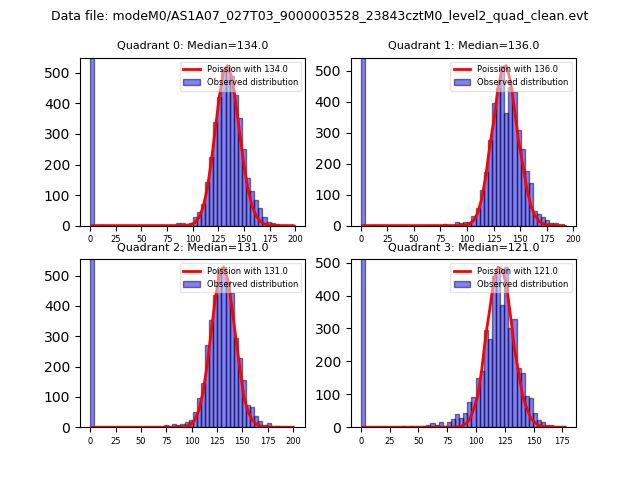 |
 |
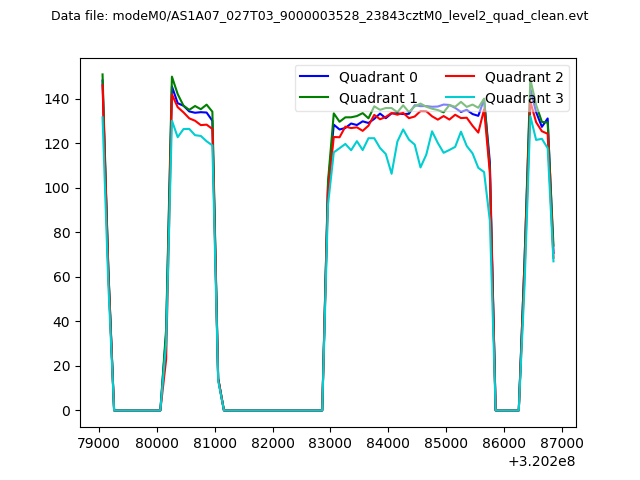
| Quadrant-wise count rates Data is divided into 100 sec bins |
 |
|
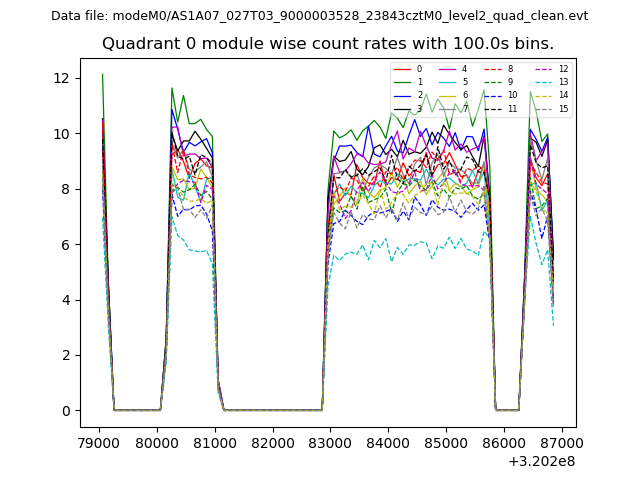
| Module-wise count rates for Quadrant A Data is divided into 100 sec bins |
 |
 |
| Module-wise count rates for Quadrant B Data is divided into 100 sec bins |
 |
 |
| Module-wise count rates for Quadrant C Data is divided into 100 sec bins |
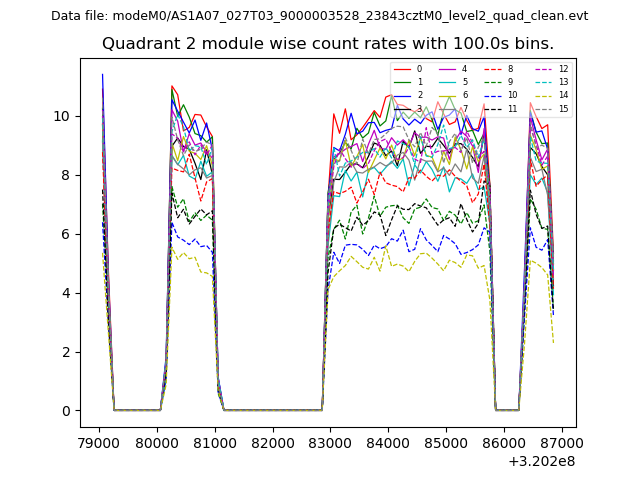 |
 |
| Module-wise count rates for Quadrant D Data is divided into 100 sec bins |
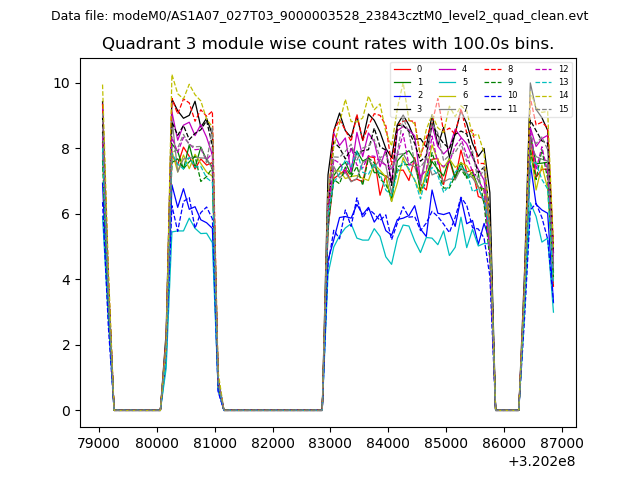 |
 |
| Parameter | Plot |
|---|---|
| CZT HV Monitor |  |
| D_VDD | 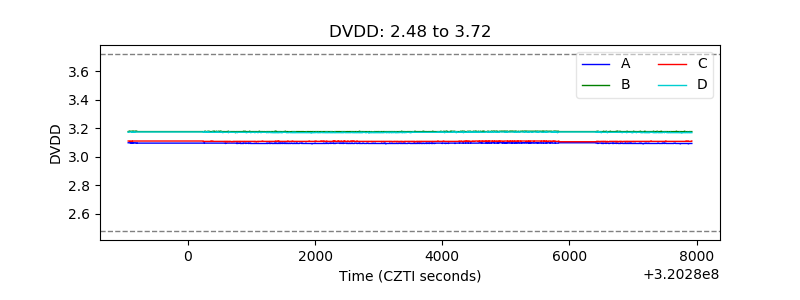 |
| Temperature 1 | 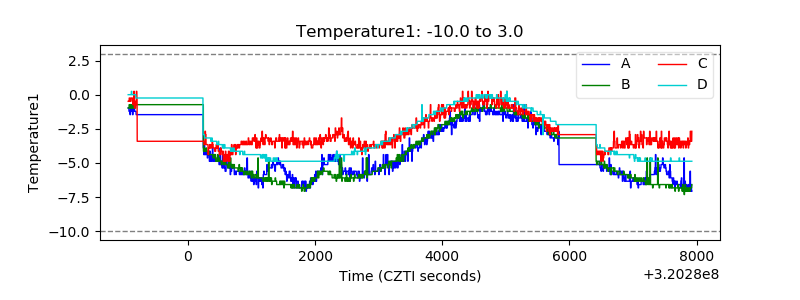 |
| Veto HV Monitor | 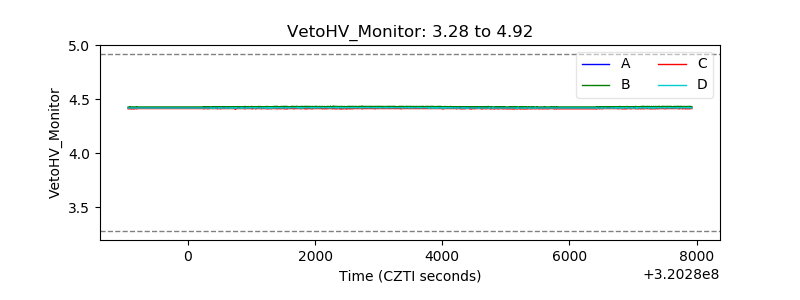 |
| Veto LLD |  |
| Alpha Counter | 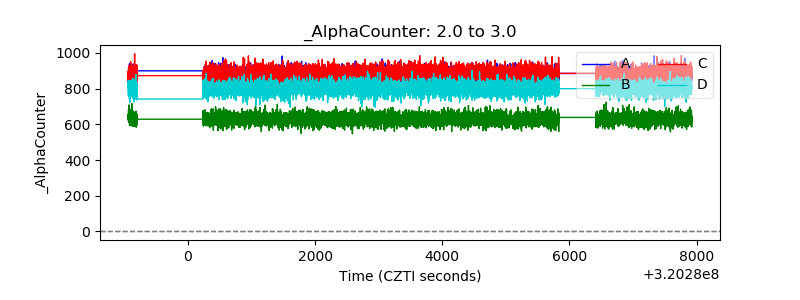 |
| _CPM_Rate | 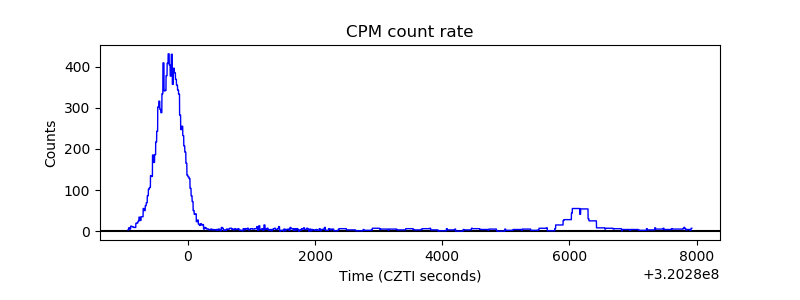 |
| CZT Counter | 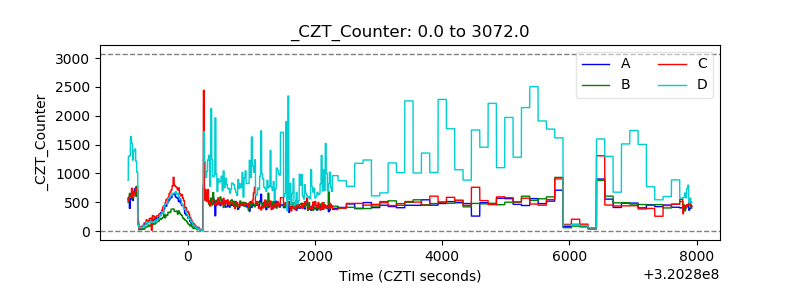 |
| +2.5 Volts monitor |  |
| +5 Volts monitor | 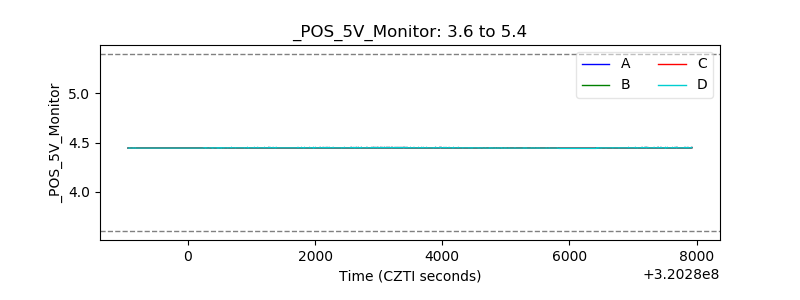 |
| _ROLL_ROT | 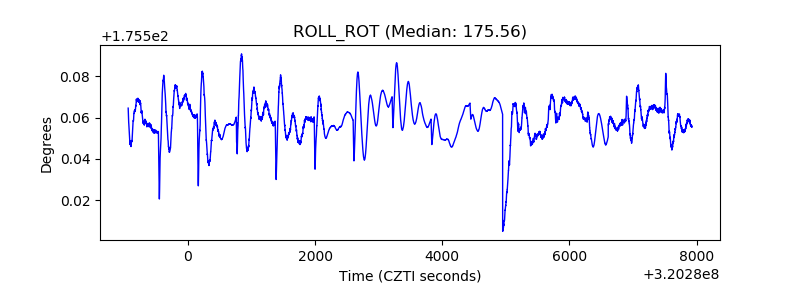 |
| _Roll_DEC | 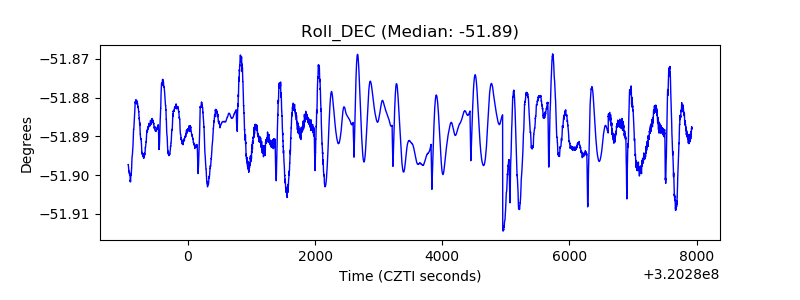 |
| _Roll_RA |  |
| Veto Counter | 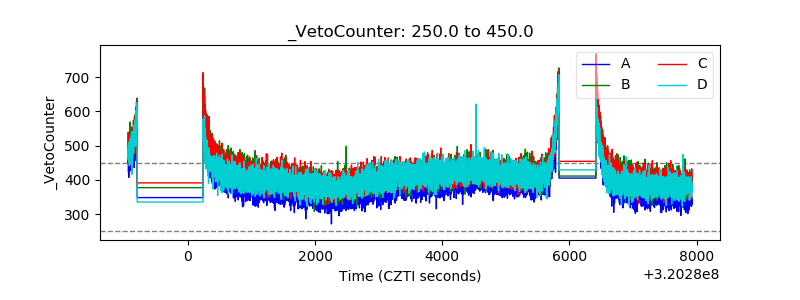 |