| Param | Original file | Final file |
|---|---|---|
| Filename | modeM0/AS1A07_027T03_9000003528_23844cztM0_level2.evt | modeM0/AS1A07_027T03_9000003528_23844cztM0_level2_quad_clean.evt |
| Size (bytes) | 561,366,720 | 90,230,400 |
| Size | 535.4 MB | 86.1 MB |
| Events in quadrant A | 3,595,527 | 557,892 |
| Events in quadrant B | 3,697,664 | 567,552 |
| Events in quadrant C | 3,774,342 | 545,658 |
| Events in quadrant D | 5,414,156 | 528,437 |
| Mode SS | |||
|---|---|---|---|
| Quadrant | BADHDUFLAG | Total packets | Discarded packets |
| A | 0 | 156 | 0 |
| B | 0 | 156 | 0 |
| C | 0 | 156 | 0 |
| D | 0 | 156 | 0 |
| Mode M0 | |||
|---|---|---|---|
| Quadrant | BADHDUFLAG | Total packets | Discarded packets |
| A | 0 | 15848 | 4 |
| B | 0 | 15899 | 3 |
| C | 0 | 16062 | 3 |
| D | 0 | 21363 | 3 |
| Mode M9 | |||
|---|---|---|---|
| Quadrant | BADHDUFLAG | Total packets | Discarded packets |
| A | 0 | 3 | 0 |
| B | 0 | 4 | 0 |
| C | 0 | 4 | 0 |
| D | 0 | 4 | 0 |
| Quadrant | Total seconds | Saturated seconds | Saturation percentage |
|---|---|---|---|
| A | 7653 | 111 | 1.450412% |
| B | 7653 | 142 | 1.855482% |
| C | 7653 | 188 | 2.456553% |
| D | 7653 | 164 | 2.142950% |
Noise dominated data is calculated using 1-second bins in cleaned event files. If a bin has >2000 counts, and if more than 50% of those come from <1% of pixels, then it is considered to be noise-dominated and hence unusable.
| Quadrant | # 1 sec bins | Bins with >0 counts | Bins with >2000 counts | High rate bins dominated by noise | Noise dominated (total time) | Noise dominated (detector-on time) | Marked lightcurve |
|---|---|---|---|---|---|---|---|
| A | 7818 | 7656 | 0 | 0 | 0.00% | 0.00% | 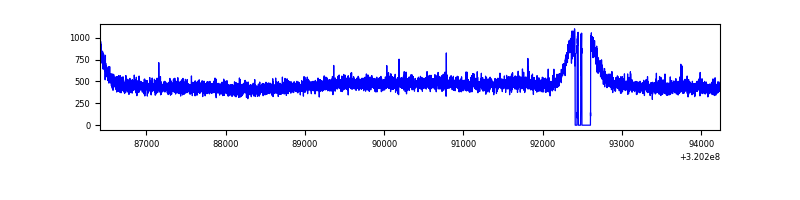 |
| B | 7818 | 7656 | 0 | 0 | 0.00% | 0.00% | 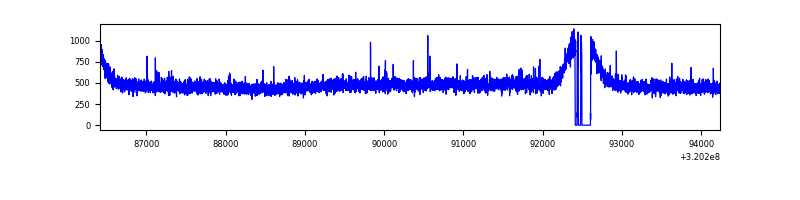 |
| C | 7818 | 7656 | 3 | 3 | 0.04% | 0.04% | 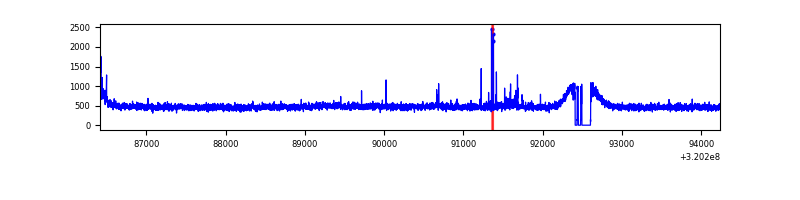 |
| D | 7818 | 7656 | 33 | 33 | 0.42% | 0.43% | 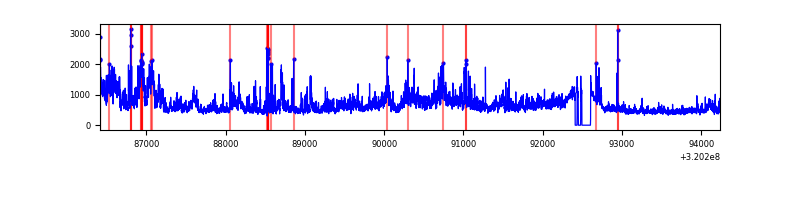 |
Top three noisy pixels from each quadrant. If the there are fewer than three noisy pixels in the level2.evt file, extra rows are filled as -1
| Pixel properties | Quadrant properties | ||||||
|---|---|---|---|---|---|---|---|
| Quadrant | DetID | PixID | Counts | Sigma | Mean | Median | Sigma |
| A | 13 | 254 | 13039 | 64.09 | 932 | 913 | 189.2 |
| A | 3 | 137 | 8324 | 39.17 | 932 | 913 | 189.2 |
| A | 0 | 226 | 8020 | 37.56 | 932 | 913 | 189.2 |
| B | 12 | 111 | 22029 | 116.93 | 935 | 910 | 180.6 |
| B | 11 | 111 | 19234 | 101.45 | 935 | 910 | 180.6 |
| B | 14 | 111 | 16672 | 87.27 | 935 | 910 | 180.6 |
| C | 14 | 238 | 140975 | 661.13 | 898 | 903 | 211.9 |
| C | 0 | 239 | 51140 | 237.11 | 898 | 903 | 211.9 |
| C | 7 | 247 | 40773 | 188.18 | 898 | 903 | 211.9 |
| D | 8 | 195 | 1611190 | 7295.03 | 902 | 872 | 220.7 |
| D | 1 | 52 | 252089 | 1138.06 | 902 | 872 | 220.7 |
| D | 12 | 218 | 54830 | 244.44 | 902 | 872 | 220.7 |
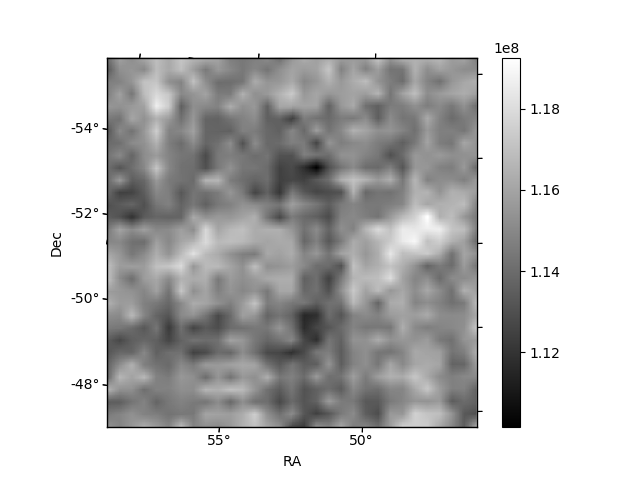
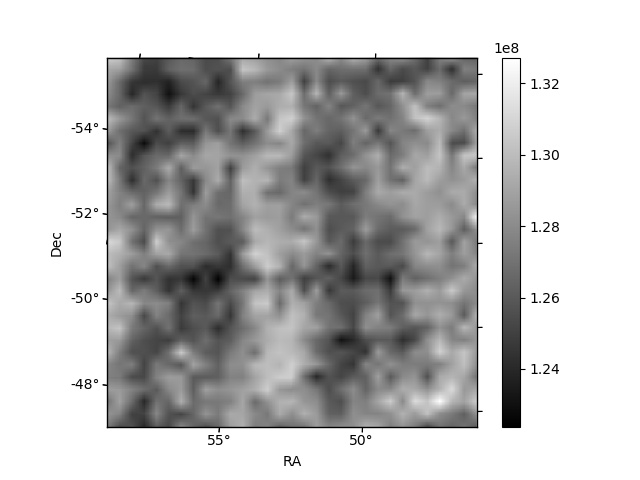
Histogram calculated using DETX and DETY for each event in the final _common_clean file
| Quadrant A |  |
 |
Quadrant B |
|---|---|---|---|
| Quadrant D |  |
 |
Quadrant C |
| Plot type | Count rate plots | Images |
|---|---|---|
| Comparison with Poisson distribution Blue bars denote a histogram of data divided into 1 sec bins. Red curve is a Poisson curve with rate = median count rate of data. |
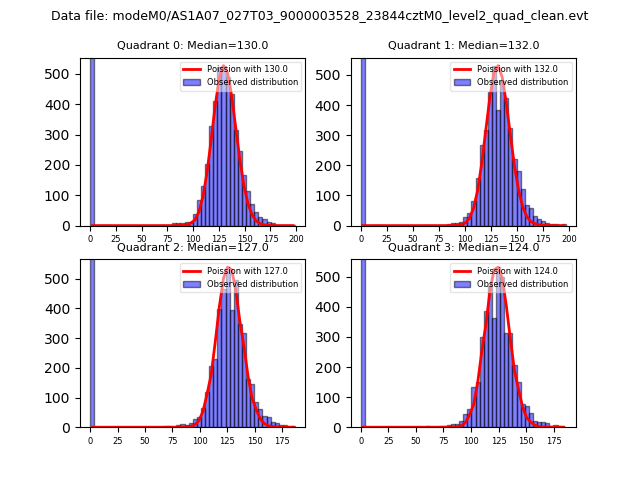 |
 |
| Quadrant-wise count rates Data is divided into 100 sec bins |
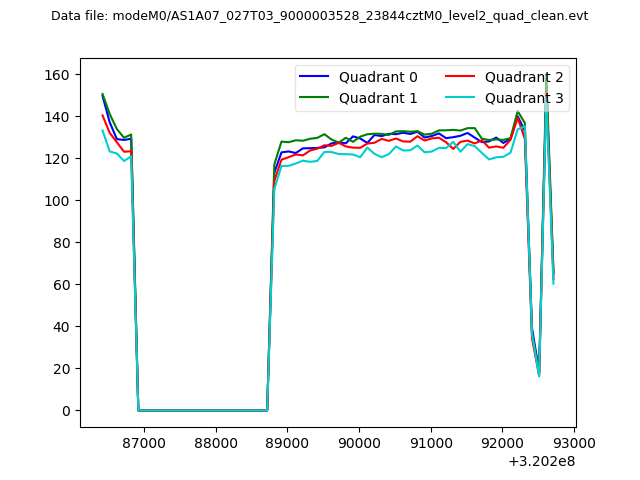 |
|
| Module-wise count rates for Quadrant A Data is divided into 100 sec bins |
 |
 |
| Module-wise count rates for Quadrant B Data is divided into 100 sec bins |
 |
 |
| Module-wise count rates for Quadrant C Data is divided into 100 sec bins |
 |
 |
| Module-wise count rates for Quadrant D Data is divided into 100 sec bins |
 |
 |
| Parameter | Plot |
|---|---|
| CZT HV Monitor |  |
| D_VDD |  |
| Temperature 1 |  |
| Veto HV Monitor |  |
| Veto LLD |  |
| Alpha Counter | 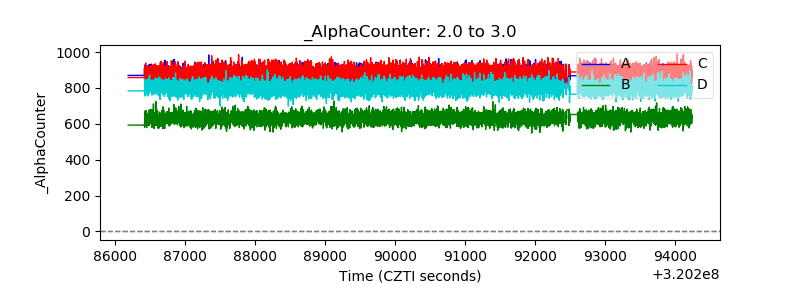 |
| _CPM_Rate | 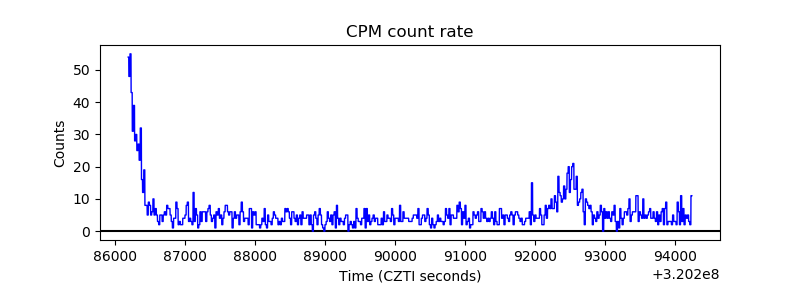 |
| CZT Counter |  |
| +2.5 Volts monitor |  |
| +5 Volts monitor |  |
| _ROLL_ROT |  |
| _Roll_DEC |  |
| _Roll_RA |  |
| Veto Counter |  |