| Param | Original file | Final file |
|---|---|---|
| Filename | modeM0/AS1A07_027T03_9000003528_23845cztM0_level2.evt | modeM0/AS1A07_027T03_9000003528_23845cztM0_level2_quad_clean.evt |
| Size (bytes) | 1,332,547,200 | 230,247,360 |
| Size | 1.2 GB | 219.6 MB |
| Events in quadrant A | 7,963,567 | 1,478,976 |
| Events in quadrant B | 8,169,710 | 1,503,573 |
| Events in quadrant C | 8,825,180 | 1,438,846 |
| Events in quadrant D | 14,244,642 | 1,374,131 |
| Mode SS | |||
|---|---|---|---|
| Quadrant | BADHDUFLAG | Total packets | Discarded packets |
| A | 0 | 346 | 0 |
| B | 0 | 346 | 0 |
| C | 0 | 346 | 0 |
| D | 0 | 346 | 0 |
| Mode M0 | |||
|---|---|---|---|
| Quadrant | BADHDUFLAG | Total packets | Discarded packets |
| A | 0 | 34907 | 3 |
| B | 0 | 35141 | 3 |
| C | 0 | 36901 | 3 |
| D | 0 | 54046 | 3 |
| Mode M9 | |||
|---|---|---|---|
| Quadrant | BADHDUFLAG | Total packets | Discarded packets |
| A | 0 | 7 | 0 |
| B | 0 | 7 | 0 |
| C | 0 | 7 | 0 |
| D | 0 | 7 | 0 |
| Quadrant | Total seconds | Saturated seconds | Saturation percentage |
|---|---|---|---|
| A | 17081 | 151 | 0.884023% |
| B | 17081 | 204 | 1.194309% |
| C | 17082 | 443 | 2.593373% |
| D | 17082 | 780 | 4.566210% |
Noise dominated data is calculated using 1-second bins in cleaned event files. If a bin has >2000 counts, and if more than 50% of those come from <1% of pixels, then it is considered to be noise-dominated and hence unusable.
| Quadrant | # 1 sec bins | Bins with >0 counts | Bins with >2000 counts | High rate bins dominated by noise | Noise dominated (total time) | Noise dominated (detector-on time) | Marked lightcurve |
|---|---|---|---|---|---|---|---|
| A | 17826 | 17085 | 0 | 0 | 0.00% | 0.00% | 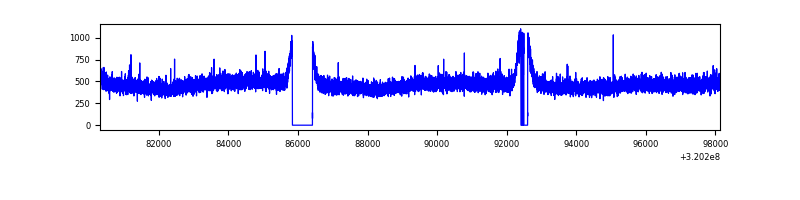 |
| B | 17826 | 17085 | 3 | 3 | 0.02% | 0.02% | 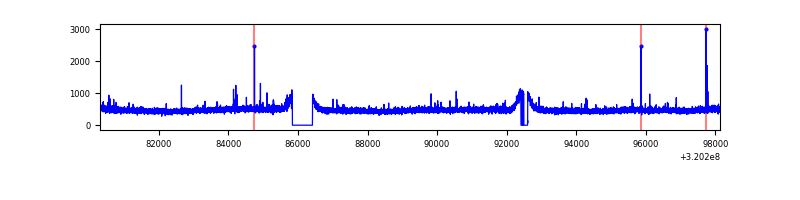 |
| C | 17827 | 17086 | 168 | 168 | 0.94% | 0.98% | 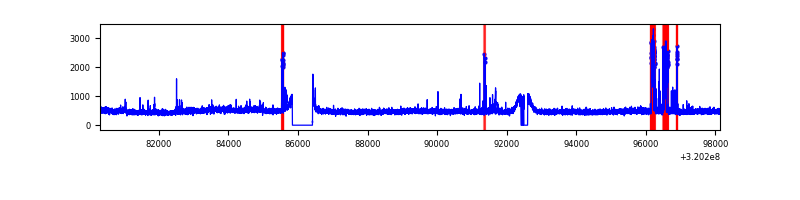 |
| D | 17827 | 17086 | 538 | 538 | 3.02% | 3.15% | 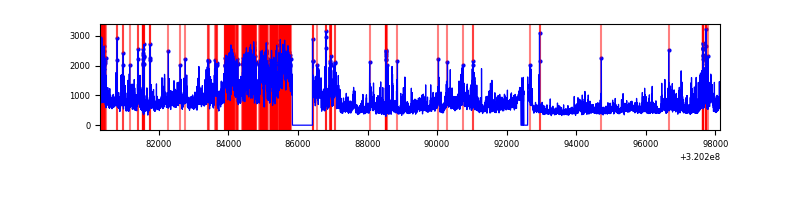 |
Top three noisy pixels from each quadrant. If the there are fewer than three noisy pixels in the level2.evt file, extra rows are filled as -1
| Pixel properties | Quadrant properties | ||||||
|---|---|---|---|---|---|---|---|
| Quadrant | DetID | PixID | Counts | Sigma | Mean | Median | Sigma |
| A | 13 | 254 | 28824 | 64.91 | 2061 | 2017 | 413.0 |
| A | 3 | 137 | 18175 | 39.13 | 2061 | 2017 | 413.0 |
| A | 0 | 226 | 17808 | 38.24 | 2061 | 2017 | 413.0 |
| B | 12 | 111 | 47291 | 116.11 | 2058 | 2005 | 390.0 |
| B | 11 | 111 | 41405 | 101.02 | 2058 | 2005 | 390.0 |
| B | 14 | 111 | 35500 | 85.88 | 2058 | 2005 | 390.0 |
| C | 0 | 207 | 572089 | 1243.09 | 1967 | 1976 | 458.6 |
| C | 14 | 238 | 312320 | 676.68 | 1967 | 1976 | 458.6 |
| C | 0 | 239 | 114985 | 246.41 | 1967 | 1976 | 458.6 |
| D | 8 | 195 | 4731483 | 9872.57 | 1975 | 1915 | 479.1 |
| D | 1 | 52 | 1615901 | 3369.06 | 1975 | 1915 | 479.1 |
| D | 12 | 233 | 133294 | 274.24 | 1975 | 1915 | 479.1 |
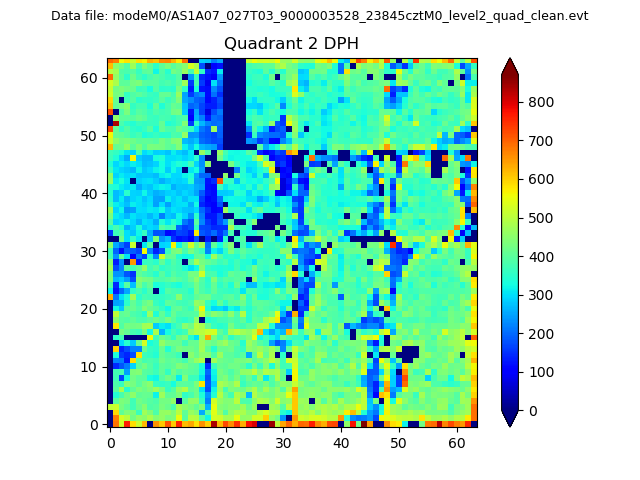
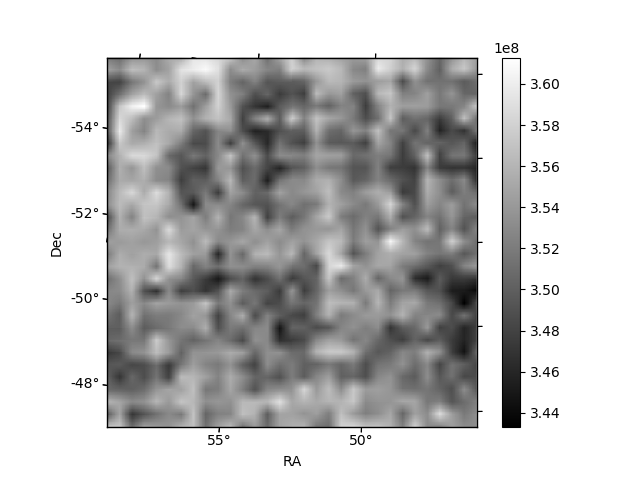
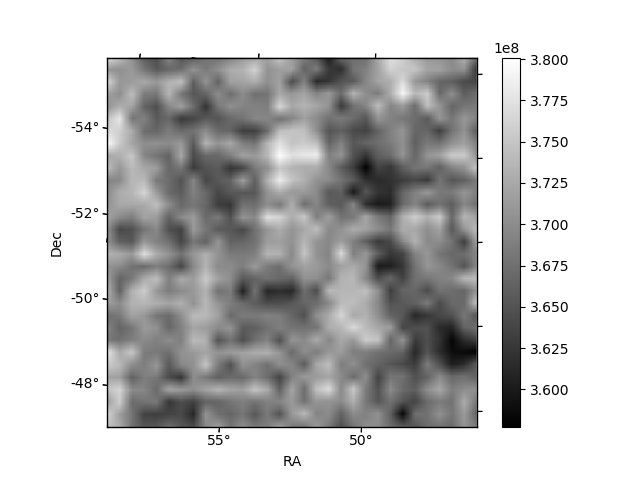
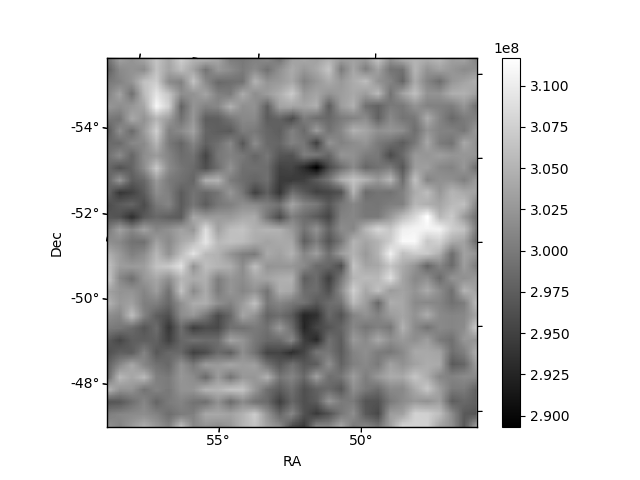
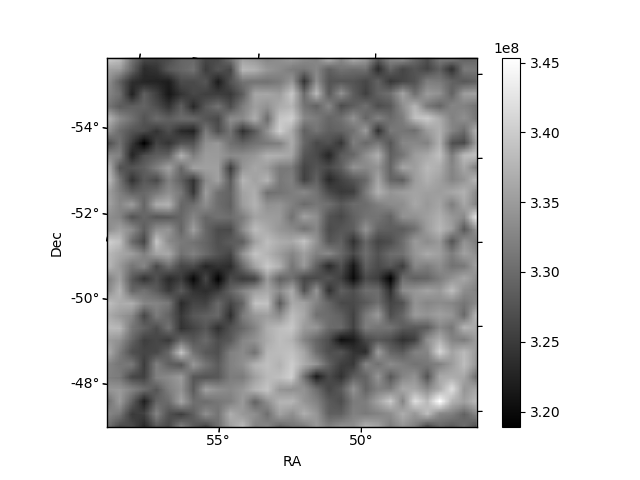
Histogram calculated using DETX and DETY for each event in the final _common_clean file
| Quadrant A |  |
 |
Quadrant B |
|---|---|---|---|
| Quadrant D | 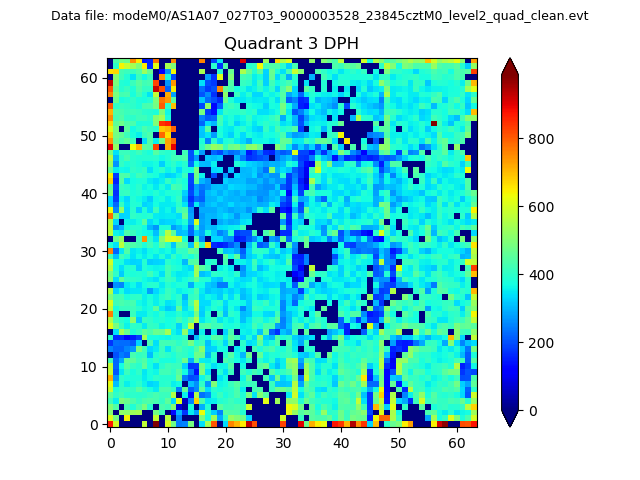 |
 |
Quadrant C |
| Plot type | Count rate plots | Images |
|---|---|---|
| Comparison with Poisson distribution Blue bars denote a histogram of data divided into 1 sec bins. Red curve is a Poisson curve with rate = median count rate of data. |
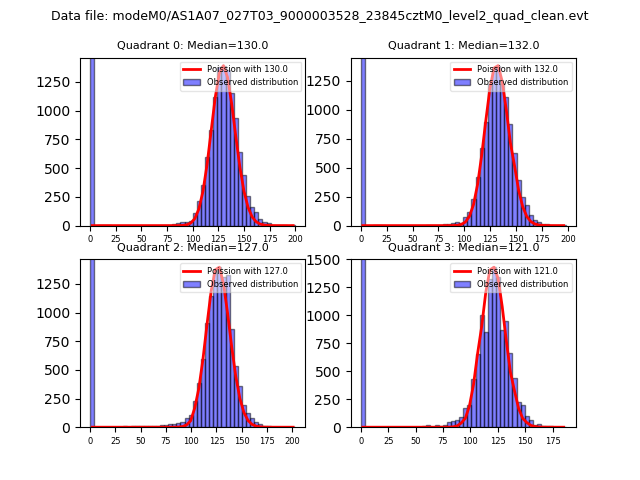 |
 |
| Quadrant-wise count rates Data is divided into 100 sec bins |
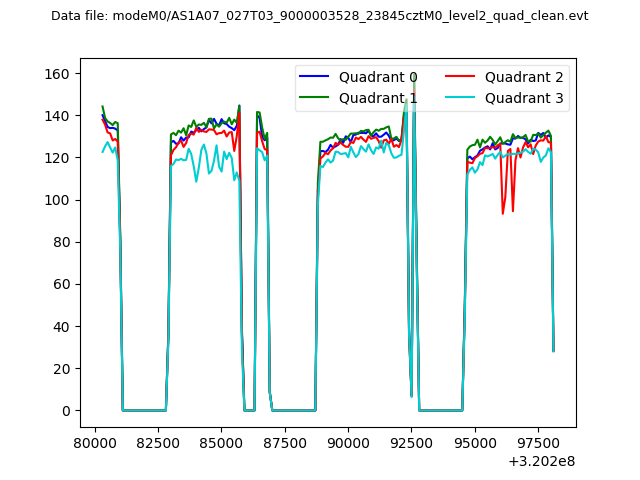 |
|
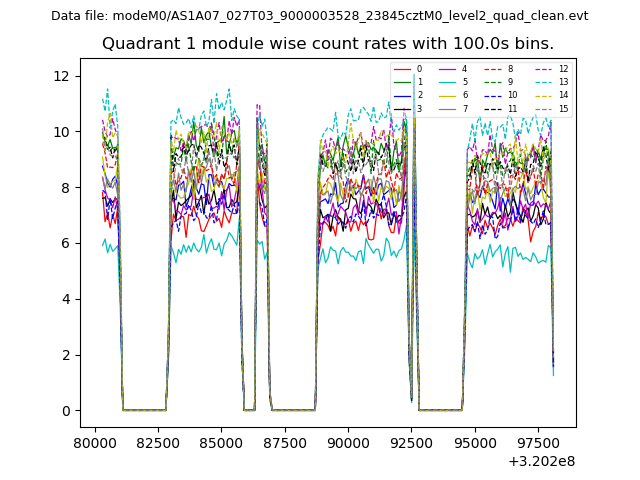
| Module-wise count rates for Quadrant A Data is divided into 100 sec bins |
 |
 |
| Module-wise count rates for Quadrant B Data is divided into 100 sec bins |
 |
 |
| Module-wise count rates for Quadrant C Data is divided into 100 sec bins |
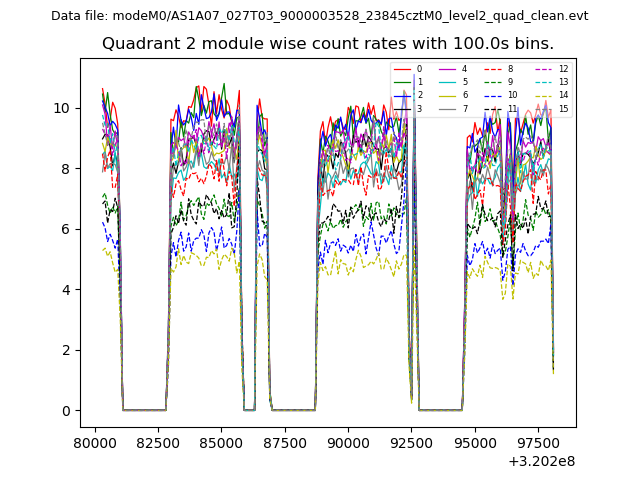 |
 |
| Module-wise count rates for Quadrant D Data is divided into 100 sec bins |
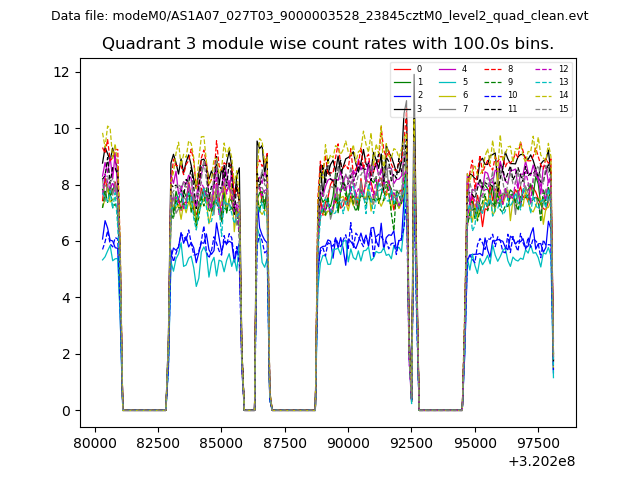 |
 |
| Parameter | Plot |
|---|---|
| CZT HV Monitor |  |
| D_VDD | 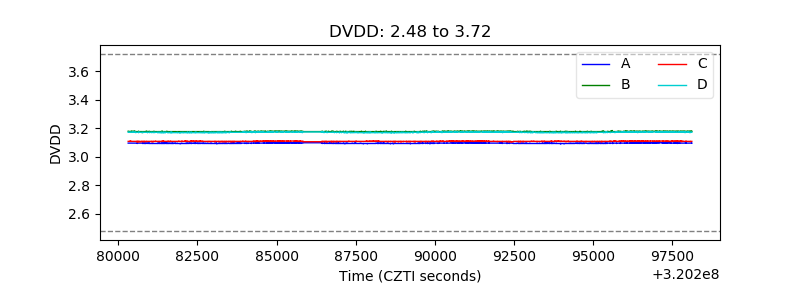 |
| Temperature 1 | 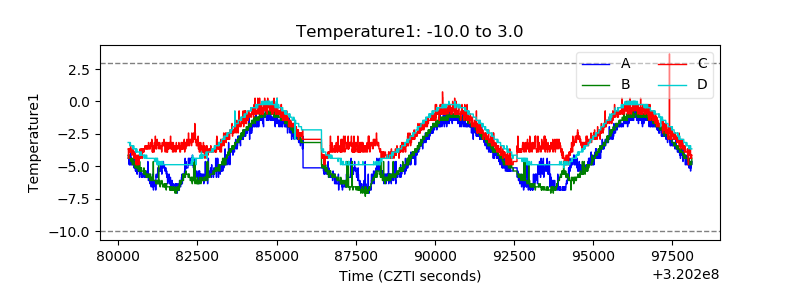 |
| Veto HV Monitor | 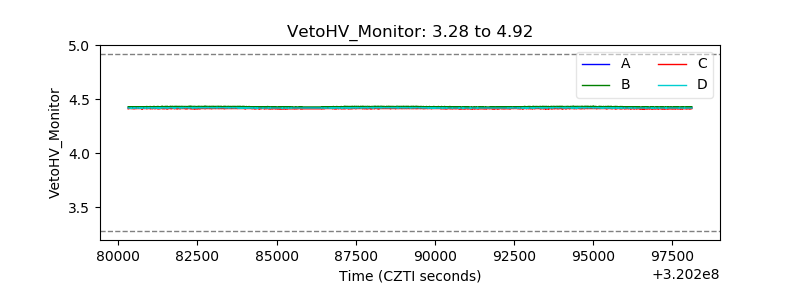 |
| Veto LLD | 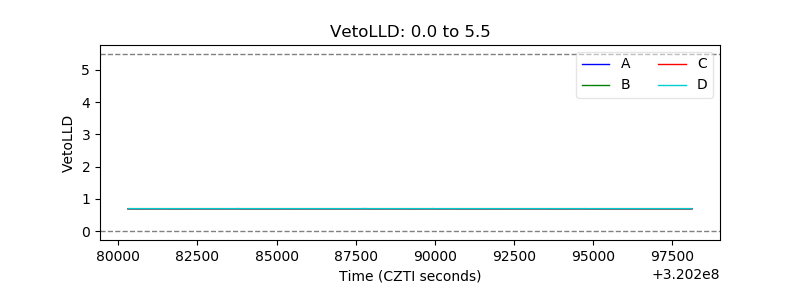 |
| Alpha Counter | 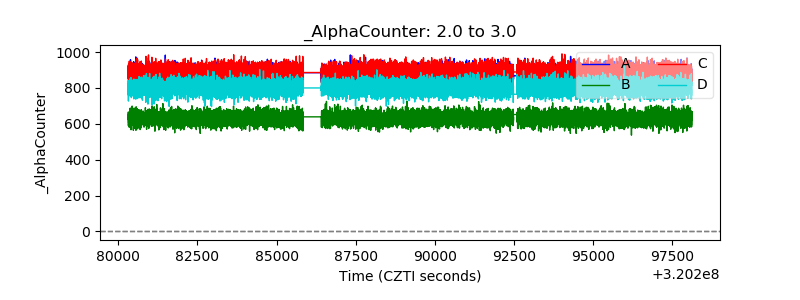 |
| _CPM_Rate | 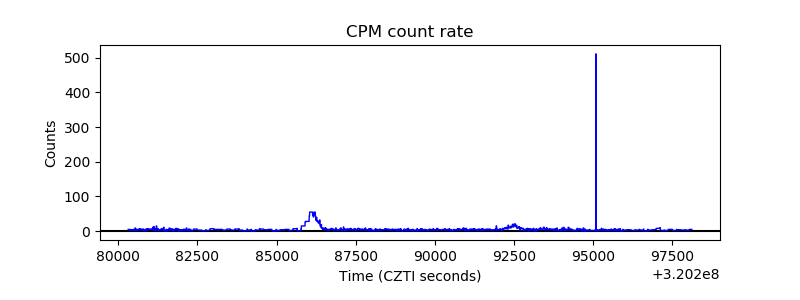 |
| CZT Counter | 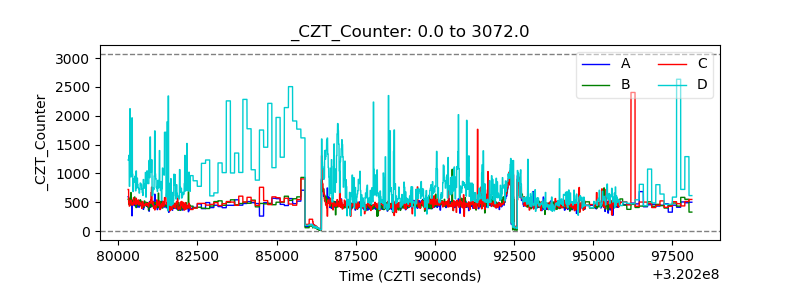 |
| +2.5 Volts monitor |  |
| +5 Volts monitor | 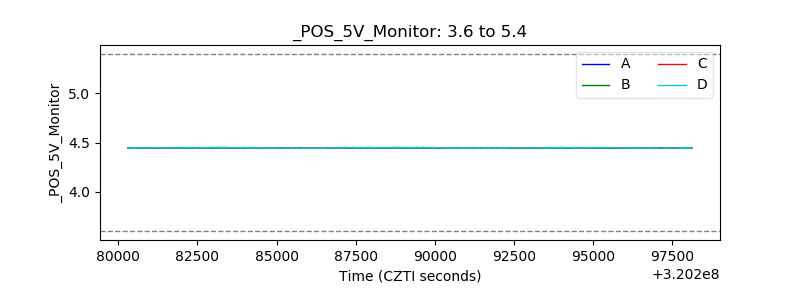 |
| _ROLL_ROT | 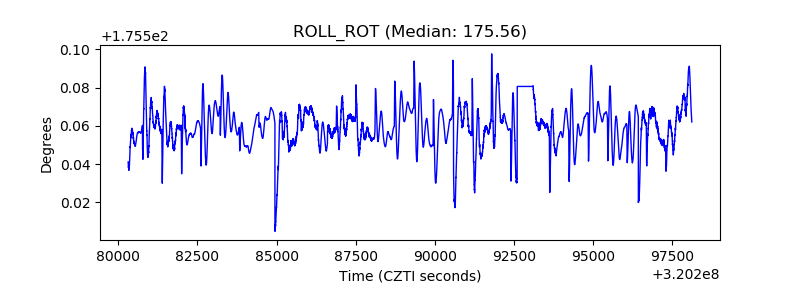 |
| _Roll_DEC | 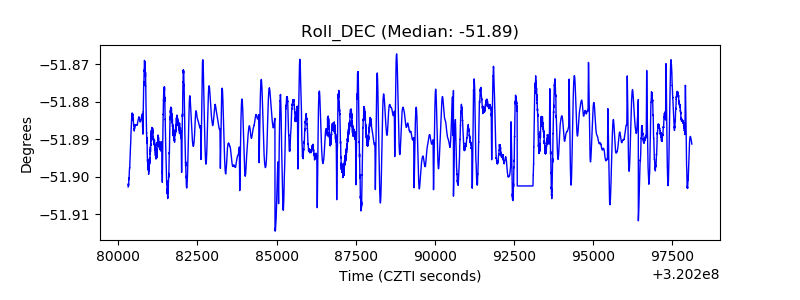 |
| _Roll_RA | 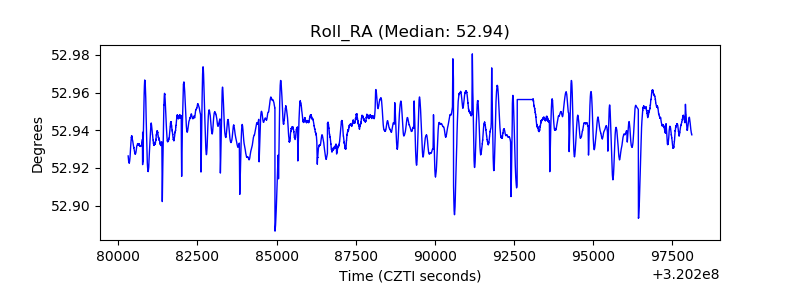 |
| Veto Counter | 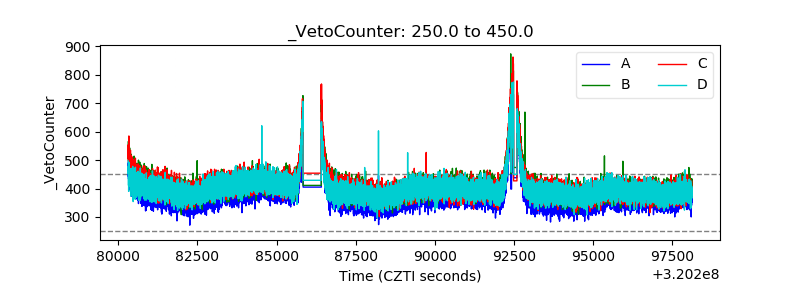 |