| Param | Original file | Final file |
|---|---|---|
| Filename | modeM0/AS1A07_001T06_9000003530cztM0_level2.fits | modeM0/AS1A07_001T06_9000003530cztM0_level2_quad_clean.evt |
| Size (bytes) | 102,784,320 | 142,683,840 |
| Size | 98.0 MB | 136.1 MB |
| Events in quadrant A | 618,802 | 922,200 |
| Events in quadrant B | 595,304 | 927,873 |
| Events in quadrant C | 601,258 | 886,648 |
| Events in quadrant D | 530,732 | 818,068 |
| Mode SS | |||
|---|---|---|---|
| Quadrant | BADHDUFLAG | Total packets | Discarded packets |
| A | 0 | 226 | 0 |
| B | 0 | 226 | 0 |
| C | 0 | 226 | 0 |
| D | 0 | 226 | 0 |
| Mode M0 | |||
|---|---|---|---|
| Quadrant | BADHDUFLAG | Total packets | Discarded packets |
| A | 0 | 22611 | 0 |
| B | 0 | 22675 | 0 |
| C | 0 | 23499 | 0 |
| D | 0 | 24709 | 0 |
| Mode M9 | |||
|---|---|---|---|
| Quadrant | BADHDUFLAG | Total packets | Discarded packets |
| A | 0 | 7 | 0 |
| B | 0 | 7 | 0 |
| C | 0 | 7 | 0 |
| D | 0 | 7 | 0 |
| Quadrant | Total seconds | Saturated seconds | Saturation percentage |
|---|---|---|---|
| A | 11072 | 240 | 2.167630% |
| B | 11073 | 280 | 2.528673% |
| C | 11073 | 374 | 3.377585% |
| D | 11073 | 272 | 2.456426% |
Noise dominated data is calculated using 1-second bins in cleaned event files. If a bin has >2000 counts, and if more than 50% of those come from <1% of pixels, then it is considered to be noise-dominated and hence unusable.
| Quadrant | # 1 sec bins | Bins with >0 counts | Bins with >2000 counts | High rate bins dominated by noise | Noise dominated (total time) | Noise dominated (detector-on time) | Marked lightcurve |
|---|---|---|---|---|---|---|---|
| A | 17703 | 11072 | 0 | 0 | 0.00% | 0.00% | 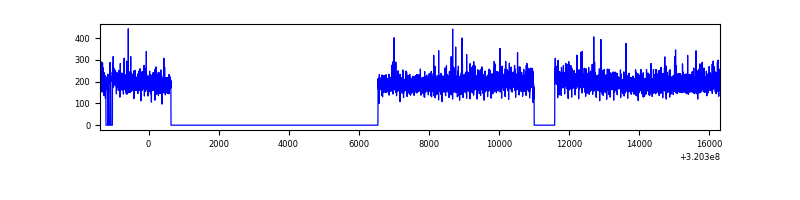 |
| B | 17704 | 11074 | 0 | 0 | 0.00% | 0.00% | 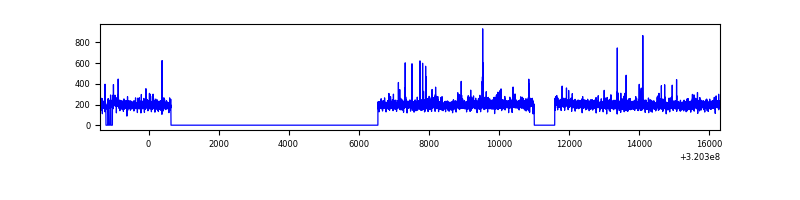 |
| C | 17704 | 11074 | 0 | 0 | 0.00% | 0.00% | 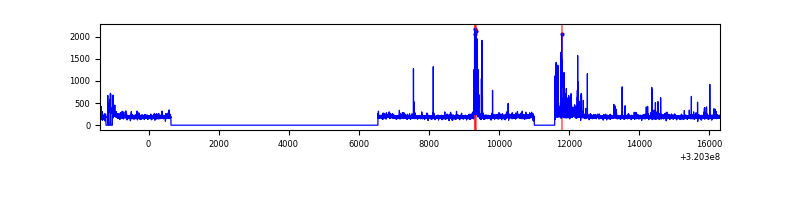 |
| D | 17704 | 11074 | 0 | 0 | 0.00% | 0.00% |  |
Top three noisy pixels from each quadrant. If the there are fewer than three noisy pixels in the level2.evt file, extra rows are filled as -1
| Pixel properties | Quadrant properties | ||||||
|---|---|---|---|---|---|---|---|
| Quadrant | DetID | PixID | Counts | Sigma | Mean | Median | Sigma |
| A | 14 | 188 | 653 | 12.02 | 160 | 150 | 41.9 |
| A | 0 | 29 | 595 | 10.63 | 160 | 150 | 41.9 |
| A | 14 | 204 | 578 | 10.23 | 160 | 150 | 41.9 |
| B | 2 | 9 | 503 | 10.47 | 157 | 149 | 33.8 |
| B | 2 | 8 | 429 | 8.28 | 157 | 149 | 33.8 |
| B | 14 | 254 | 406 | 7.6 | 157 | 149 | 33.8 |
| C | 3 | 158 | 428 | 6.62 | 159 | 148 | 42.3 |
| C | 12 | 241 | 424 | 6.53 | 159 | 148 | 42.3 |
| C | 2 | 191 | 422 | 6.48 | 159 | 148 | 42.3 |
| D | 15 | 46 | 412 | 6.56 | 151 | 137 | 41.9 |
| D | 6 | 67 | 401 | 6.3 | 151 | 137 | 41.9 |
| D | 3 | 14 | 388 | 5.99 | 151 | 137 | 41.9 |
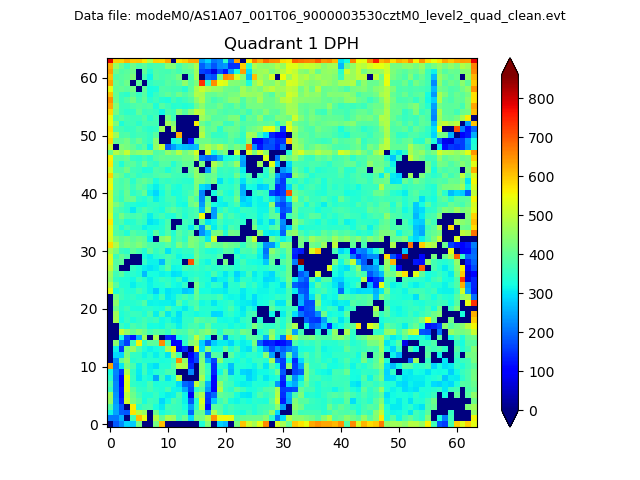
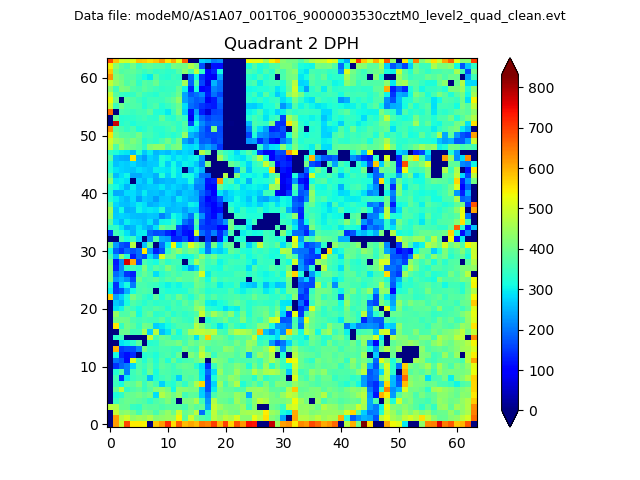
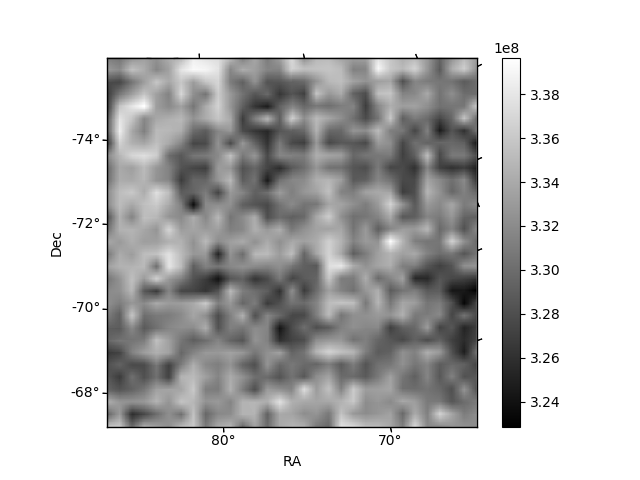
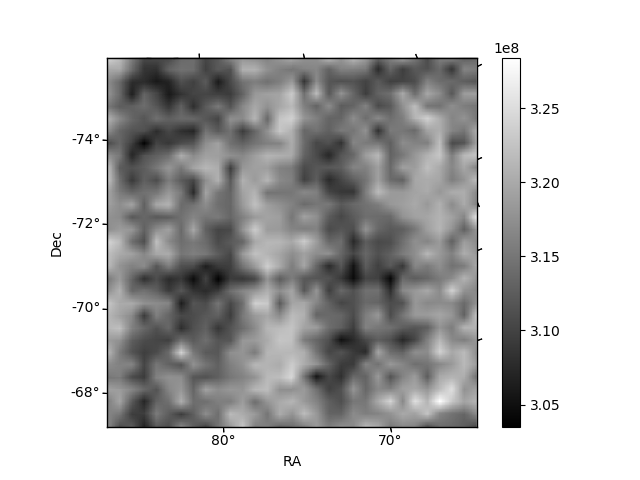
Histogram calculated using DETX and DETY for each event in the final _common_clean file
| Quadrant A |  |
 |
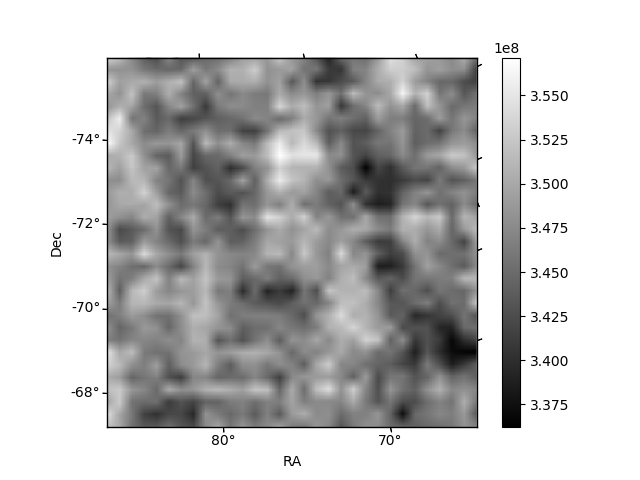
Quadrant B |
|---|---|---|---|
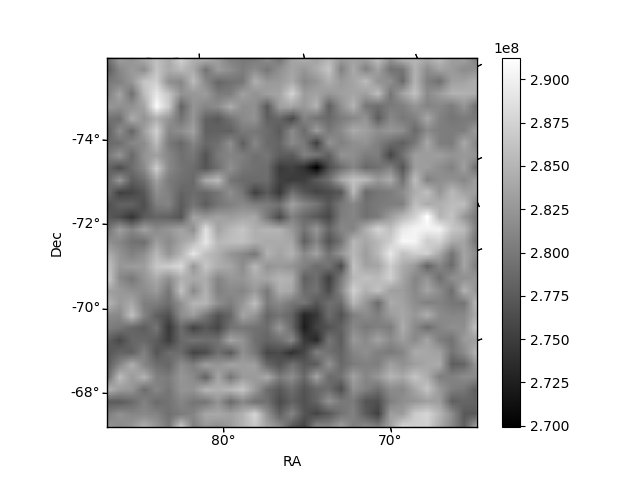
| Quadrant D | 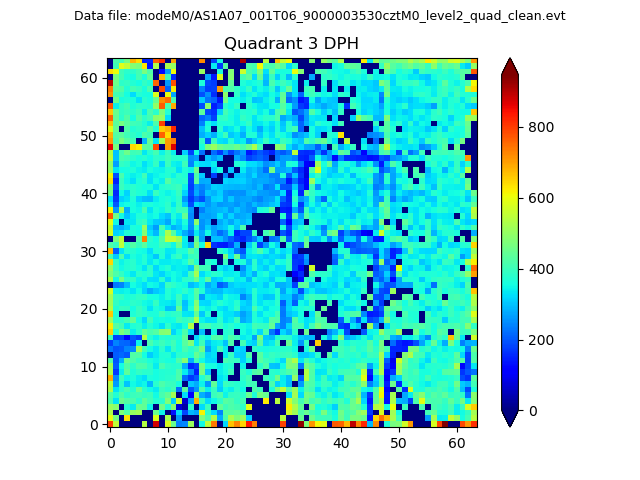 |
 |
Quadrant C |
| Plot type | Count rate plots | Images |
|---|---|---|
| Comparison with Poisson distribution Blue bars denote a histogram of data divided into 1 sec bins. Red curve is a Poisson curve with rate = median count rate of data. |
 |
 |
| Quadrant-wise count rates Data is divided into 100 sec bins |
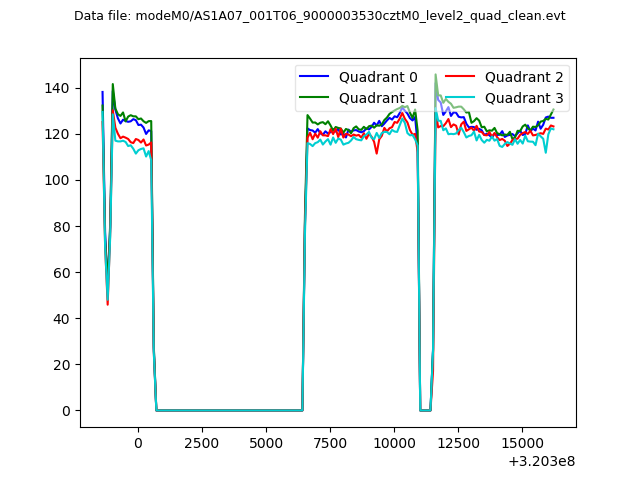 |
|
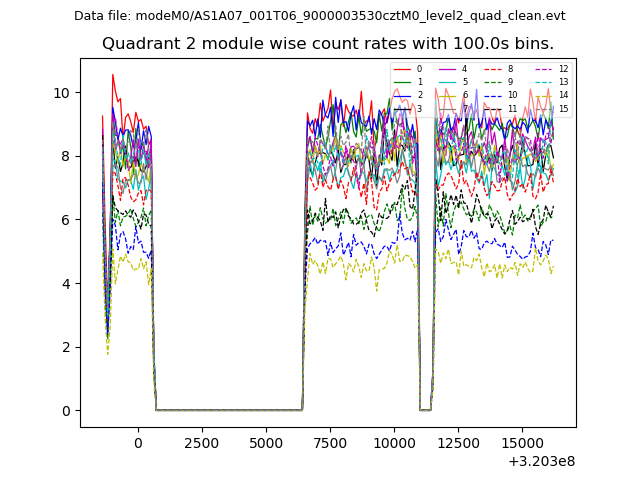
| Module-wise count rates for Quadrant A Data is divided into 100 sec bins |
 |
 |
| Module-wise count rates for Quadrant B Data is divided into 100 sec bins |
 |
 |
| Module-wise count rates for Quadrant C Data is divided into 100 sec bins |
 |
 |
| Module-wise count rates for Quadrant D Data is divided into 100 sec bins |
 |
 |
| Parameter | Plot |
|---|---|
| CZT HV Monitor |  |
| D_VDD | 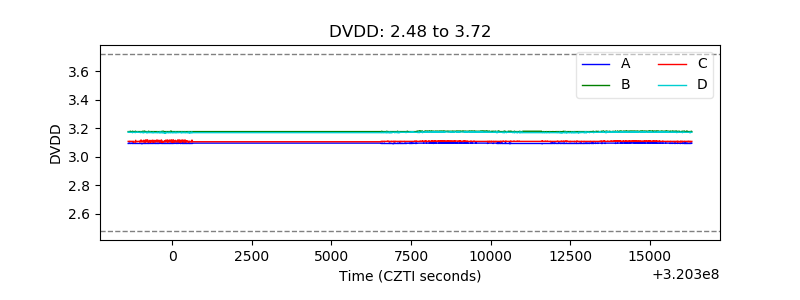 |
| Temperature 1 |  |
| Veto HV Monitor |  |
| Veto LLD | 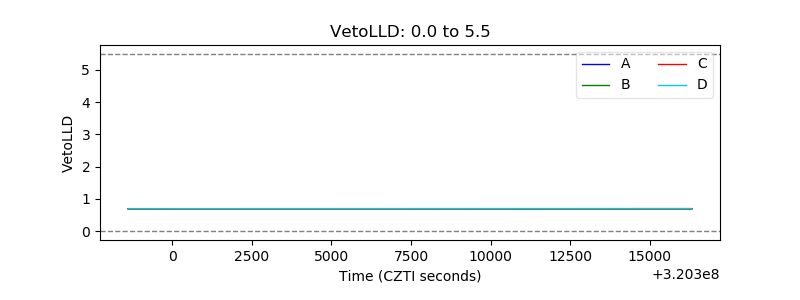 |
| Alpha Counter | 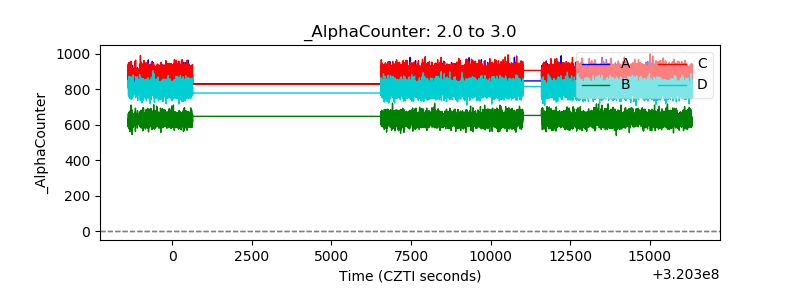 |
| _CPM_Rate | 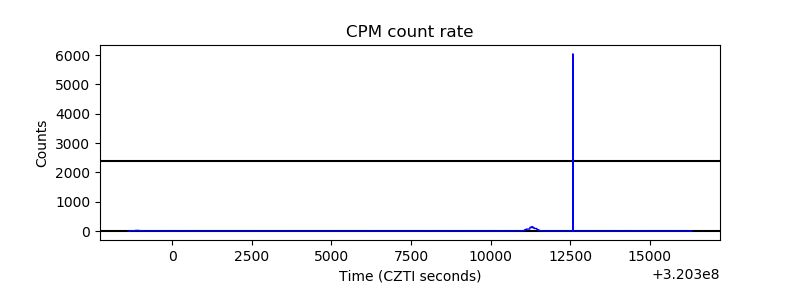 |
| CZT Counter | 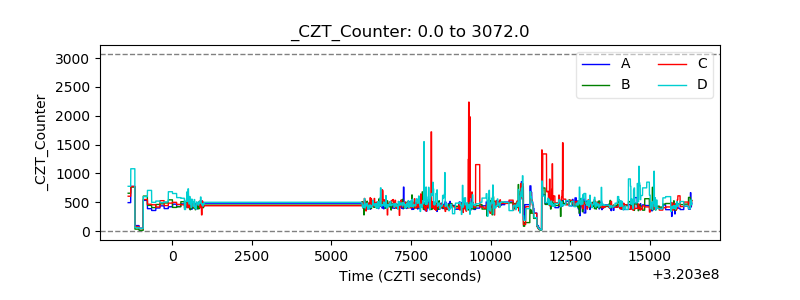 |
| +2.5 Volts monitor |  |
| +5 Volts monitor | 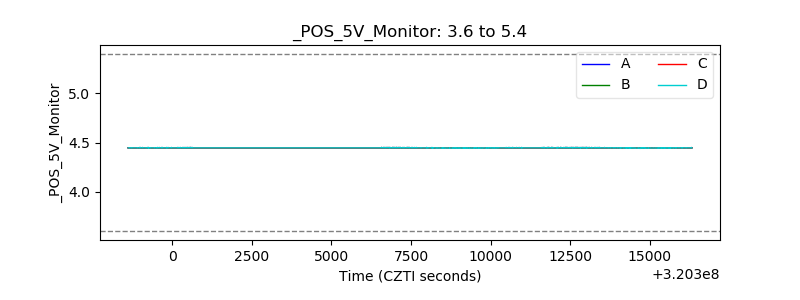 |
| _ROLL_ROT |  |
| _Roll_DEC | 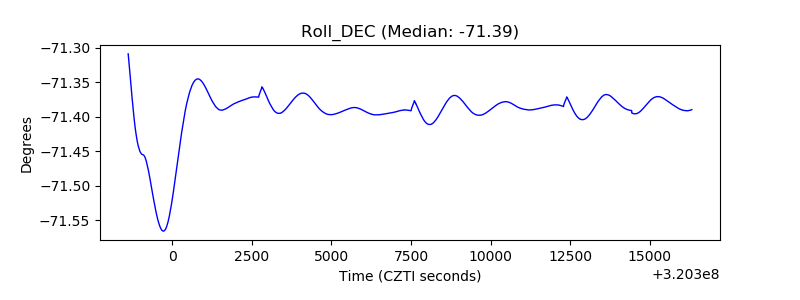 |
| _Roll_RA | 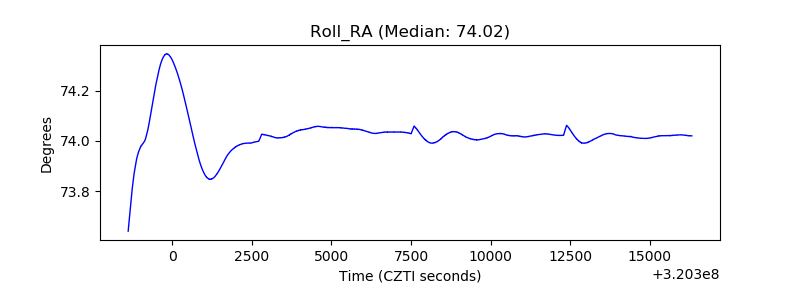 |
| Veto Counter |  |