| Param | Original file | Final file |
|---|---|---|
| Filename | modeM0/AS1A07_001T06_9000003530_23845cztM0_level2.evt | modeM0/AS1A07_001T06_9000003530_23845cztM0_level2_quad_clean.evt |
| Size (bytes) | 139,328,640 | 35,147,520 |
| Size | 132.9 MB | 33.5 MB |
| Events in quadrant A | 935,641 | 238,947 |
| Events in quadrant B | 953,492 | 243,011 |
| Events in quadrant C | 983,405 | 223,914 |
| Events in quadrant D | 1,215,466 | 219,905 |
| Mode SS | |||
|---|---|---|---|
| Quadrant | BADHDUFLAG | Total packets | Discarded packets |
| A | 0 | 40 | 0 |
| B | 0 | 40 | 0 |
| C | 0 | 40 | 0 |
| D | 0 | 40 | 0 |
| Mode M0 | |||
|---|---|---|---|
| Quadrant | BADHDUFLAG | Total packets | Discarded packets |
| A | 0 | 4084 | 1 |
| B | 0 | 4086 | 1 |
| C | 0 | 4140 | 1 |
| D | 0 | 4861 | 1 |
| Mode M9 | |||
|---|---|---|---|
| Quadrant | BADHDUFLAG | Total packets | Discarded packets |
| A | 0 | 1 | 0 |
| B | 0 | 1 | 0 |
| C | 0 | 1 | 0 |
| D | 0 | 1 | 0 |
| Quadrant | Total seconds | Saturated seconds | Saturation percentage |
|---|---|---|---|
| A | 1890 | 183 | 9.682540% |
| B | 1890 | 207 | 10.952381% |
| C | 1890 | 219 | 11.587302% |
| D | 1890 | 192 | 10.158730% |
Noise dominated data is calculated using 1-second bins in cleaned event files. If a bin has >2000 counts, and if more than 50% of those come from <1% of pixels, then it is considered to be noise-dominated and hence unusable.
| Quadrant | # 1 sec bins | Bins with >0 counts | Bins with >2000 counts | High rate bins dominated by noise | Noise dominated (total time) | Noise dominated (detector-on time) | Marked lightcurve |
|---|---|---|---|---|---|---|---|
| A | 2025 | 1893 | 0 | 0 | 0.00% | 0.00% | 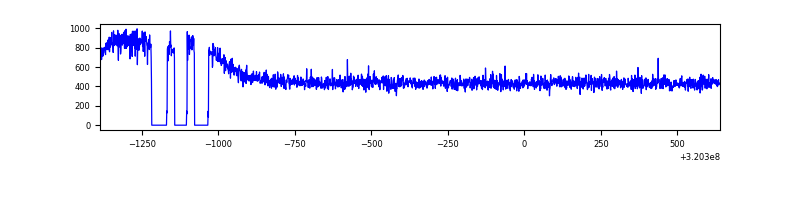 |
| B | 2025 | 1893 | 0 | 0 | 0.00% | 0.00% | 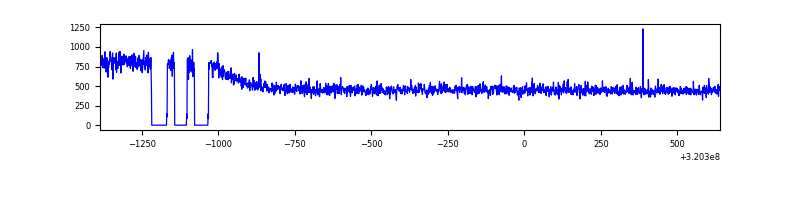 |
| C | 2025 | 1893 | 0 | 0 | 0.00% | 0.00% | 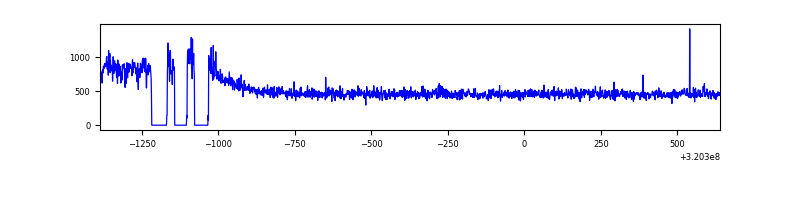 |
| D | 2025 | 1893 | 1 | 1 | 0.05% | 0.05% | 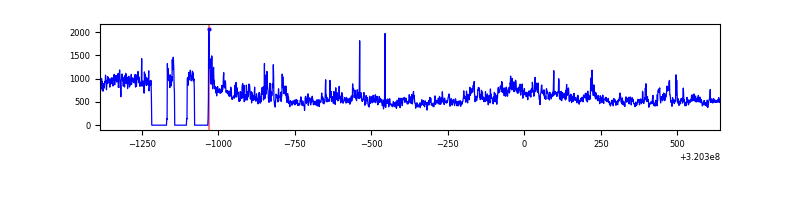 |
Top three noisy pixels from each quadrant. If the there are fewer than three noisy pixels in the level2.evt file, extra rows are filled as -1
| Pixel properties | Quadrant properties | ||||||
|---|---|---|---|---|---|---|---|
| Quadrant | DetID | PixID | Counts | Sigma | Mean | Median | Sigma |
| A | 13 | 254 | 3089 | 55.66 | 242 | 235 | 51.3 |
| A | 3 | 137 | 2404 | 42.3 | 242 | 235 | 51.3 |
| A | 0 | 226 | 2077 | 35.93 | 242 | 235 | 51.3 |
| B | 12 | 111 | 6024 | 115.52 | 243 | 235 | 50.1 |
| B | 11 | 111 | 5137 | 97.82 | 243 | 235 | 50.1 |
| B | 14 | 111 | 4674 | 88.58 | 243 | 235 | 50.1 |
| C | 14 | 238 | 36118 | 630.28 | 235 | 235 | 56.9 |
| C | 0 | 10 | 19641 | 340.86 | 235 | 235 | 56.9 |
| C | 8 | 128 | 3639 | 59.79 | 235 | 235 | 56.9 |
| D | 8 | 195 | 284198 | 4731.98 | 238 | 228 | 60.0 |
| D | 1 | 52 | 24729 | 408.28 | 238 | 228 | 60.0 |
| D | 2 | 234 | 6861 | 110.53 | 238 | 228 | 60.0 |
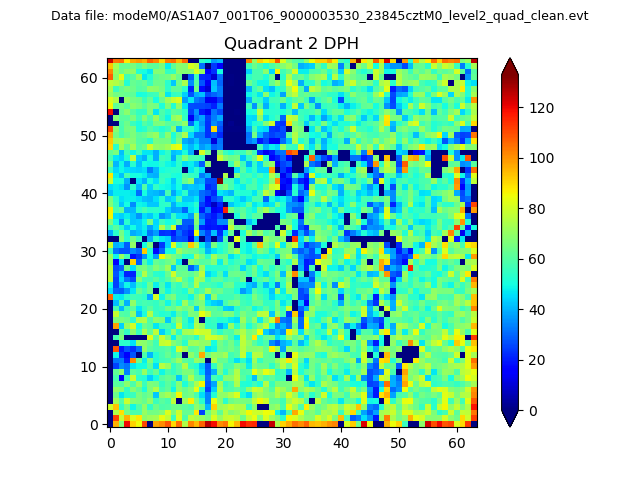
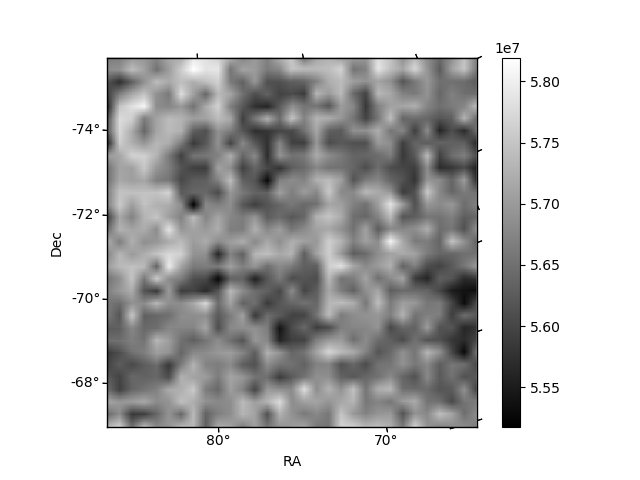
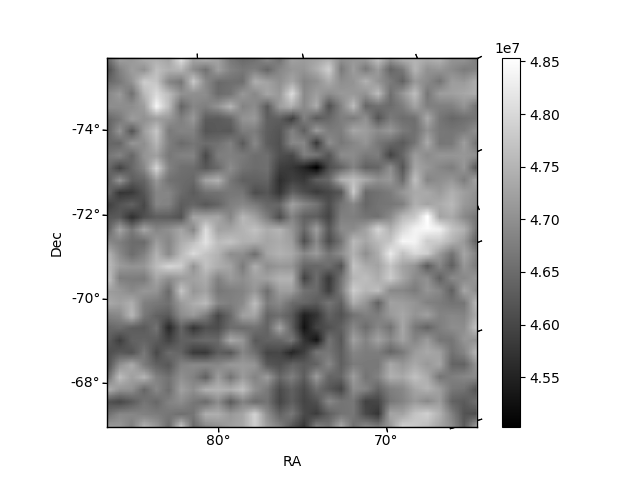
Histogram calculated using DETX and DETY for each event in the final _common_clean file
| Quadrant A | 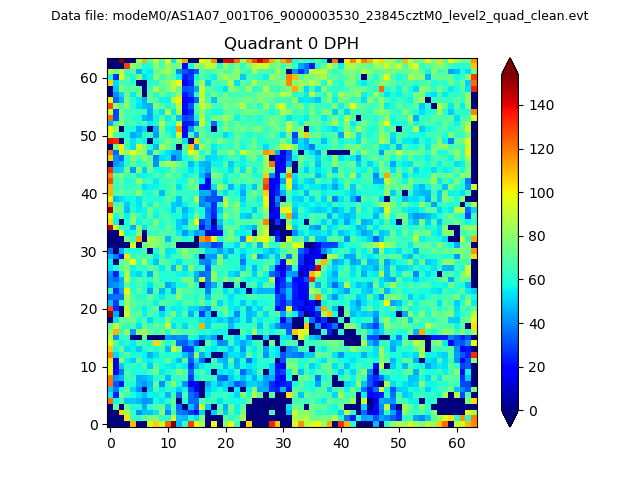 |
 |
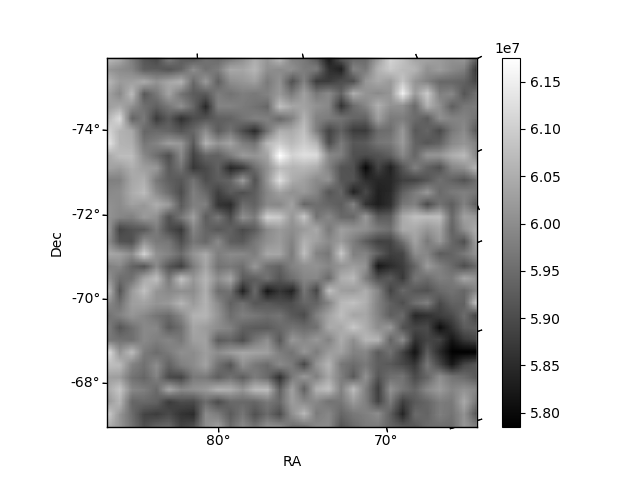
Quadrant B |
|---|---|---|---|
| Quadrant D |  |
 |
Quadrant C |
| Plot type | Count rate plots | Images |
|---|---|---|
| Comparison with Poisson distribution Blue bars denote a histogram of data divided into 1 sec bins. Red curve is a Poisson curve with rate = median count rate of data. |
 |
 |
| Quadrant-wise count rates Data is divided into 100 sec bins |
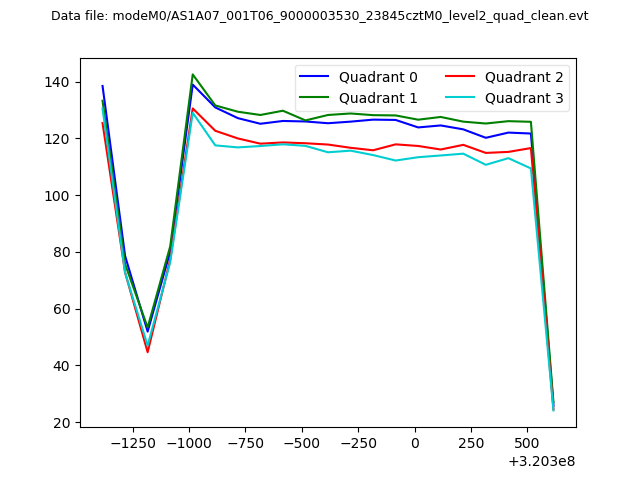 |
|
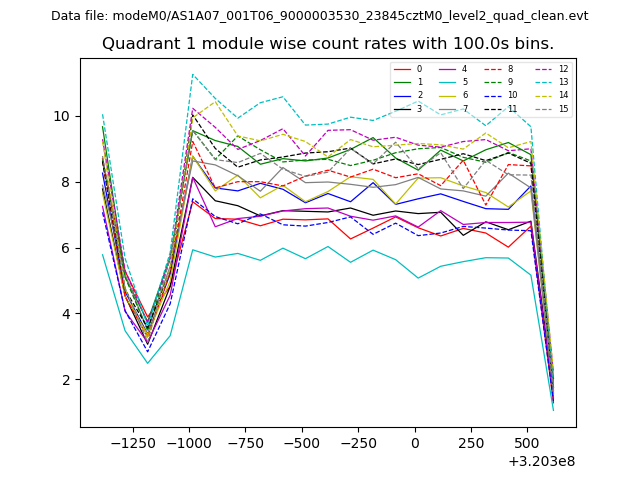
| Module-wise count rates for Quadrant A Data is divided into 100 sec bins |
 |
 |
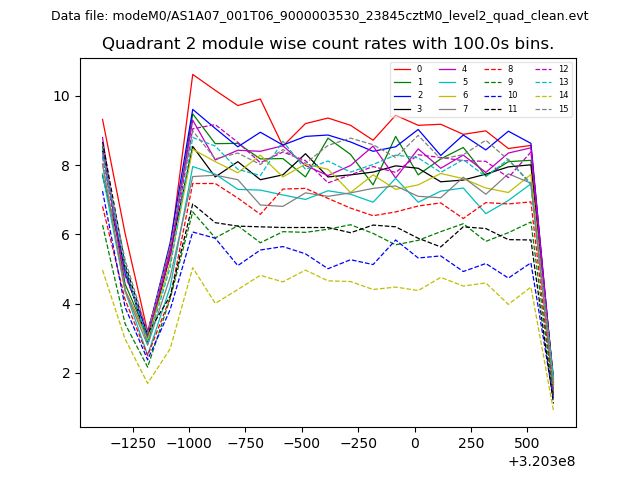
| Module-wise count rates for Quadrant B Data is divided into 100 sec bins |
 |
 |
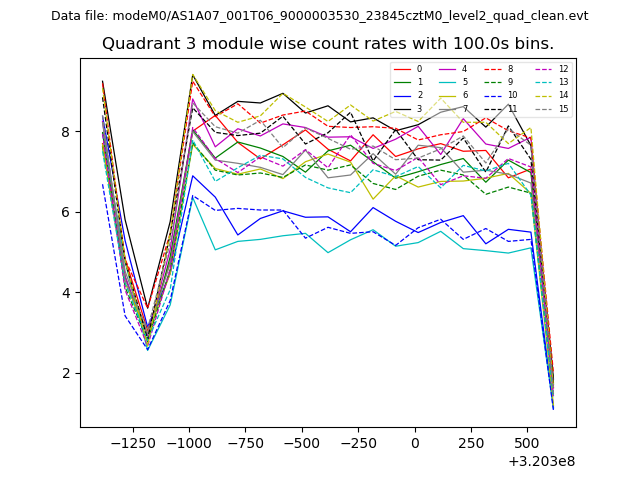
| Module-wise count rates for Quadrant C Data is divided into 100 sec bins |
 |
 |
| Module-wise count rates for Quadrant D Data is divided into 100 sec bins |
 |
 |
| Parameter | Plot |
|---|---|
| CZT HV Monitor | 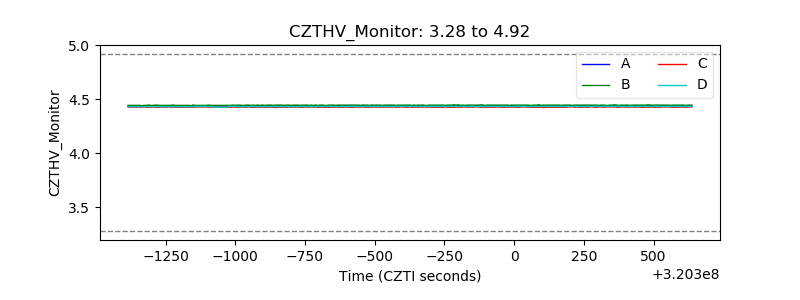 |
| D_VDD | 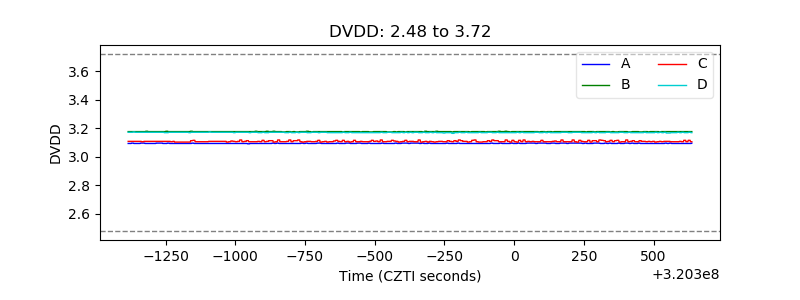 |
| Temperature 1 | 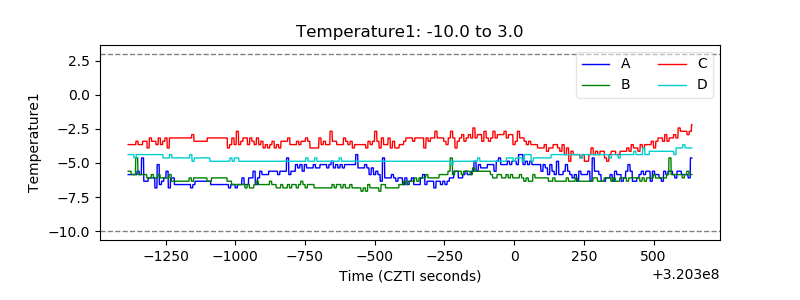 |
| Veto HV Monitor | 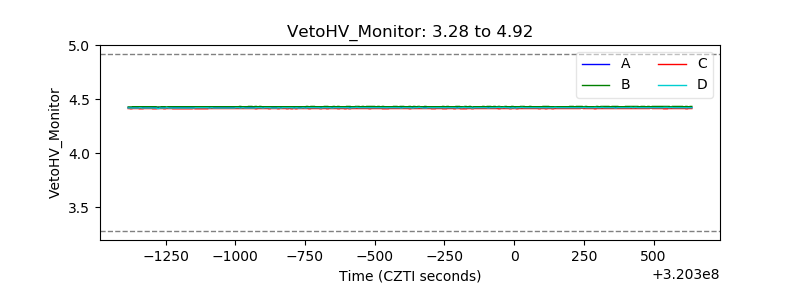 |
| Veto LLD | 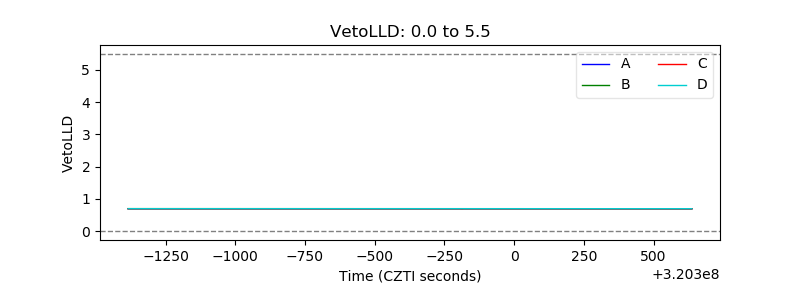 |
| Alpha Counter | 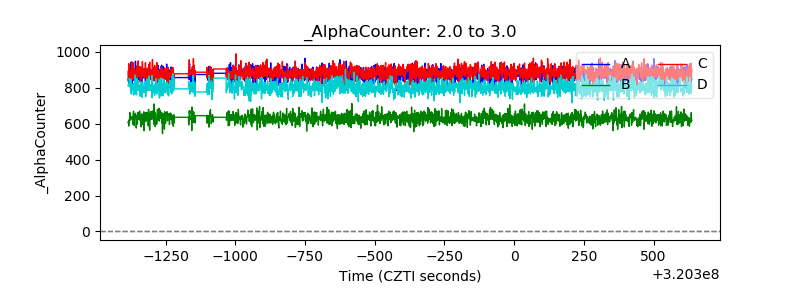 |
| _CPM_Rate | 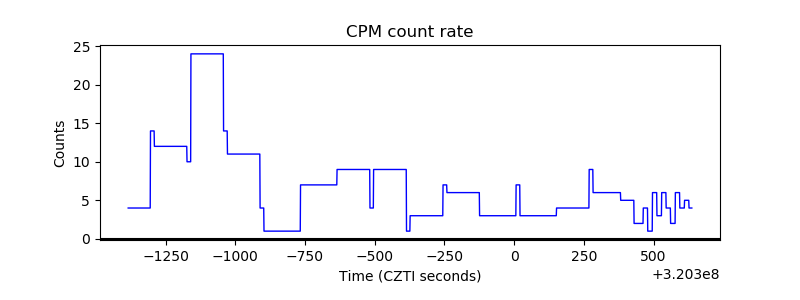 |
| CZT Counter | 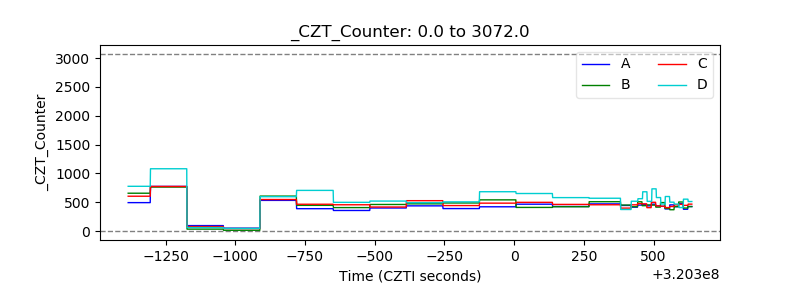 |
| +2.5 Volts monitor | 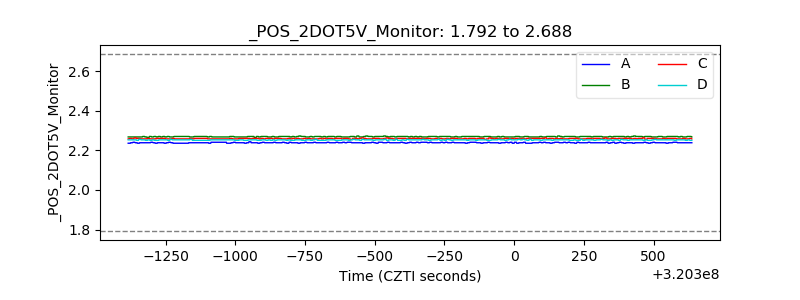 |
| +5 Volts monitor | 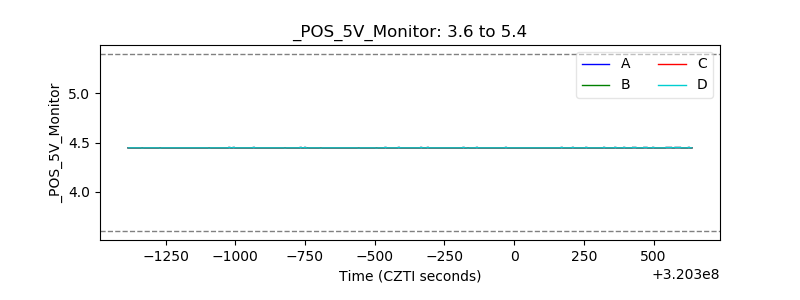 |
| _ROLL_ROT | 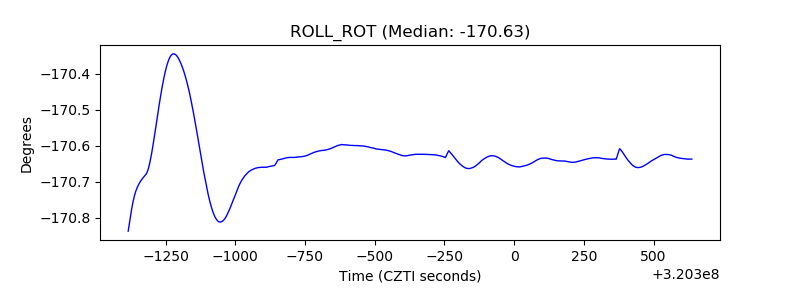 |
| _Roll_DEC | 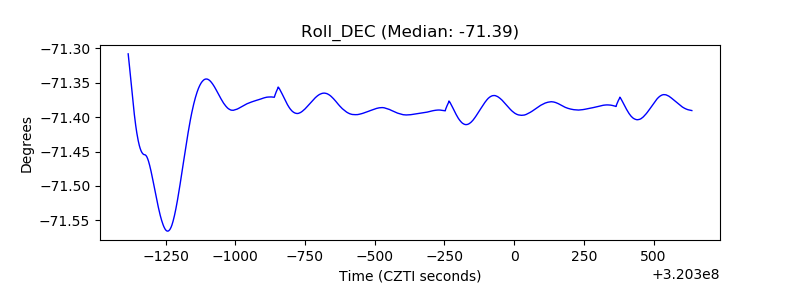 |
| _Roll_RA | 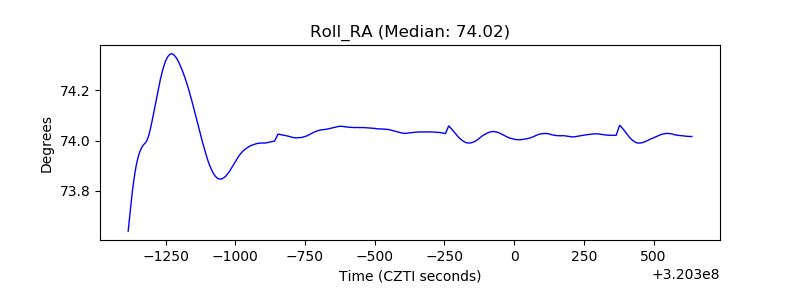 |
| Veto Counter | 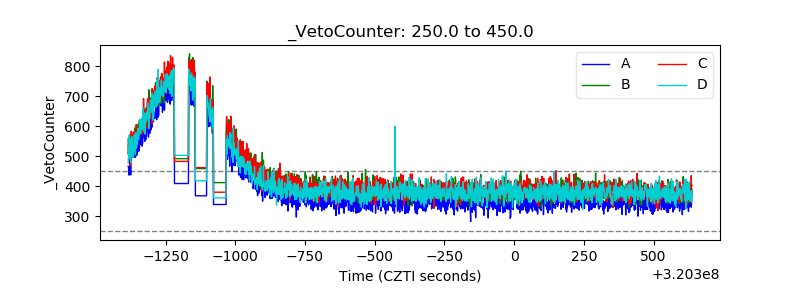 |