| Param | Original file | Final file |
|---|---|---|
| Filename | modeM0/AS1A07_001T06_9000003530_23852cztM0_level2.evt | modeM0/AS1A07_001T06_9000003530_23852cztM0_level2_quad_clean.evt |
| Size (bytes) | 596,770,560 | 169,188,480 |
| Size | 569.1 MB | 161.4 MB |
| Events in quadrant A | 4,127,306 | 1,135,580 |
| Events in quadrant B | 4,212,680 | 1,154,023 |
| Events in quadrant C | 4,437,929 | 1,109,929 |
| Events in quadrant D | 4,671,987 | 1,088,190 |
| Mode SS | |||
|---|---|---|---|
| Quadrant | BADHDUFLAG | Total packets | Discarded packets |
| A | 0 | 186 | 0 |
| B | 0 | 186 | 0 |
| C | 0 | 186 | 0 |
| D | 0 | 186 | 0 |
| Mode M0 | |||
|---|---|---|---|
| Quadrant | BADHDUFLAG | Total packets | Discarded packets |
| A | 0 | 18529 | 1 |
| B | 0 | 18591 | 1 |
| C | 0 | 19361 | 1 |
| D | 0 | 19850 | 1 |
| Mode M9 | |||
|---|---|---|---|
| Quadrant | BADHDUFLAG | Total packets | Discarded packets |
| A | 0 | 6 | 0 |
| B | 0 | 6 | 0 |
| C | 0 | 6 | 0 |
| D | 0 | 6 | 0 |
| Quadrant | Total seconds | Saturated seconds | Saturation percentage |
|---|---|---|---|
| A | 9182 | 57 | 0.620780% |
| B | 9183 | 73 | 0.794947% |
| C | 9183 | 155 | 1.687902% |
| D | 9183 | 80 | 0.871175% |
Noise dominated data is calculated using 1-second bins in cleaned event files. If a bin has >2000 counts, and if more than 50% of those come from <1% of pixels, then it is considered to be noise-dominated and hence unusable.
| Quadrant | # 1 sec bins | Bins with >0 counts | Bins with >2000 counts | High rate bins dominated by noise | Noise dominated (total time) | Noise dominated (detector-on time) | Marked lightcurve |
|---|---|---|---|---|---|---|---|
| A | 9767 | 9183 | 0 | 0 | 0.00% | 0.00% | 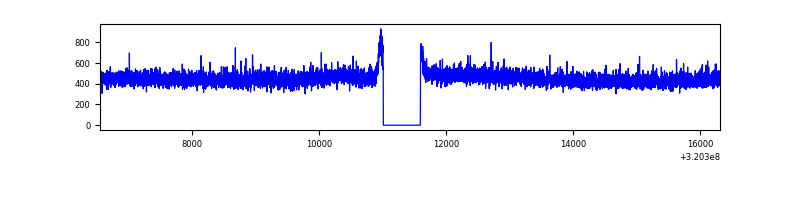 |
| B | 9768 | 9184 | 0 | 0 | 0.00% | 0.00% | 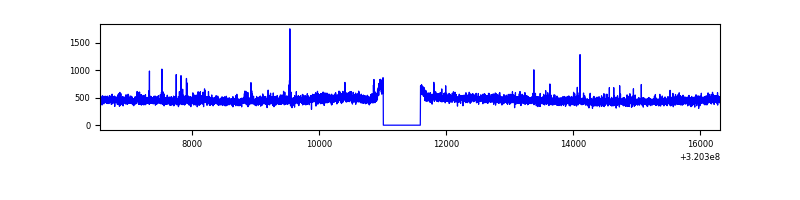 |
| C | 9768 | 9184 | 26 | 26 | 0.27% | 0.28% | 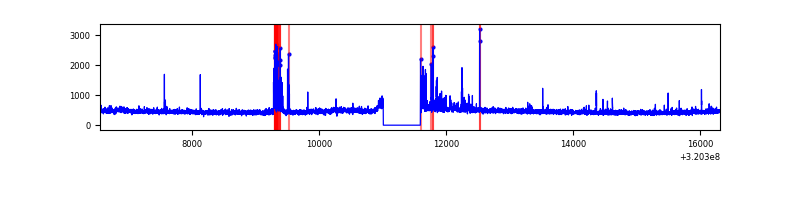 |
| D | 9768 | 9184 | 28 | 28 | 0.29% | 0.30% | 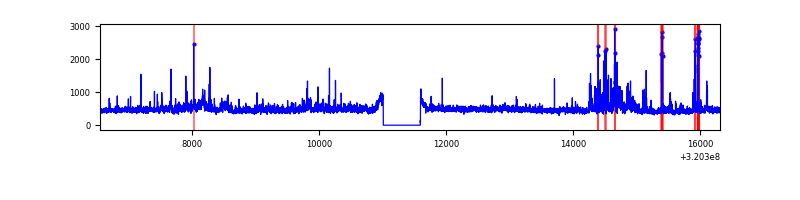 |
Top three noisy pixels from each quadrant. If the there are fewer than three noisy pixels in the level2.evt file, extra rows are filled as -1
| Pixel properties | Quadrant properties | ||||||
|---|---|---|---|---|---|---|---|
| Quadrant | DetID | PixID | Counts | Sigma | Mean | Median | Sigma |
| A | 13 | 254 | 15514 | 67.45 | 1068 | 1044 | 214.5 |
| A | 3 | 137 | 9408 | 38.99 | 1068 | 1044 | 214.5 |
| A | 0 | 226 | 9338 | 38.66 | 1068 | 1044 | 214.5 |
| B | 12 | 111 | 24240 | 115.32 | 1062 | 1036 | 201.2 |
| B | 11 | 111 | 21630 | 102.35 | 1062 | 1036 | 201.2 |
| B | 14 | 111 | 18104 | 84.82 | 1062 | 1036 | 201.2 |
| C | 0 | 10 | 260436 | 1097.95 | 1018 | 1024 | 236.3 |
| C | 14 | 238 | 161441 | 678.96 | 1018 | 1024 | 236.3 |
| C | 2 | 16 | 25163 | 102.17 | 1018 | 1024 | 236.3 |
| D | 1 | 52 | 391444 | 1540.64 | 1038 | 1008 | 253.4 |
| D | 8 | 195 | 213123 | 836.99 | 1038 | 1008 | 253.4 |
| D | 12 | 233 | 70519 | 274.29 | 1038 | 1008 | 253.4 |
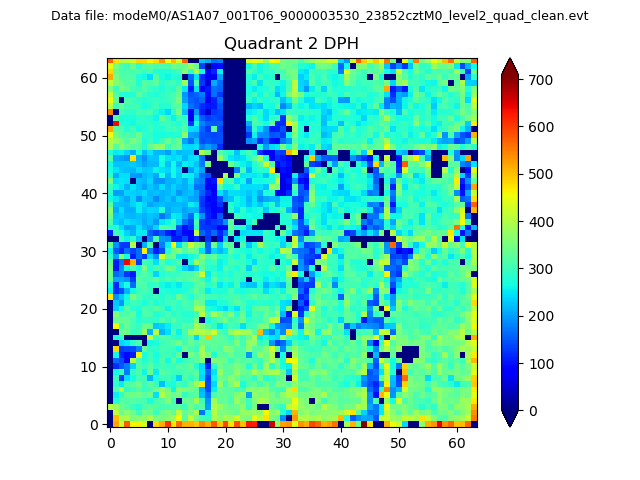
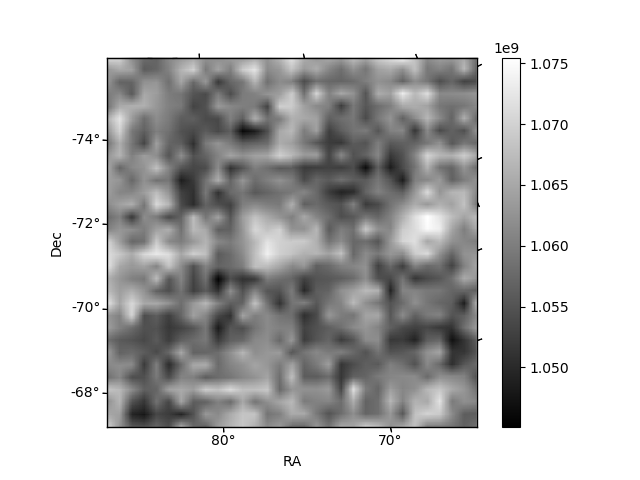
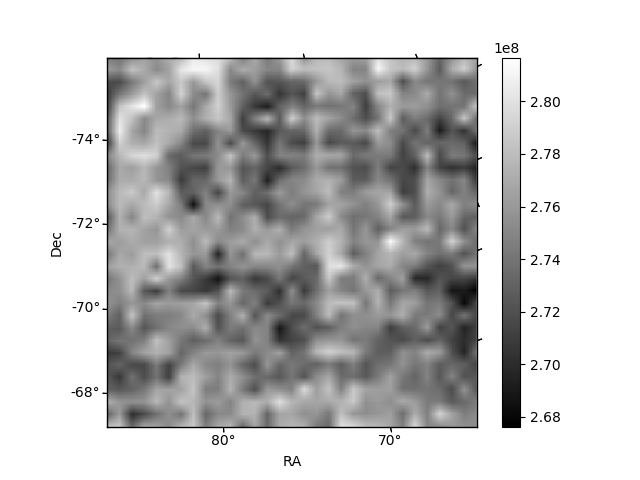
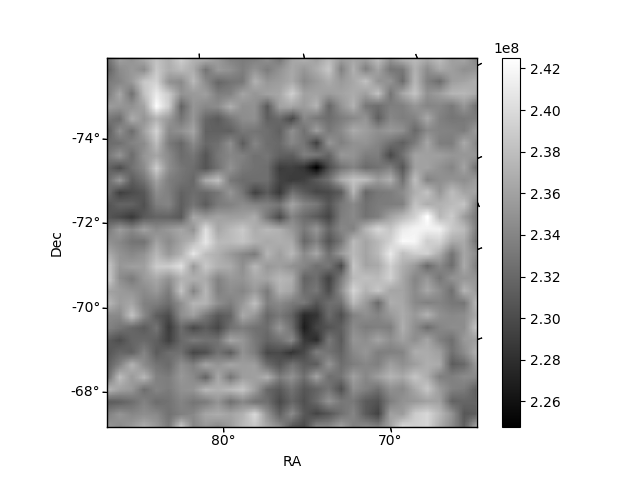
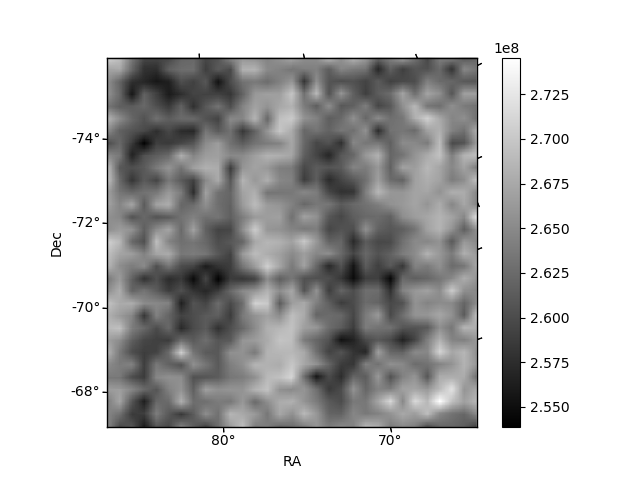
Histogram calculated using DETX and DETY for each event in the final _common_clean file
| Quadrant A | 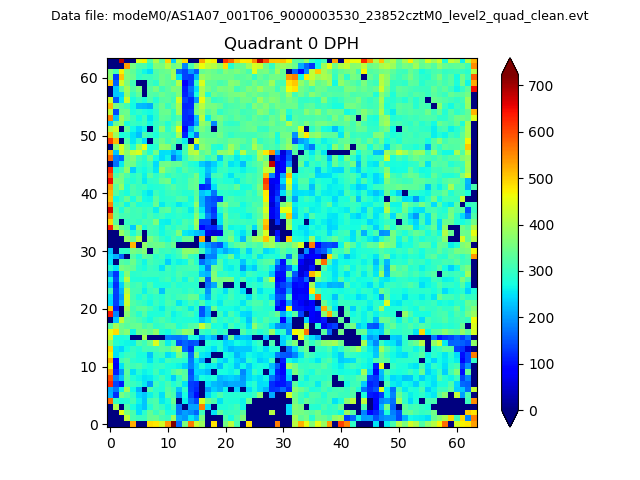 |
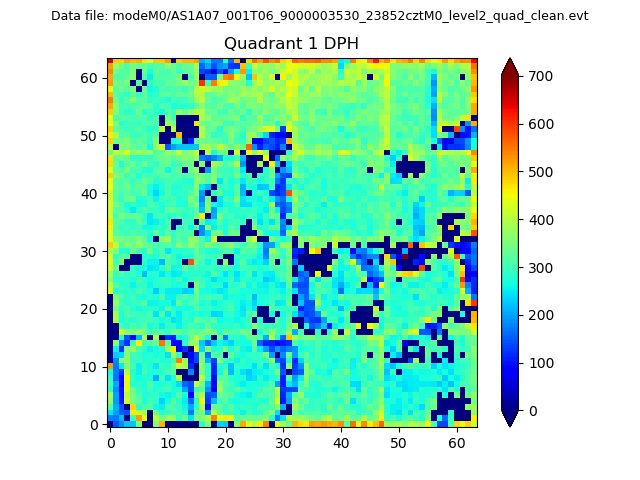 |
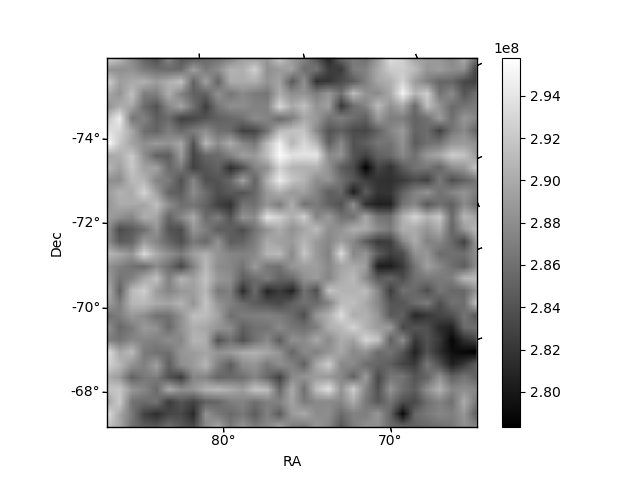
Quadrant B |
|---|---|---|---|
| Quadrant D | 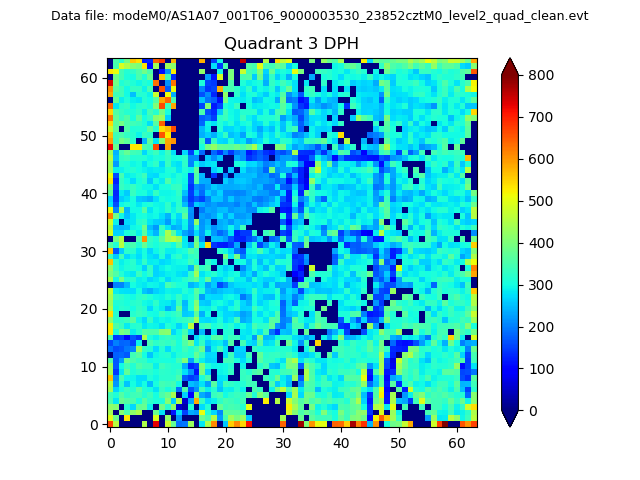 |
 |
Quadrant C |
| Plot type | Count rate plots | Images |
|---|---|---|
| Comparison with Poisson distribution Blue bars denote a histogram of data divided into 1 sec bins. Red curve is a Poisson curve with rate = median count rate of data. |
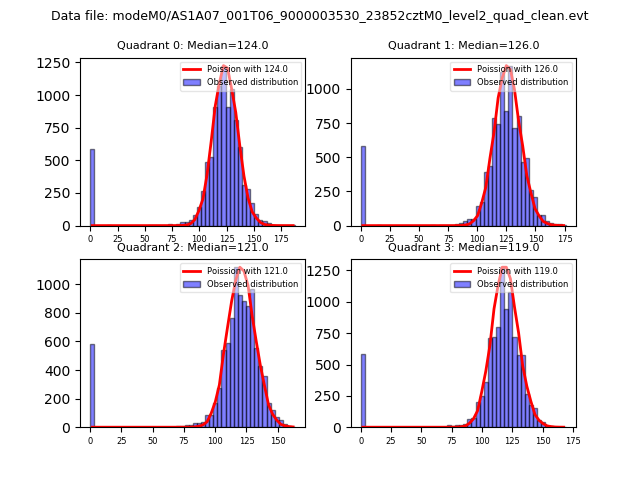 |
 |
| Quadrant-wise count rates Data is divided into 100 sec bins |
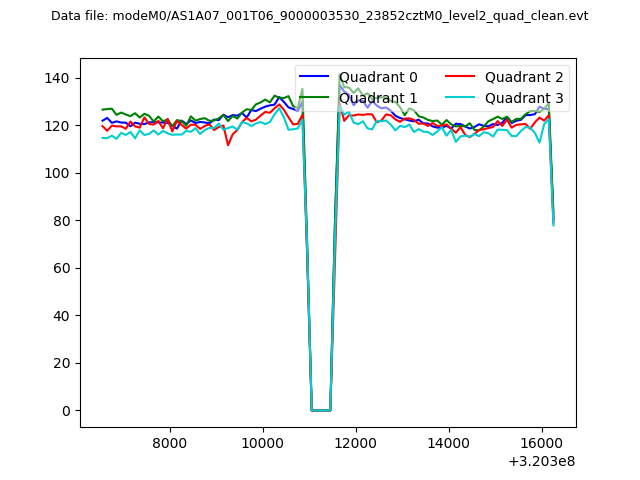 |
|
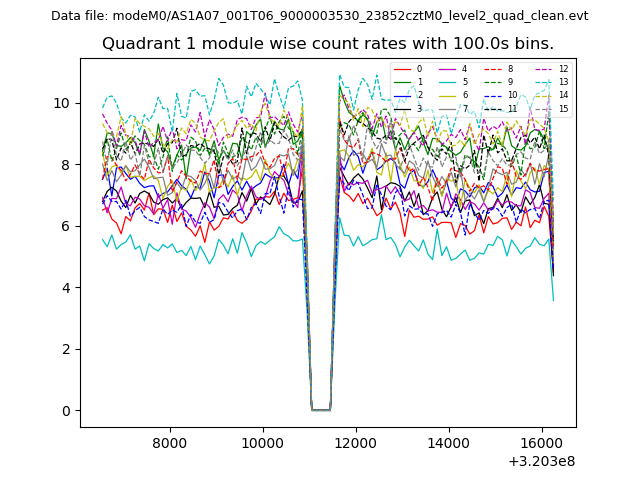
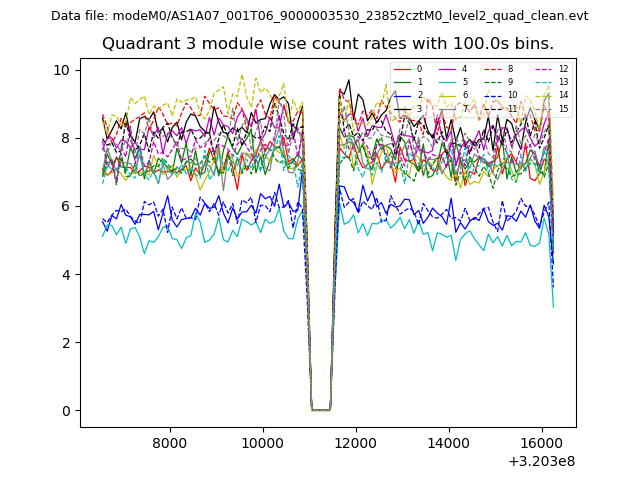
| Module-wise count rates for Quadrant A Data is divided into 100 sec bins |
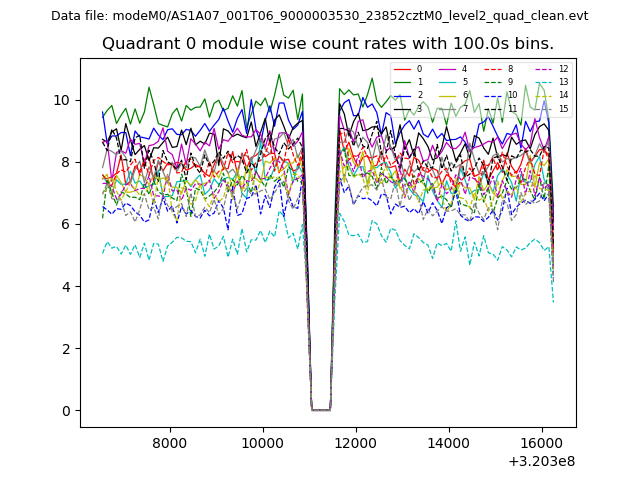 |
 |
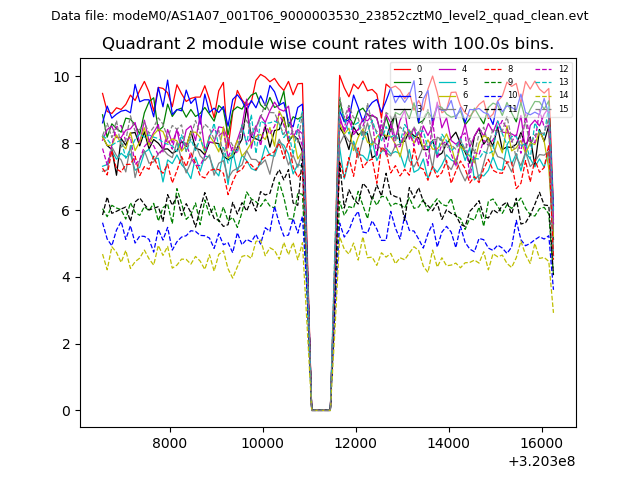
| Module-wise count rates for Quadrant B Data is divided into 100 sec bins |
 |
 |
| Module-wise count rates for Quadrant C Data is divided into 100 sec bins |
 |
 |
| Module-wise count rates for Quadrant D Data is divided into 100 sec bins |
 |
 |
| Parameter | Plot |
|---|---|
| CZT HV Monitor | 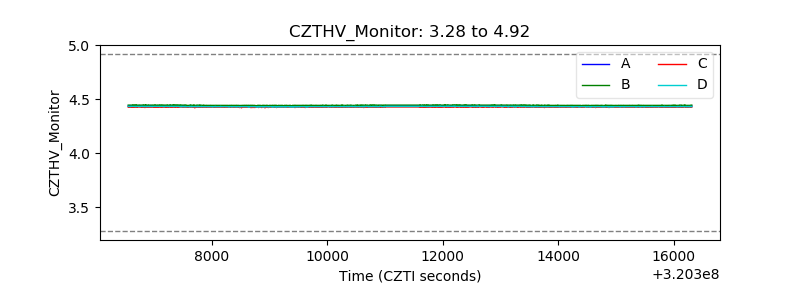 |
| D_VDD | 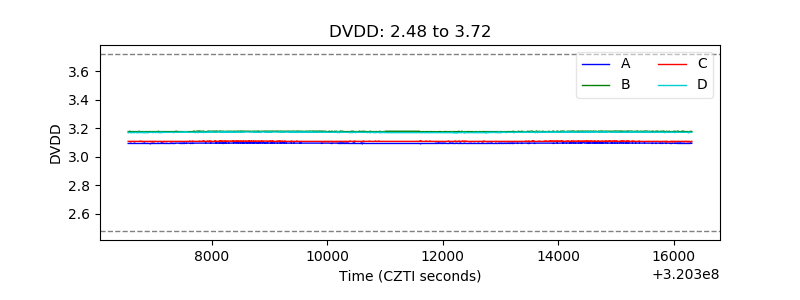 |
| Temperature 1 |  |
| Veto HV Monitor | 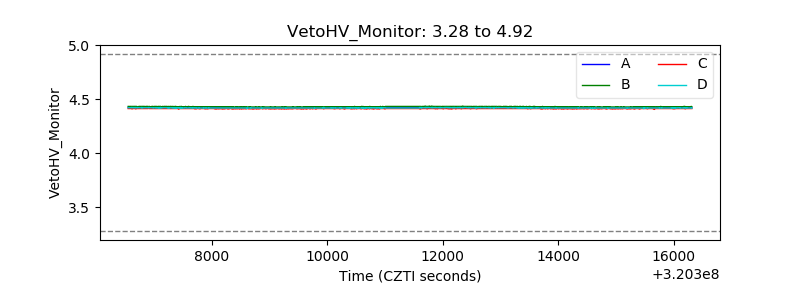 |
| Veto LLD | 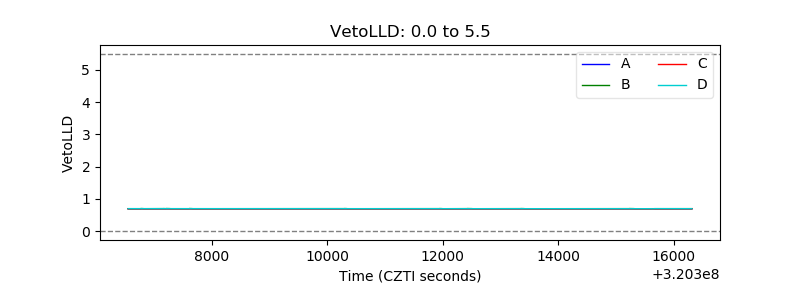 |
| Alpha Counter | 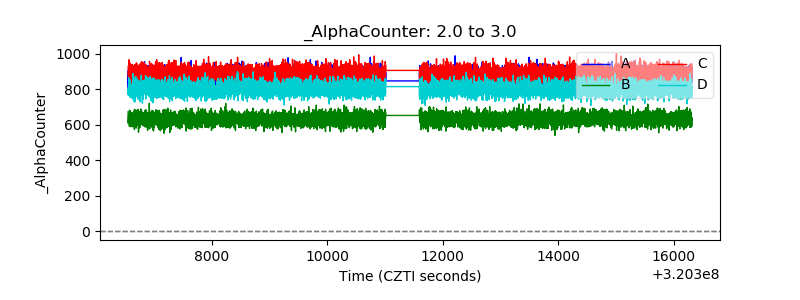 |
| _CPM_Rate | 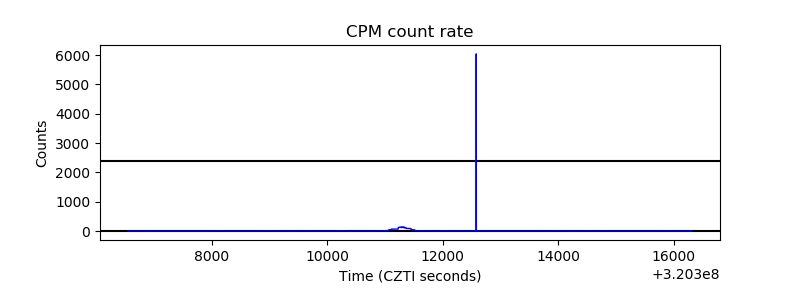 |
| CZT Counter | 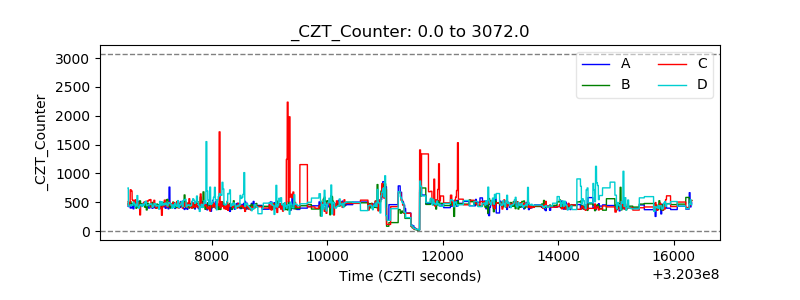 |
| +2.5 Volts monitor |  |
| +5 Volts monitor |  |
| _ROLL_ROT | 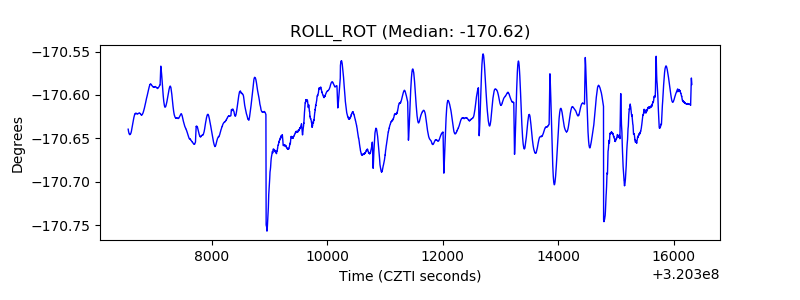 |
| _Roll_DEC | 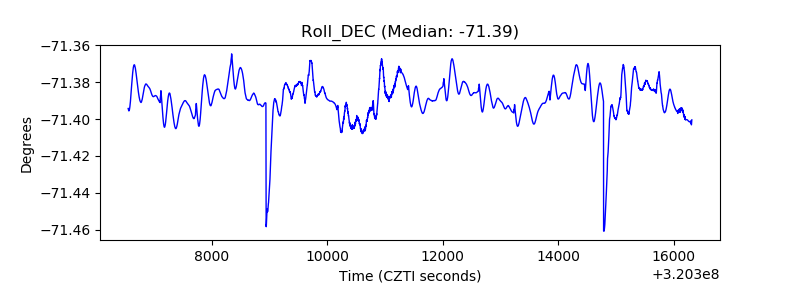 |
| _Roll_RA | 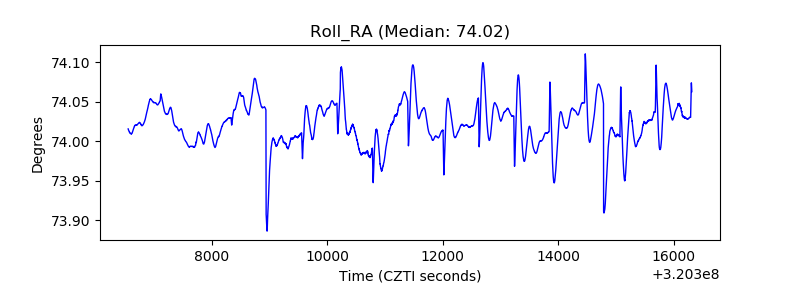 |
| Veto Counter | 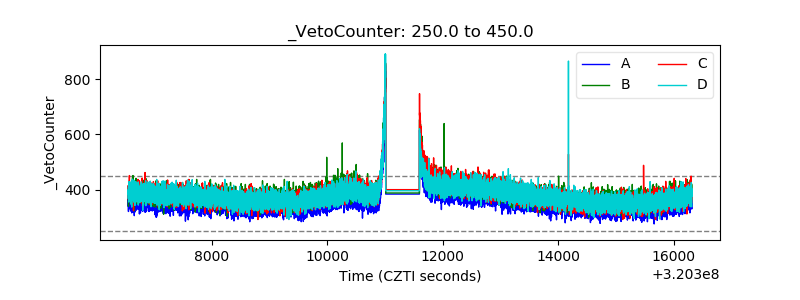 |