| Param | Original file | Final file |
|---|---|---|
| Filename | modeM0/AS1A07_091T10_9000003532cztM0_level2.fits | modeM0/AS1A07_091T10_9000003532cztM0_level2_quad_clean.evt |
| Size (bytes) | 134,282,880 | 103,481,280 |
| Size | 128.1 MB | 98.7 MB |
| Events in quadrant A | 830,786 | 580,204 |
| Events in quadrant B | 794,838 | 578,997 |
| Events in quadrant C | 817,812 | 552,998 |
| Events in quadrant D | 718,368 | 515,384 |
| Mode M9 | |||
|---|---|---|---|
| Quadrant | BADHDUFLAG | Total packets | Discarded packets |
| A | 0 | 24 | 0 |
| B | 0 | 24 | 0 |
| C | 0 | 24 | 0 |
| D | 0 | 24 | 0 |
| Mode M0 | |||
|---|---|---|---|
| Quadrant | BADHDUFLAG | Total packets | Discarded packets |
| A | 0 | 27449 | 0 |
| B | 0 | 27754 | 0 |
| C | 0 | 28256 | 0 |
| D | 0 | 29450 | 0 |
| Mode SS | |||
|---|---|---|---|
| Quadrant | BADHDUFLAG | Total packets | Discarded packets |
| A | 0 | 266 | 0 |
| B | 0 | 266 | 0 |
| C | 0 | 266 | 0 |
| D | 0 | 266 | 0 |
| Quadrant | Total seconds | Saturated seconds | Saturation percentage |
|---|---|---|---|
| A | 13104 | 68 | 0.518926% |
| B | 13104 | 92 | 0.702076% |
| C | 13104 | 164 | 1.251526% |
| D | 13104 | 116 | 0.885226% |
Noise dominated data is calculated using 1-second bins in cleaned event files. If a bin has >2000 counts, and if more than 50% of those come from <1% of pixels, then it is considered to be noise-dominated and hence unusable.
| Quadrant | # 1 sec bins | Bins with >0 counts | Bins with >2000 counts | High rate bins dominated by noise | Noise dominated (total time) | Noise dominated (detector-on time) | Marked lightcurve |
|---|---|---|---|---|---|---|---|
| A | 15228 | 13103 | 0 | 0 | 0.00% | 0.00% | 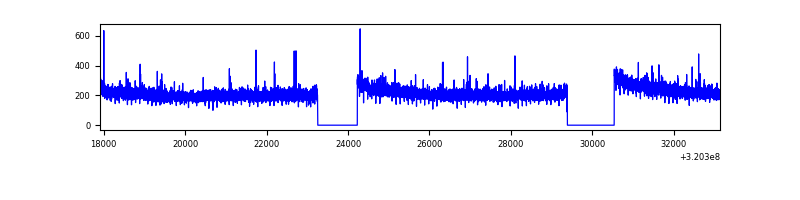 |
| B | 15228 | 13103 | 0 | 0 | 0.00% | 0.00% | 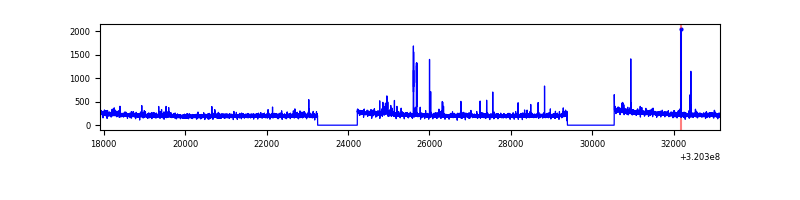 |
| C | 15228 | 13103 | 0 | 0 | 0.00% | 0.00% |  |
| D | 15228 | 13103 | 0 | 0 | 0.00% | 0.00% | 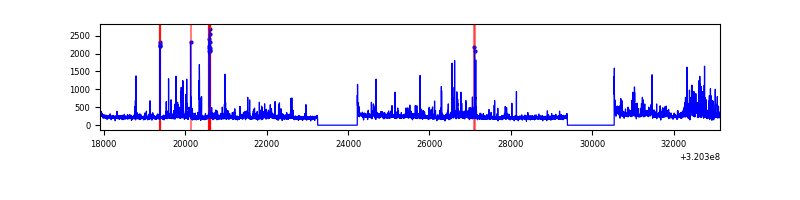 |
Top three noisy pixels from each quadrant. If the there are fewer than three noisy pixels in the level2.evt file, extra rows are filled as -1
| Pixel properties | Quadrant properties | ||||||
|---|---|---|---|---|---|---|---|
| Quadrant | DetID | PixID | Counts | Sigma | Mean | Median | Sigma |
| A | 0 | 29 | 823 | 11.35 | 216 | 203 | 54.6 |
| A | 7 | 110 | 664 | 8.44 | 216 | 203 | 54.6 |
| A | 0 | 30 | 646 | 8.11 | 216 | 203 | 54.6 |
| B | 2 | 9 | 670 | 10.56 | 210 | 201 | 44.4 |
| B | 2 | 8 | 547 | 7.79 | 210 | 201 | 44.4 |
| B | 3 | 80 | 527 | 7.34 | 210 | 201 | 44.4 |
| C | 9 | 209 | 602 | 7.03 | 216 | 203 | 56.7 |
| C | 12 | 241 | 583 | 6.7 | 216 | 203 | 56.7 |
| C | 3 | 234 | 578 | 6.61 | 216 | 203 | 56.7 |
| D | 3 | 14 | 520 | 5.94 | 205 | 187 | 56.0 |
| D | 6 | 231 | 518 | 5.91 | 205 | 187 | 56.0 |
| D | 4 | 160 | 505 | 5.68 | 205 | 187 | 56.0 |
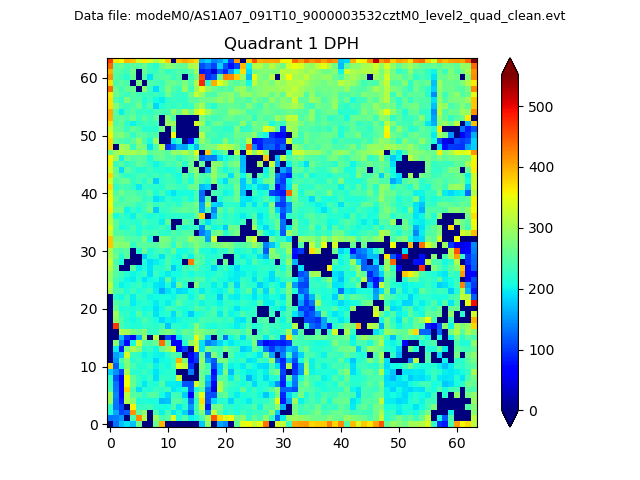
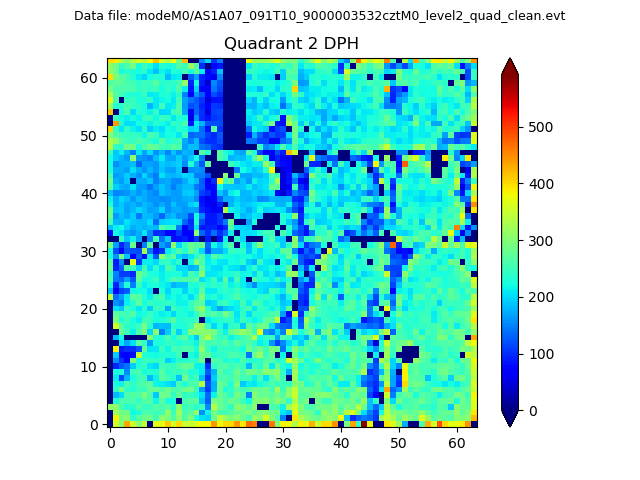
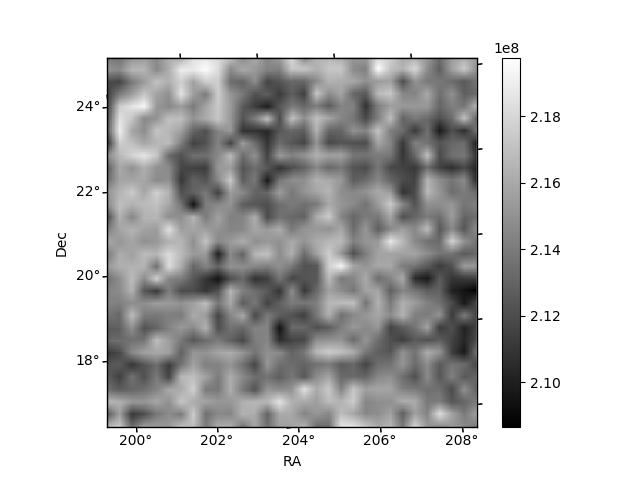
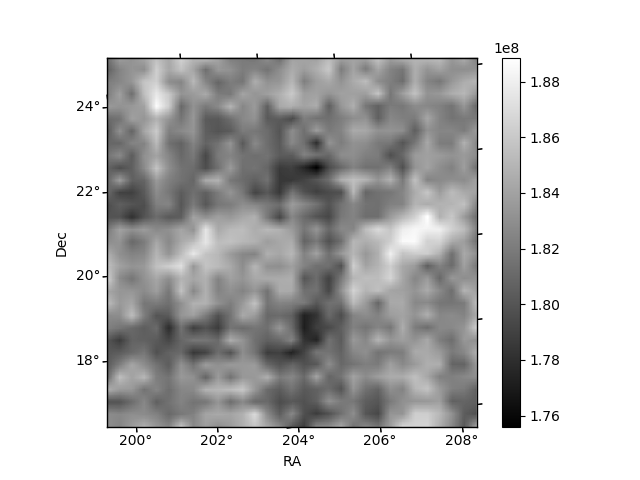
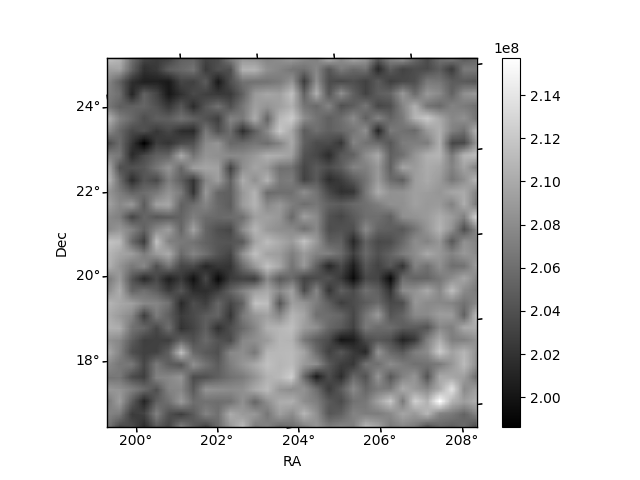
Histogram calculated using DETX and DETY for each event in the final _common_clean file
| Quadrant A | 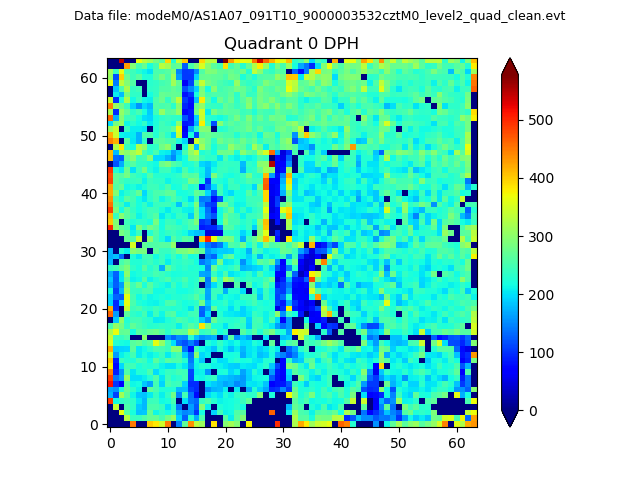 |
 |
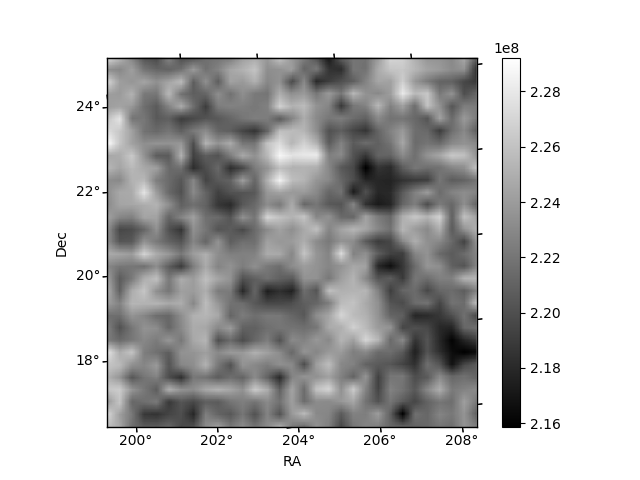
Quadrant B |
|---|---|---|---|
| Quadrant D | 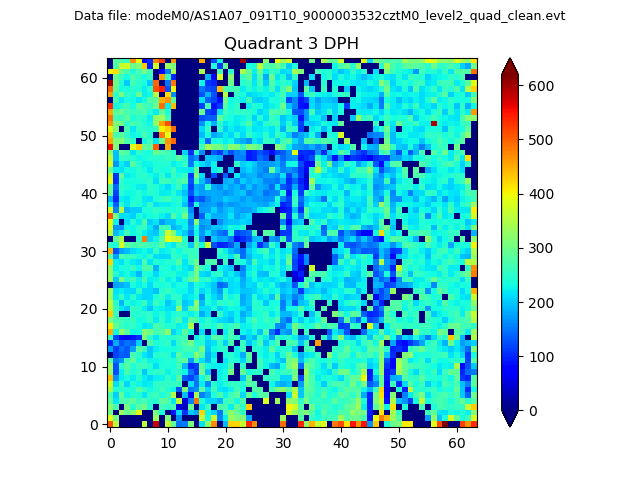 |
 |
Quadrant C |
| Plot type | Count rate plots | Images |
|---|---|---|
| Comparison with Poisson distribution Blue bars denote a histogram of data divided into 1 sec bins. Red curve is a Poisson curve with rate = median count rate of data. |
 |
 |
| Quadrant-wise count rates Data is divided into 100 sec bins |
 |
|
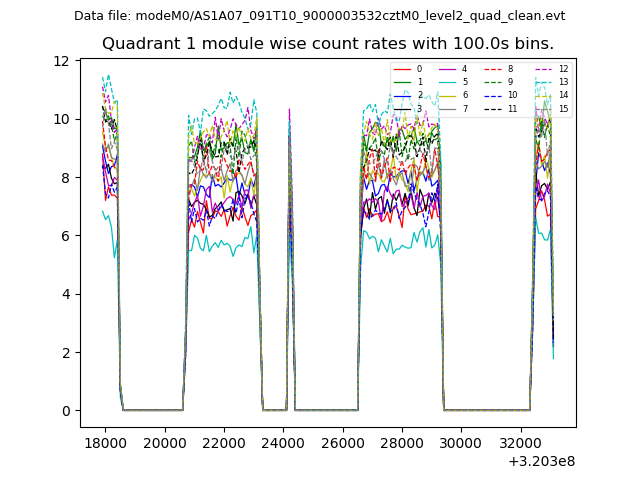
| Module-wise count rates for Quadrant A Data is divided into 100 sec bins |
 |
 |
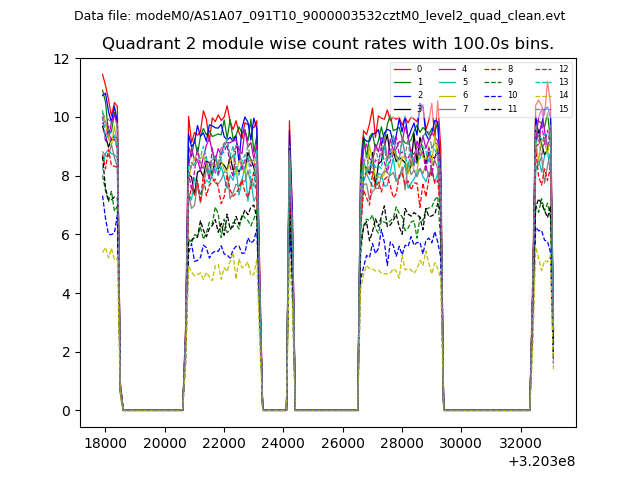
| Module-wise count rates for Quadrant B Data is divided into 100 sec bins |
 |
 |
| Module-wise count rates for Quadrant C Data is divided into 100 sec bins |
 |
 |
| Module-wise count rates for Quadrant D Data is divided into 100 sec bins |
 |
 |
| Parameter | Plot |
|---|---|
| CZT HV Monitor | 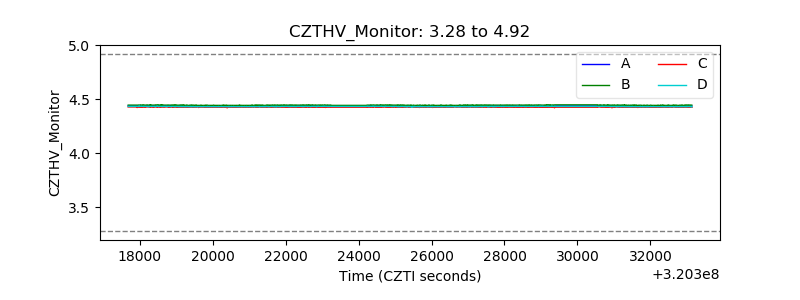 |
| D_VDD | 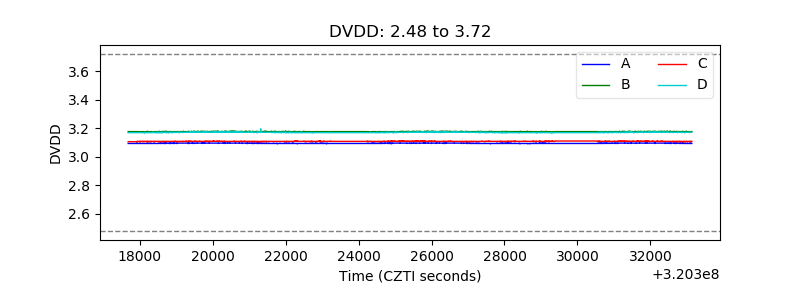 |
| Temperature 1 | 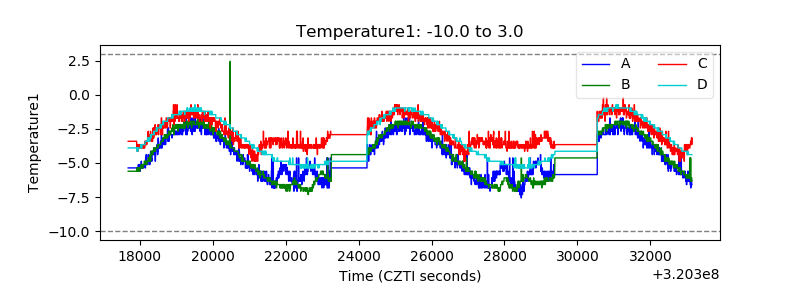 |
| Veto HV Monitor | 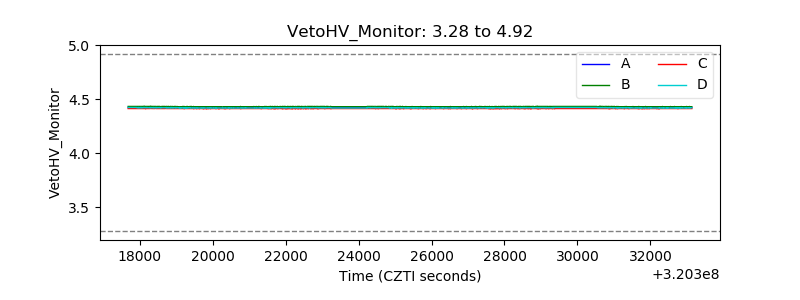 |
| Veto LLD | 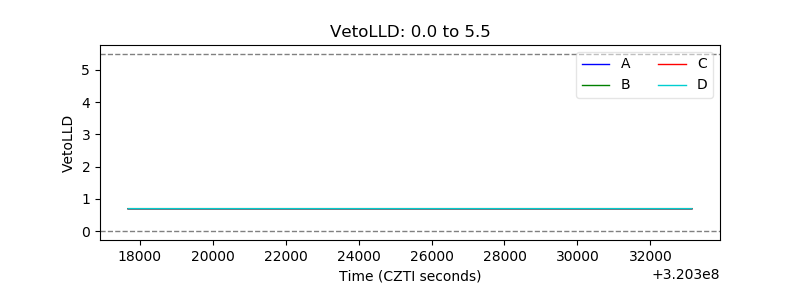 |
| Alpha Counter | 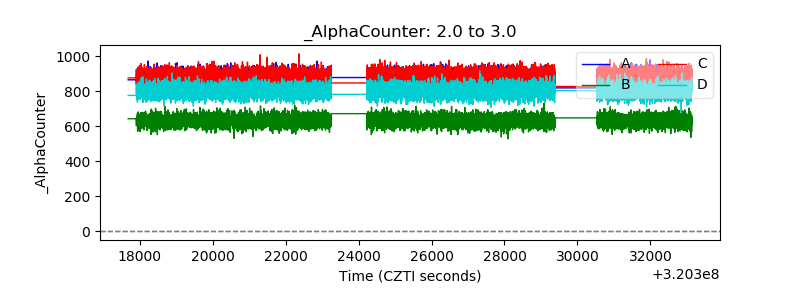 |
| _CPM_Rate |  |
| CZT Counter |  |
| +2.5 Volts monitor | 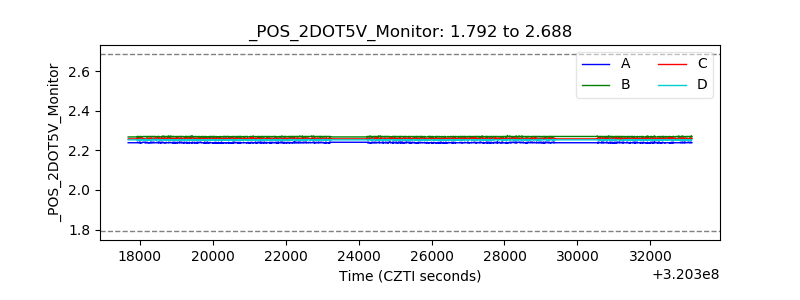 |
| +5 Volts monitor | 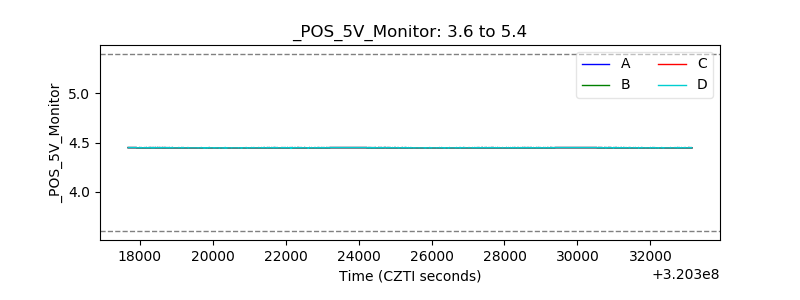 |
| _ROLL_ROT | 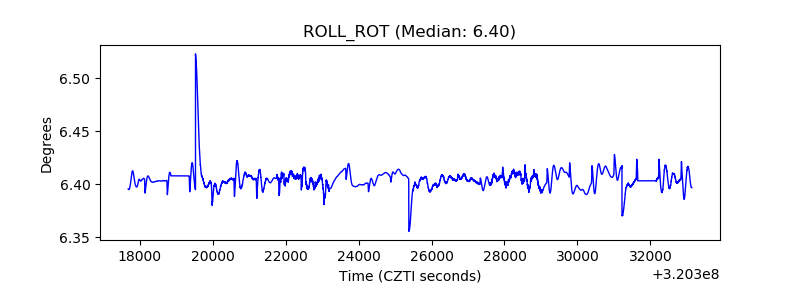 |
| _Roll_DEC | 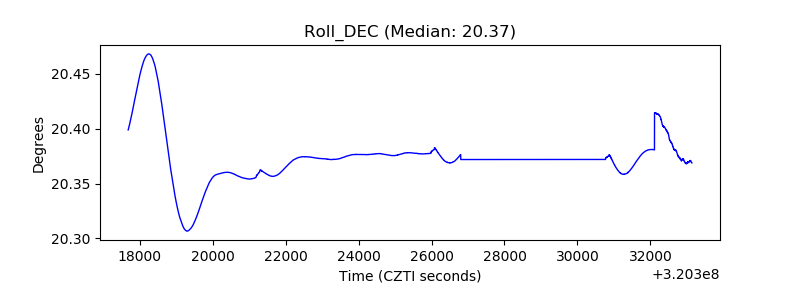 |
| _Roll_RA | 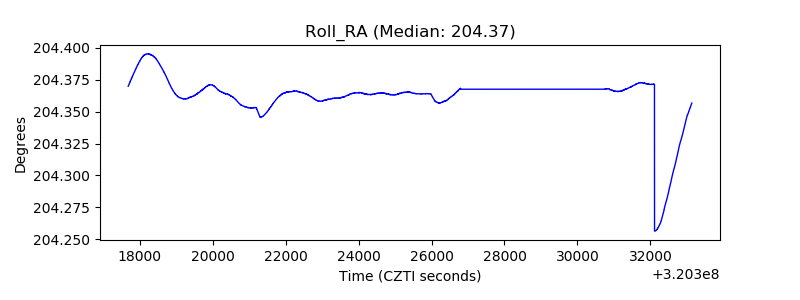 |
| Veto Counter |  |