| Param | Original file | Final file |
|---|---|---|
| Filename | modeM0/AS1A07_091T10_9000003532_23851cztM0_level2.evt | modeM0/AS1A07_091T10_9000003532_23851cztM0_level2_quad_clean.evt |
| Size (bytes) | 477,126,720 | 65,609,280 |
| Size | 455.0 MB | 62.6 MB |
| Events in quadrant A | 3,353,087 | 387,332 |
| Events in quadrant B | 3,449,694 | 391,053 |
| Events in quadrant C | 3,653,730 | 376,906 |
| Events in quadrant D | 3,547,885 | 373,547 |
| Mode M9 | |||
|---|---|---|---|
| Quadrant | BADHDUFLAG | Total packets | Discarded packets |
| A | 0 | 17 | 0 |
| B | 0 | 18 | 0 |
| C | 0 | 18 | 0 |
| D | 0 | 18 | 0 |
| Mode M0 | |||
|---|---|---|---|
| Quadrant | BADHDUFLAG | Total packets | Discarded packets |
| A | 0 | 14155 | 7 |
| B | 0 | 14401 | 4 |
| C | 0 | 14934 | 4 |
| D | 0 | 14877 | 8 |
| Mode SS | |||
|---|---|---|---|
| Quadrant | BADHDUFLAG | Total packets | Discarded packets |
| A | 0 | 134 | 0 |
| B | 0 | 134 | 0 |
| C | 0 | 134 | 0 |
| D | 0 | 134 | 0 |
| Quadrant | Total seconds | Saturated seconds | Saturation percentage |
|---|---|---|---|
| A | 6558 | 31 | 0.472705% |
| B | 6559 | 50 | 0.762311% |
| C | 6559 | 115 | 1.753316% |
| D | 6558 | 40 | 0.609942% |
Noise dominated data is calculated using 1-second bins in cleaned event files. If a bin has >2000 counts, and if more than 50% of those come from <1% of pixels, then it is considered to be noise-dominated and hence unusable.
| Quadrant | # 1 sec bins | Bins with >0 counts | Bins with >2000 counts | High rate bins dominated by noise | Noise dominated (total time) | Noise dominated (detector-on time) | Marked lightcurve |
|---|---|---|---|---|---|---|---|
| A | 7710 | 6561 | 0 | 0 | 0.00% | 0.00% | 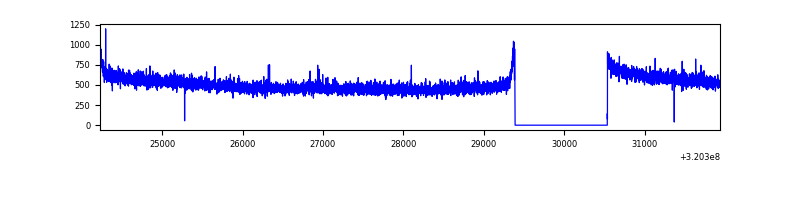 |
| B | 7710 | 6561 | 10 | 10 | 0.13% | 0.15% | 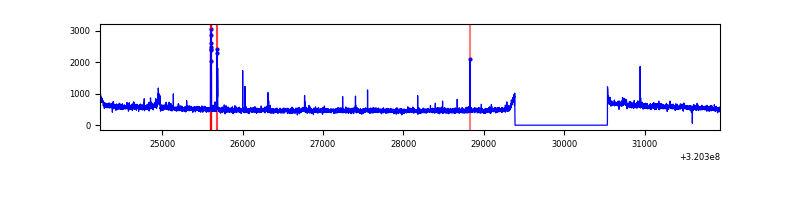 |
| C | 7710 | 6561 | 17 | 17 | 0.22% | 0.26% | 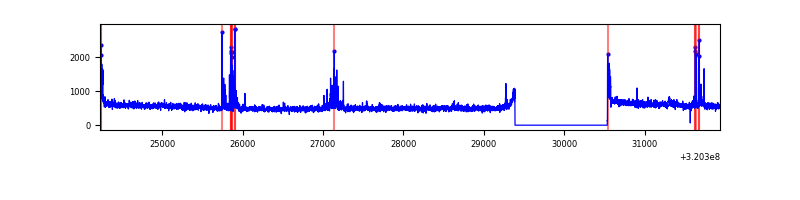 |
| D | 7710 | 6561 | 9 | 9 | 0.12% | 0.14% | 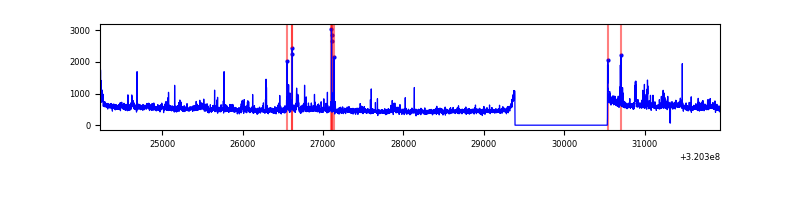 |
Top three noisy pixels from each quadrant. If the there are fewer than three noisy pixels in the level2.evt file, extra rows are filled as -1
| Pixel properties | Quadrant properties | ||||||
|---|---|---|---|---|---|---|---|
| Quadrant | DetID | PixID | Counts | Sigma | Mean | Median | Sigma |
| A | 13 | 254 | 10729 | 56.75 | 868 | 851 | 174.0 |
| A | 3 | 137 | 7499 | 38.2 | 868 | 851 | 174.0 |
| A | 0 | 226 | 7462 | 37.98 | 868 | 851 | 174.0 |
| B | 15 | 33 | 39261 | 236.87 | 857 | 835 | 162.2 |
| B | 0 | 189 | 30037 | 180.01 | 857 | 835 | 162.2 |
| B | 12 | 111 | 19611 | 115.74 | 857 | 835 | 162.2 |
| C | 14 | 238 | 132148 | 678.96 | 832 | 839 | 193.4 |
| C | 7 | 247 | 98135 | 503.09 | 832 | 839 | 193.4 |
| C | 0 | 10 | 96196 | 493.06 | 832 | 839 | 193.4 |
| D | 1 | 52 | 237587 | 1140.69 | 849 | 826 | 207.6 |
| D | 8 | 195 | 74956 | 357.15 | 849 | 826 | 207.6 |
| D | 2 | 234 | 26908 | 125.66 | 849 | 826 | 207.6 |
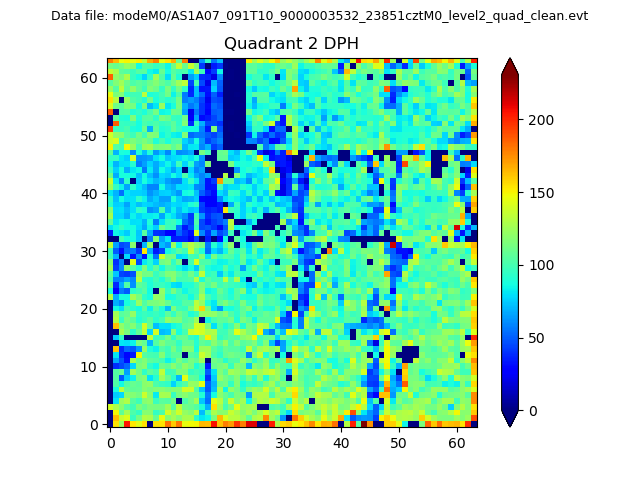
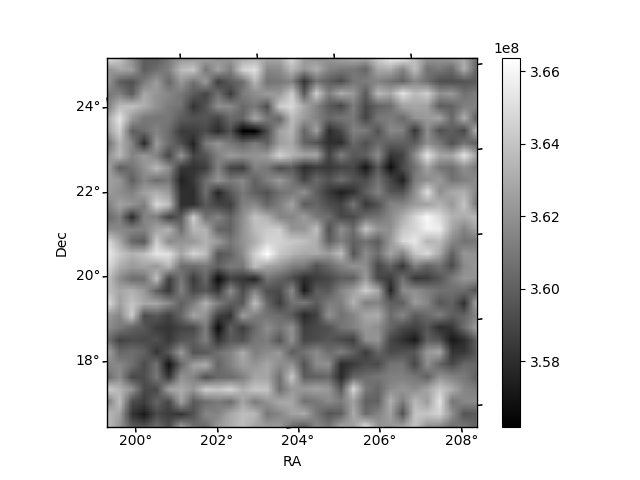
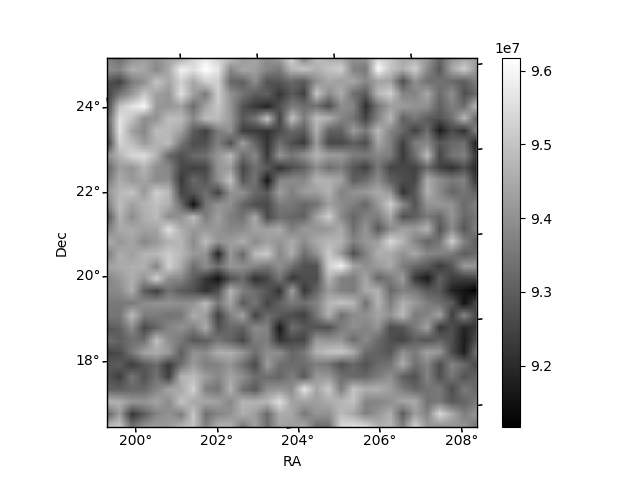
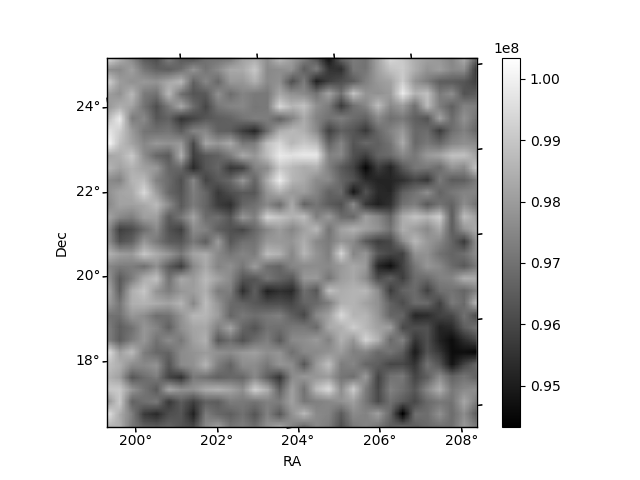
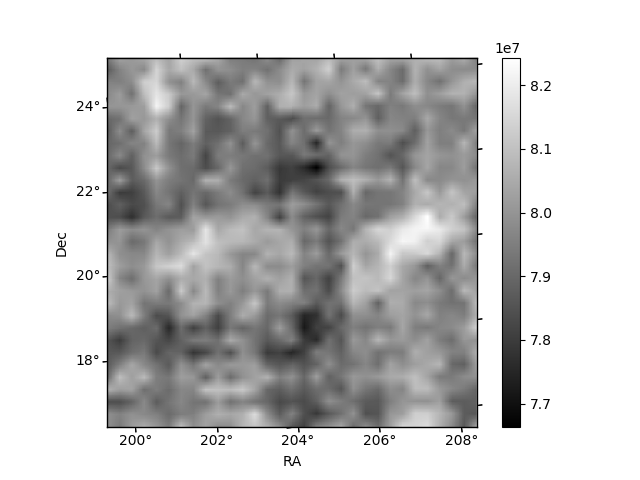
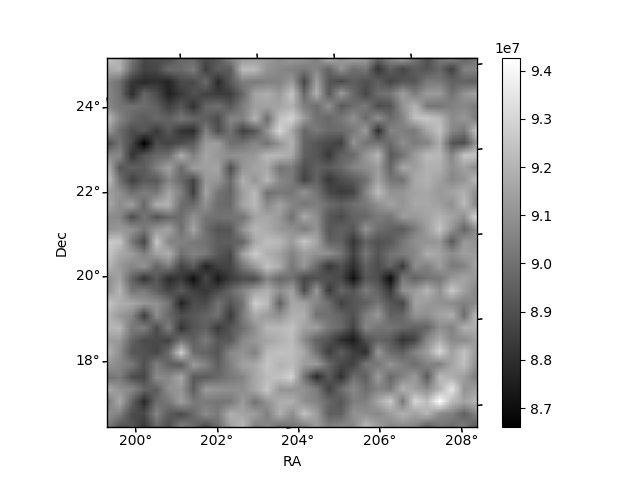
Histogram calculated using DETX and DETY for each event in the final _common_clean file
| Quadrant A | 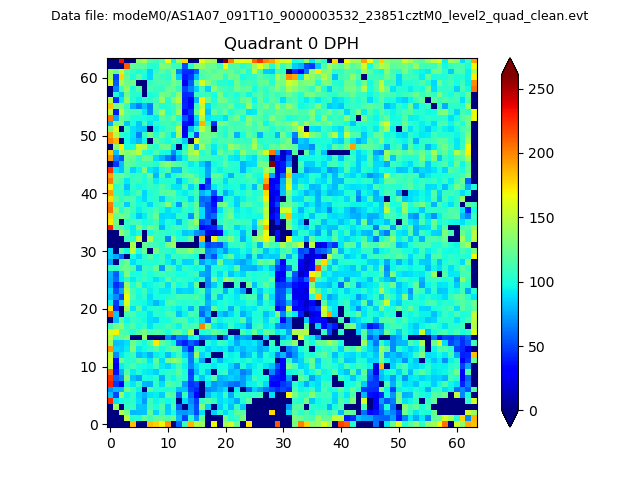 |
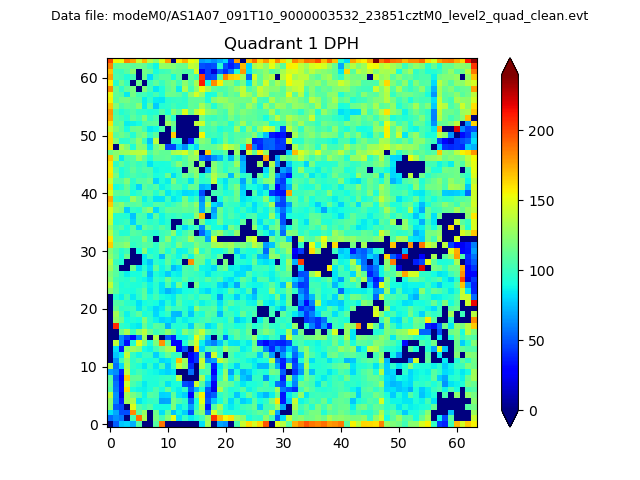 |
Quadrant B |
|---|---|---|---|
| Quadrant D | 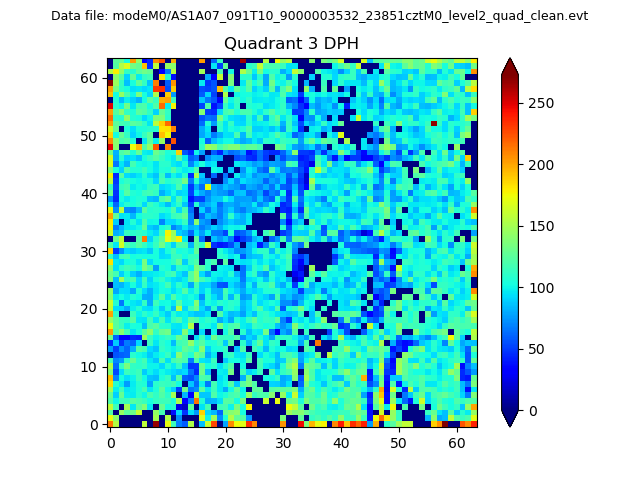 |
 |
Quadrant C |
| Plot type | Count rate plots | Images |
|---|---|---|
| Comparison with Poisson distribution Blue bars denote a histogram of data divided into 1 sec bins. Red curve is a Poisson curve with rate = median count rate of data. |
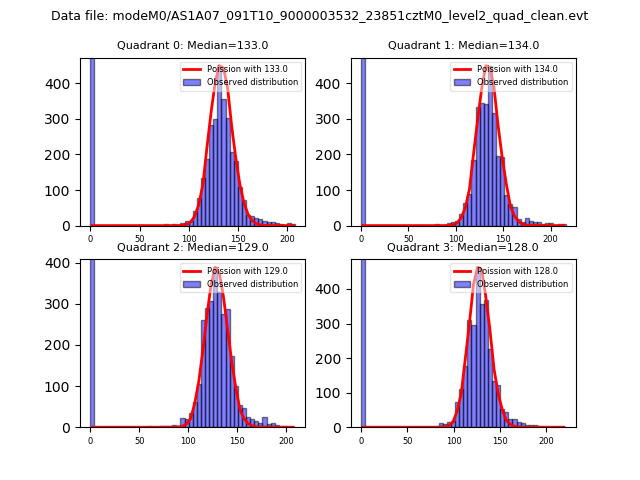 |
 |
| Quadrant-wise count rates Data is divided into 100 sec bins |
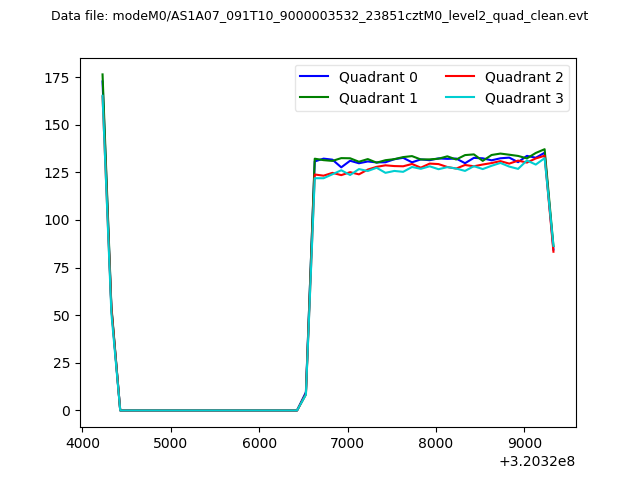 |
|
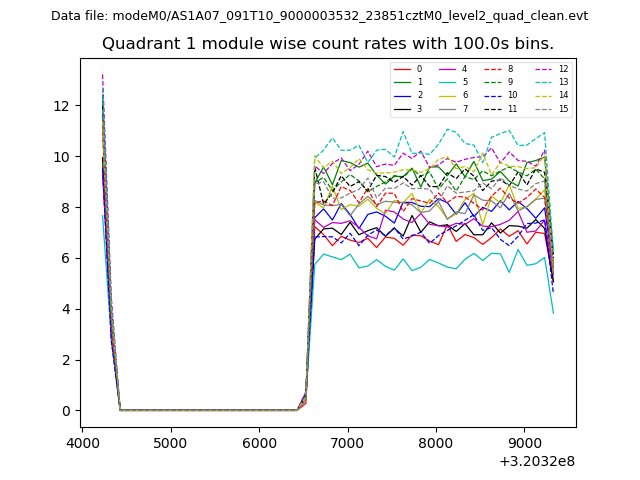
| Module-wise count rates for Quadrant A Data is divided into 100 sec bins |
 |
 |
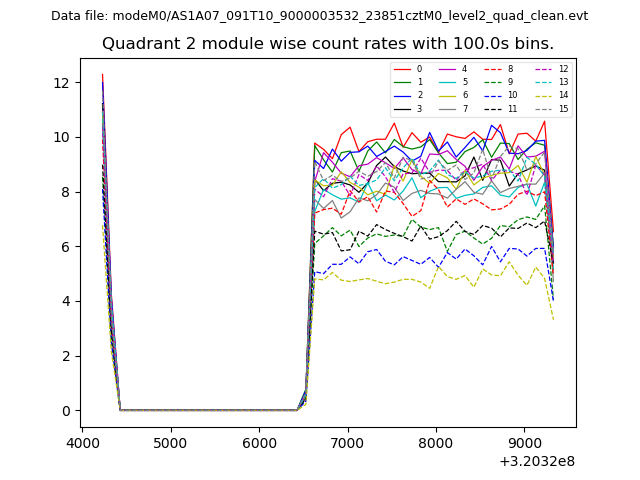
| Module-wise count rates for Quadrant B Data is divided into 100 sec bins |
 |
 |
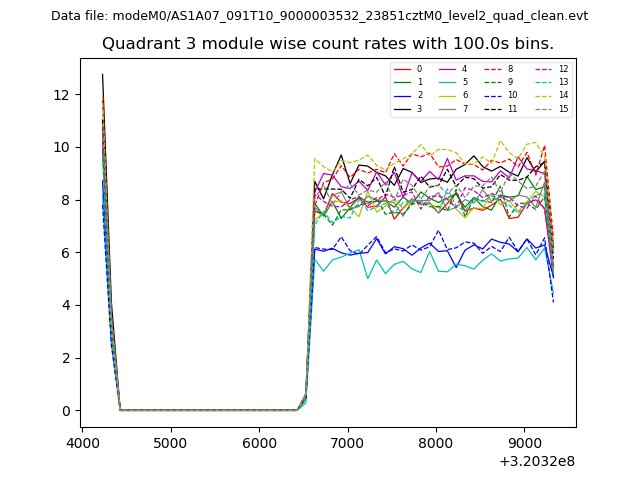
| Module-wise count rates for Quadrant C Data is divided into 100 sec bins |
 |
 |
| Module-wise count rates for Quadrant D Data is divided into 100 sec bins |
 |
 |
| Parameter | Plot |
|---|---|
| CZT HV Monitor | 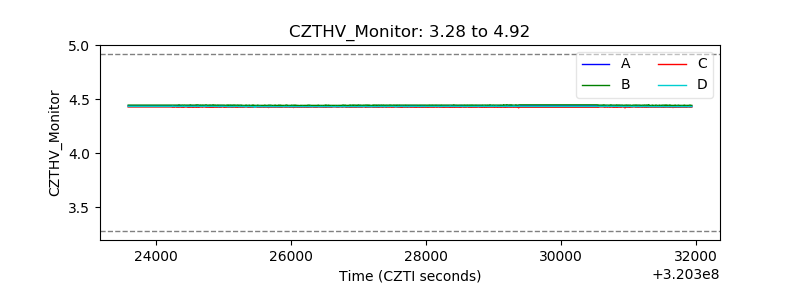 |
| D_VDD |  |
| Temperature 1 | 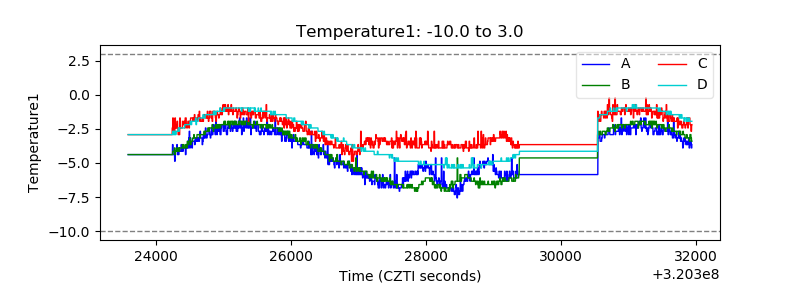 |
| Veto HV Monitor | 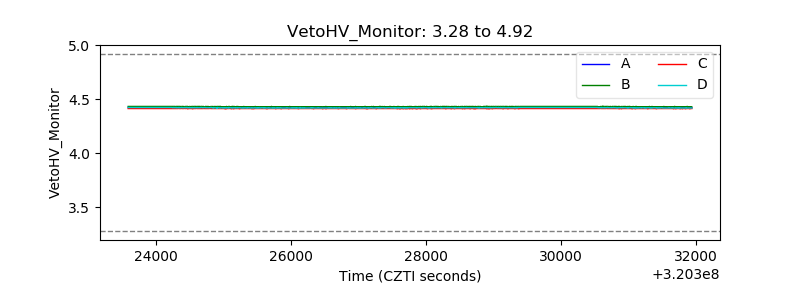 |
| Veto LLD |  |
| Alpha Counter | 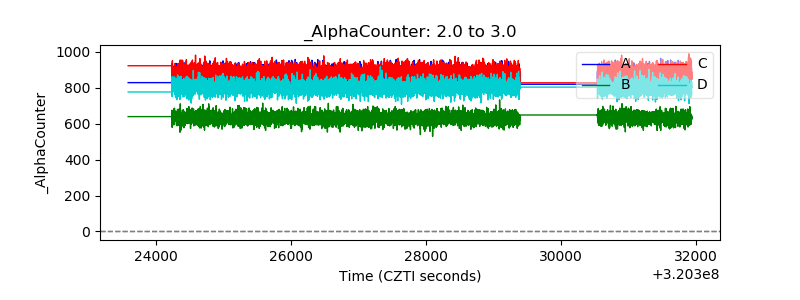 |
| _CPM_Rate | 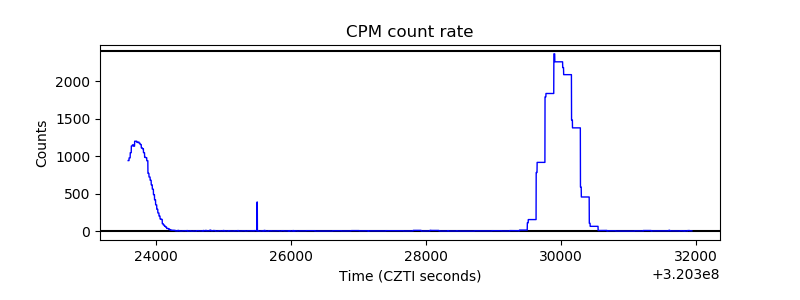 |
| CZT Counter | 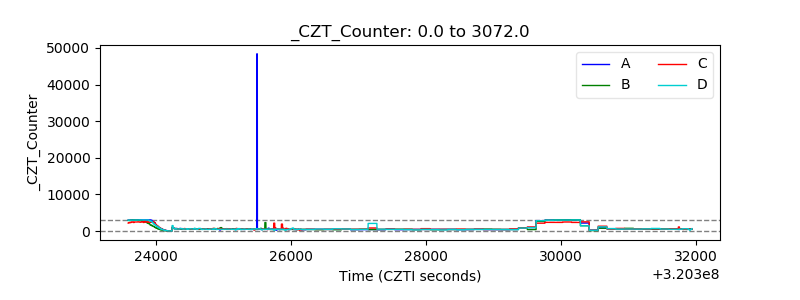 |
| +2.5 Volts monitor |  |
| +5 Volts monitor | 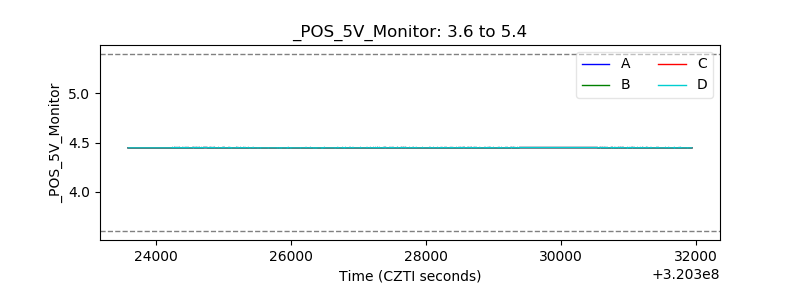 |
| _ROLL_ROT | 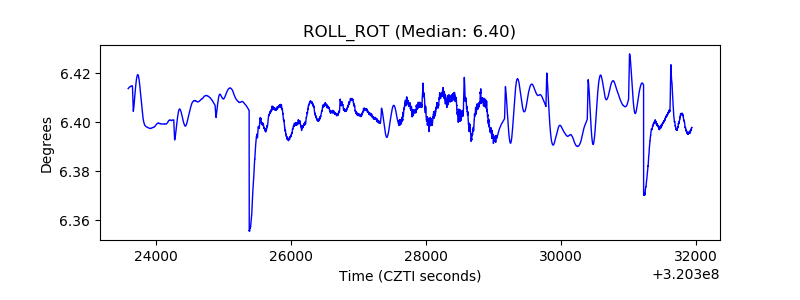 |
| _Roll_DEC | 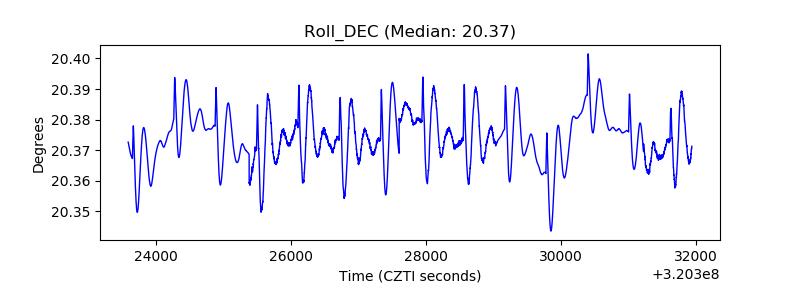 |
| _Roll_RA | 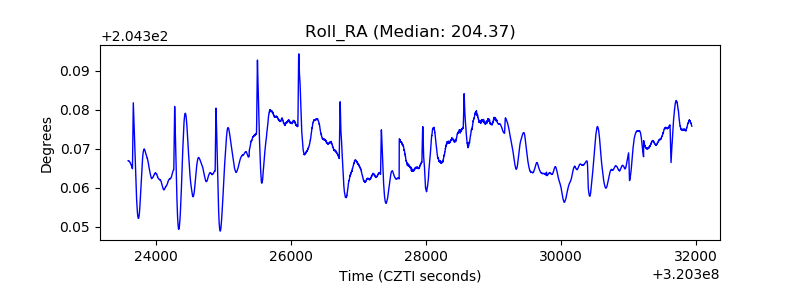 |
| Veto Counter |  |