| Param | Original file | Final file |
|---|---|---|
| Filename | modeM0/AS1A07_091T10_9000003532_23852cztM0_level2.evt | modeM0/AS1A07_091T10_9000003532_23852cztM0_level2_quad_clean.evt |
| Size (bytes) | 922,003,200 | 145,296,000 |
| Size | 879.3 MB | 138.6 MB |
| Events in quadrant A | 6,465,809 | 886,236 |
| Events in quadrant B | 6,618,354 | 893,450 |
| Events in quadrant C | 6,868,648 | 864,060 |
| Events in quadrant D | 7,083,513 | 851,224 |
| Mode M9 | |||
|---|---|---|---|
| Quadrant | BADHDUFLAG | Total packets | Discarded packets |
| A | 0 | 24 | 0 |
| B | 0 | 24 | 0 |
| C | 0 | 24 | 0 |
| D | 0 | 24 | 0 |
| Mode M0 | |||
|---|---|---|---|
| Quadrant | BADHDUFLAG | Total packets | Discarded packets |
| A | 0 | 27452 | 3 |
| B | 0 | 27757 | 3 |
| C | 0 | 28259 | 3 |
| D | 0 | 29453 | 3 |
| Mode SS | |||
|---|---|---|---|
| Quadrant | BADHDUFLAG | Total packets | Discarded packets |
| A | 0 | 266 | 0 |
| B | 0 | 266 | 0 |
| C | 0 | 266 | 0 |
| D | 0 | 266 | 0 |
| Quadrant | Total seconds | Saturated seconds | Saturation percentage |
|---|---|---|---|
| A | 13104 | 68 | 0.518926% |
| B | 13104 | 92 | 0.702076% |
| C | 13104 | 164 | 1.251526% |
| D | 13104 | 116 | 0.885226% |
Noise dominated data is calculated using 1-second bins in cleaned event files. If a bin has >2000 counts, and if more than 50% of those come from <1% of pixels, then it is considered to be noise-dominated and hence unusable.
| Quadrant | # 1 sec bins | Bins with >0 counts | Bins with >2000 counts | High rate bins dominated by noise | Noise dominated (total time) | Noise dominated (detector-on time) | Marked lightcurve |
|---|---|---|---|---|---|---|---|
| A | 15229 | 13106 | 0 | 0 | 0.00% | 0.00% | 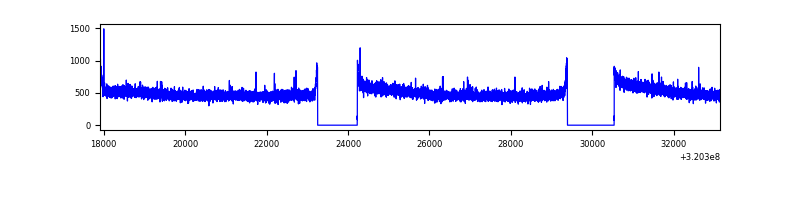 |
| B | 15229 | 13106 | 11 | 11 | 0.07% | 0.08% | 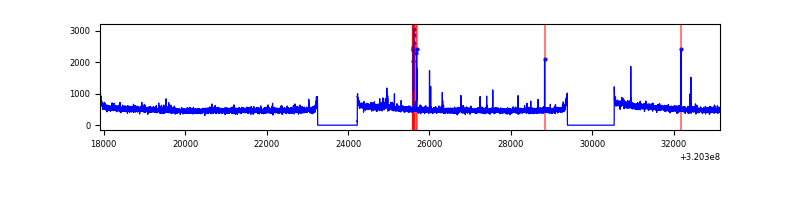 |
| C | 15229 | 13106 | 17 | 17 | 0.11% | 0.13% | 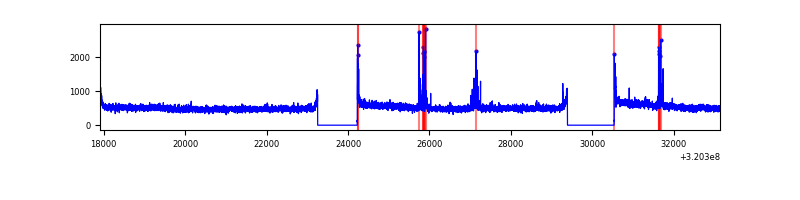 |
| D | 15229 | 13106 | 31 | 31 | 0.20% | 0.24% | 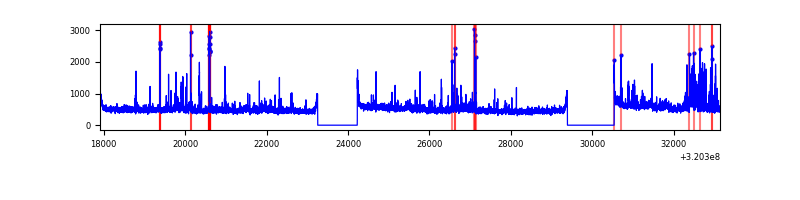 |
Top three noisy pixels from each quadrant. If the there are fewer than three noisy pixels in the level2.evt file, extra rows are filled as -1
| Pixel properties | Quadrant properties | ||||||
|---|---|---|---|---|---|---|---|
| Quadrant | DetID | PixID | Counts | Sigma | Mean | Median | Sigma |
| A | 13 | 254 | 21881 | 60.54 | 1675 | 1640 | 334.3 |
| A | 3 | 137 | 14639 | 38.88 | 1675 | 1640 | 334.3 |
| A | 0 | 226 | 14368 | 38.07 | 1675 | 1640 | 334.3 |
| B | 15 | 33 | 42573 | 130.72 | 1659 | 1618 | 313.3 |
| B | 12 | 111 | 38334 | 117.19 | 1659 | 1618 | 313.3 |
| B | 0 | 189 | 35703 | 108.8 | 1659 | 1618 | 313.3 |
| C | 14 | 238 | 255788 | 678.52 | 1610 | 1624 | 374.6 |
| C | 7 | 247 | 162211 | 428.7 | 1610 | 1624 | 374.6 |
| C | 0 | 10 | 98590 | 258.86 | 1610 | 1624 | 374.6 |
| D | 1 | 52 | 694922 | 1728.71 | 1637 | 1592 | 401.1 |
| D | 8 | 195 | 162610 | 401.47 | 1637 | 1592 | 401.1 |
| D | 2 | 234 | 54597 | 132.16 | 1637 | 1592 | 401.1 |
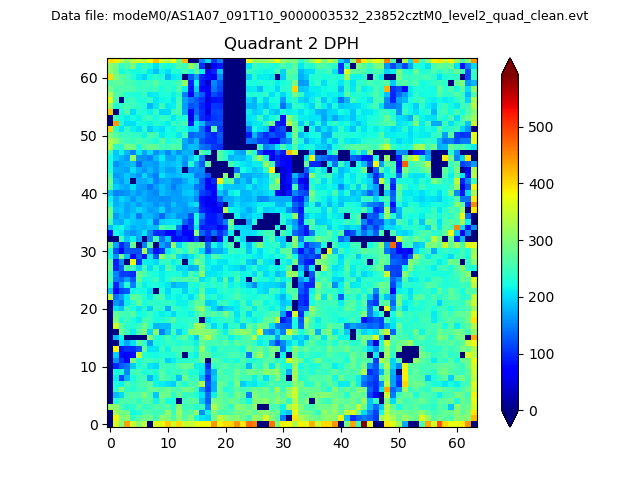
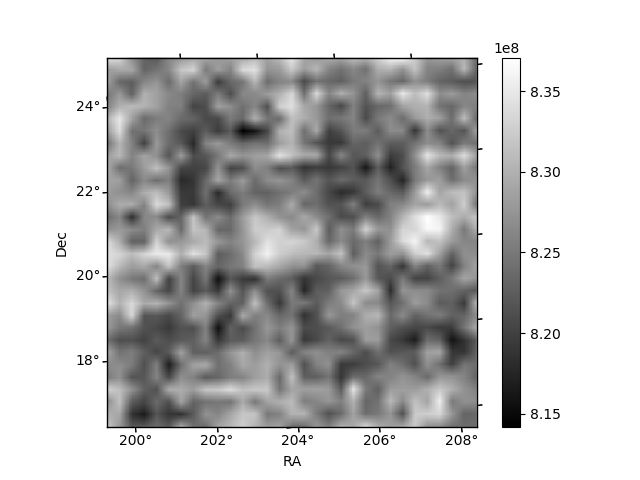
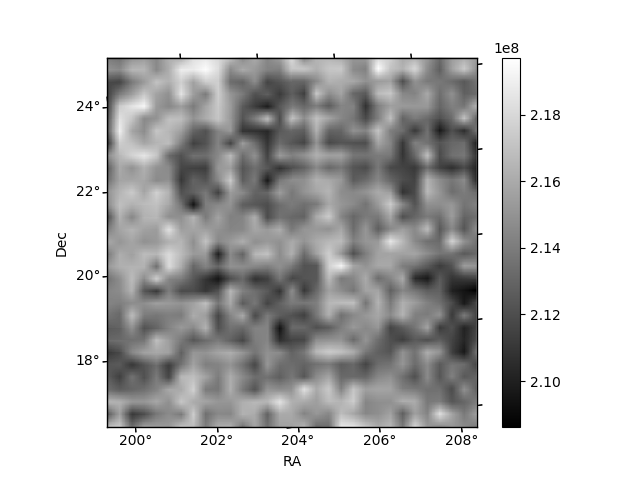
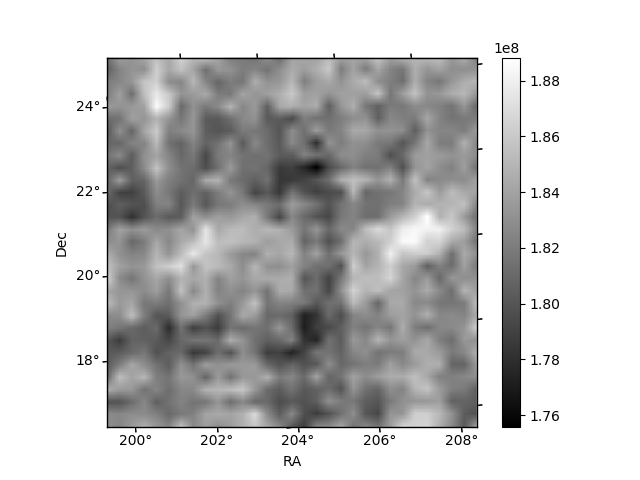
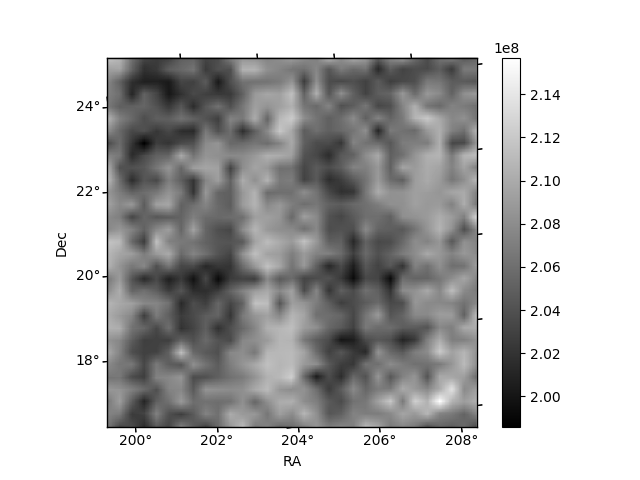
Histogram calculated using DETX and DETY for each event in the final _common_clean file
| Quadrant A | 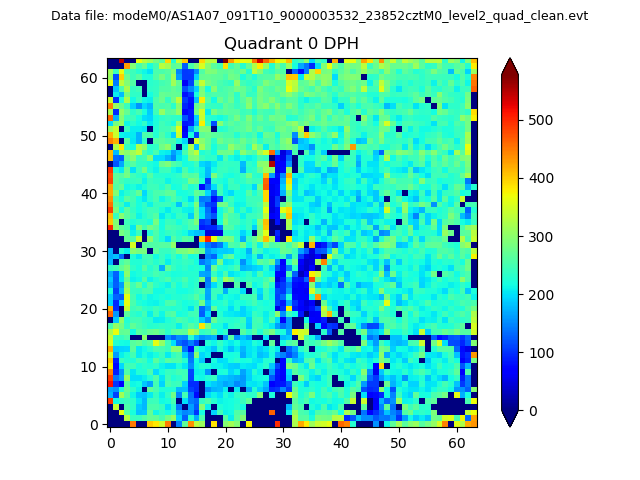 |
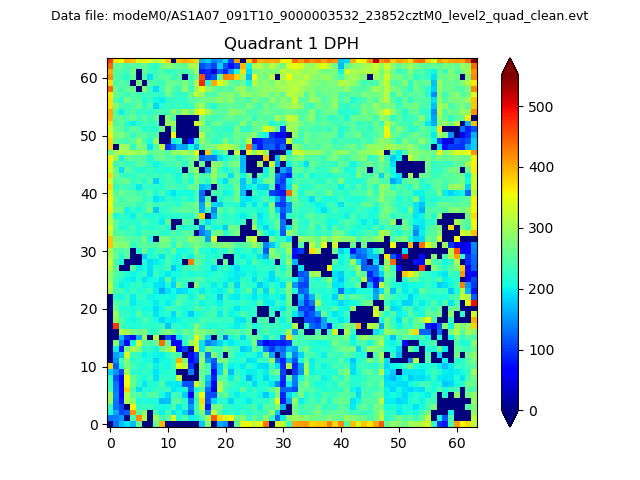 |
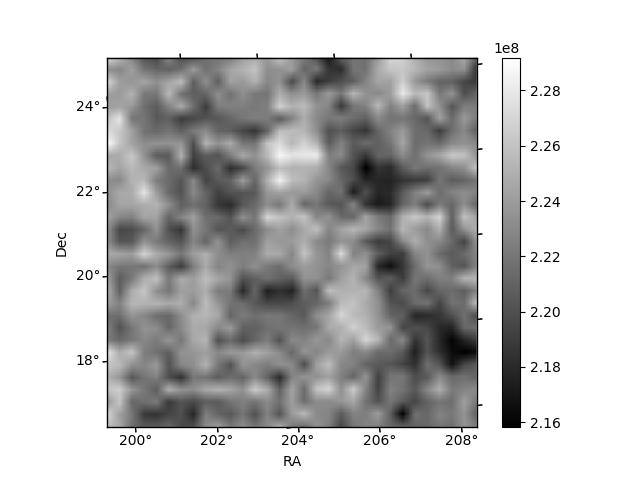
Quadrant B |
|---|---|---|---|
| Quadrant D | 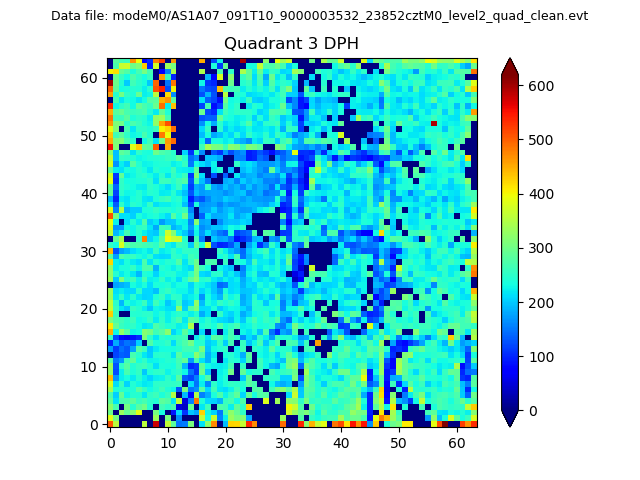 |
 |
Quadrant C |
| Plot type | Count rate plots | Images |
|---|---|---|
| Comparison with Poisson distribution Blue bars denote a histogram of data divided into 1 sec bins. Red curve is a Poisson curve with rate = median count rate of data. |
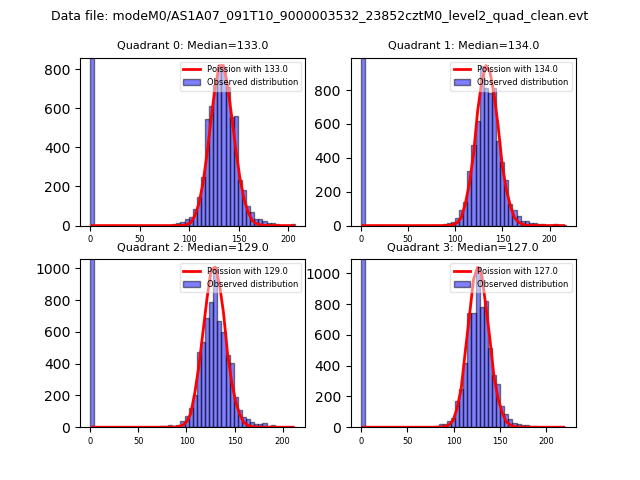 |
 |
| Quadrant-wise count rates Data is divided into 100 sec bins |
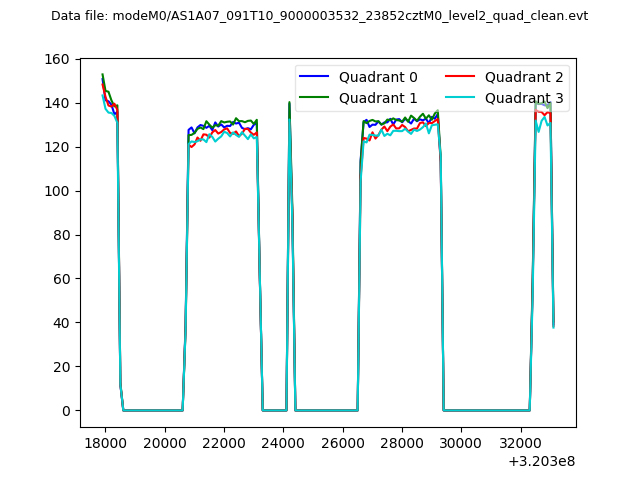 |
|
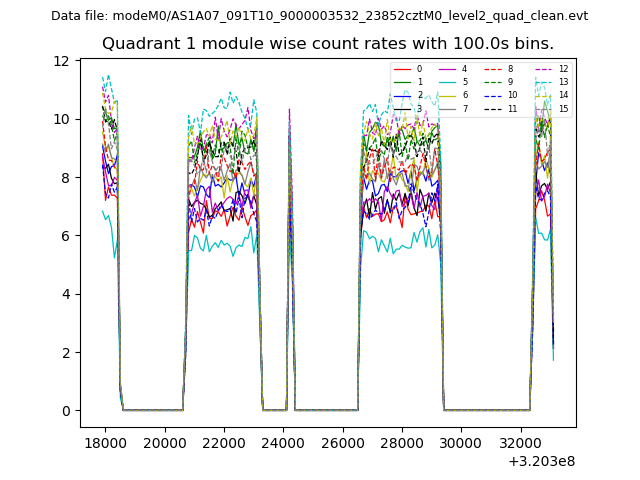
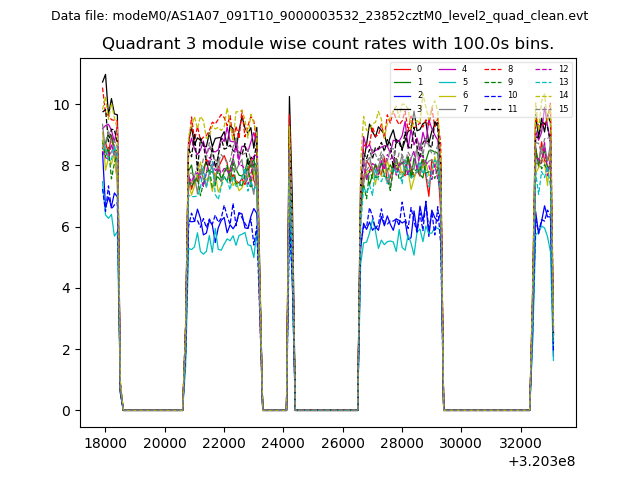
| Module-wise count rates for Quadrant A Data is divided into 100 sec bins |
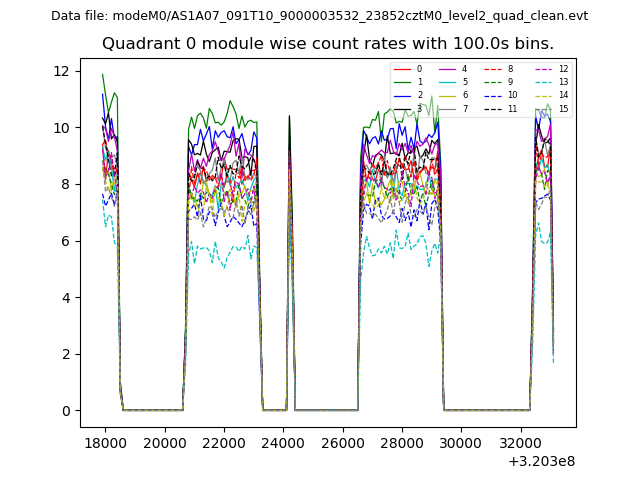 |
 |
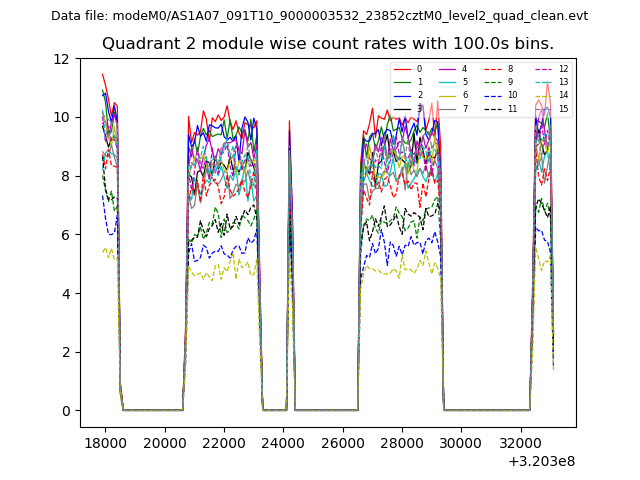
| Module-wise count rates for Quadrant B Data is divided into 100 sec bins |
 |
 |
| Module-wise count rates for Quadrant C Data is divided into 100 sec bins |
 |
 |
| Module-wise count rates for Quadrant D Data is divided into 100 sec bins |
 |
 |
| Parameter | Plot |
|---|---|
| CZT HV Monitor | 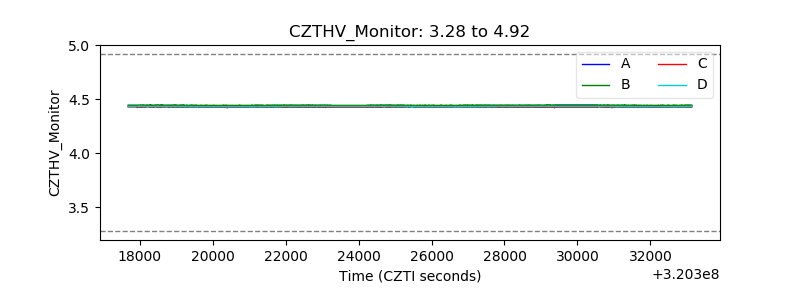 |
| D_VDD | 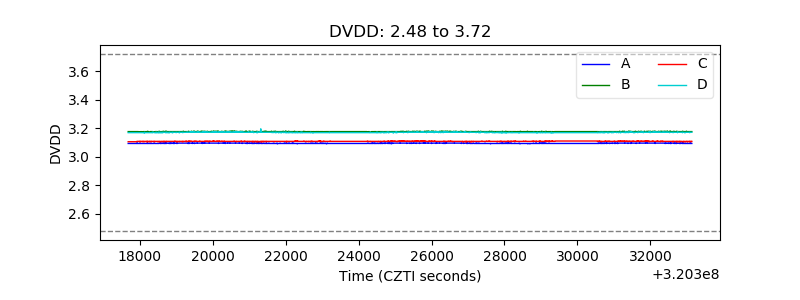 |
| Temperature 1 | 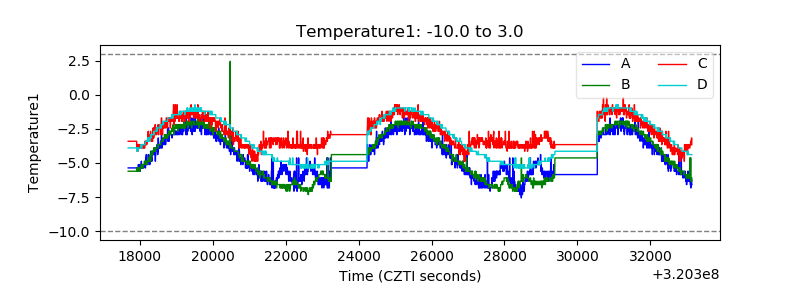 |
| Veto HV Monitor | 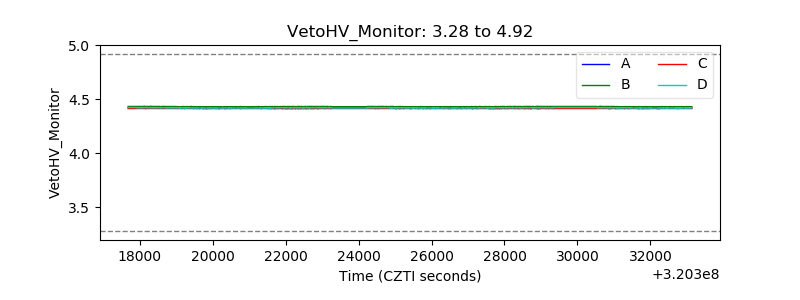 |
| Veto LLD |  |
| Alpha Counter | 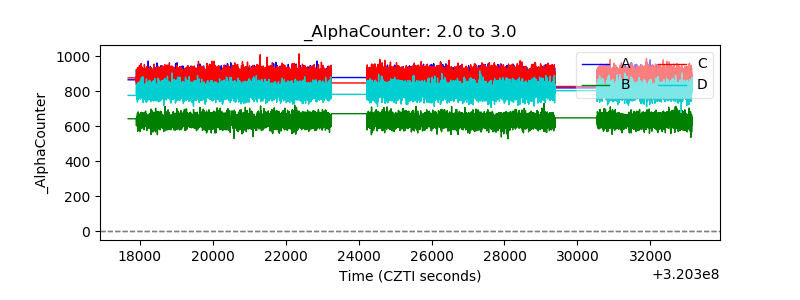 |
| _CPM_Rate | 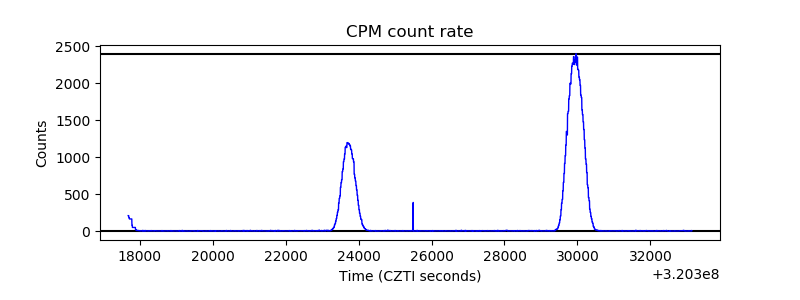 |
| CZT Counter | 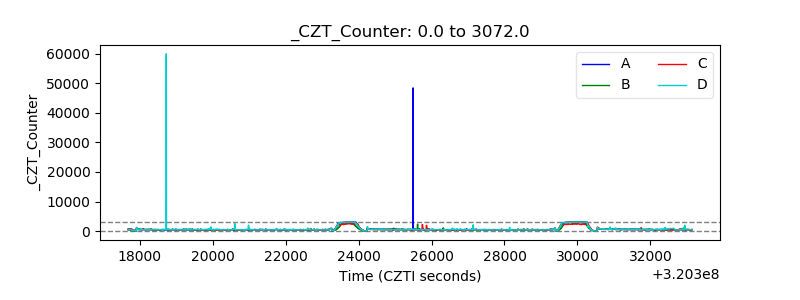 |
| +2.5 Volts monitor |  |
| +5 Volts monitor | 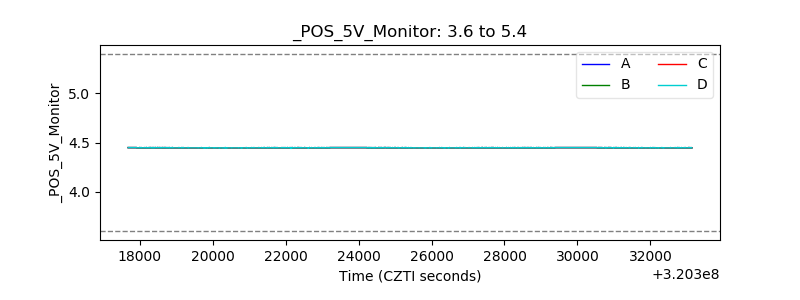 |
| _ROLL_ROT | 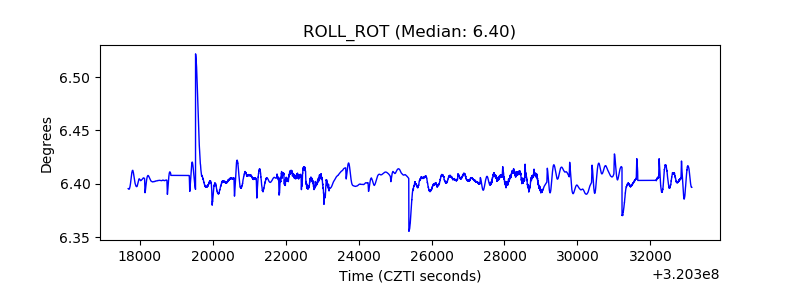 |
| _Roll_DEC | 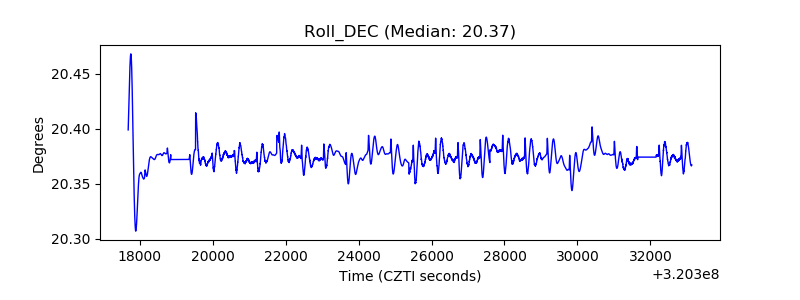 |
| _Roll_RA | 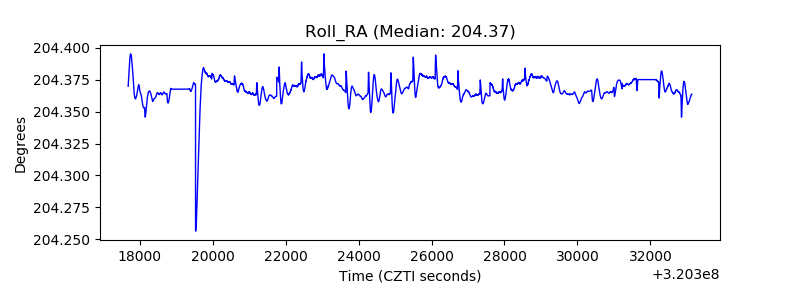 |
| Veto Counter | 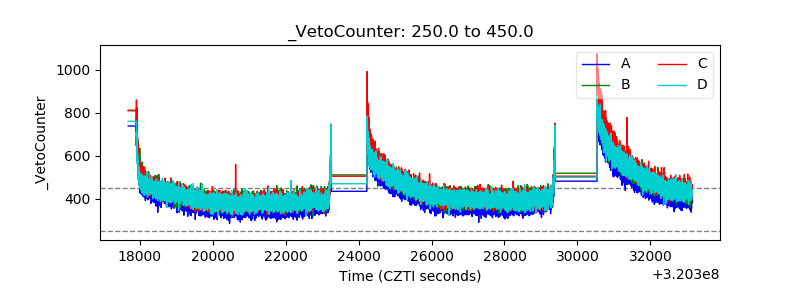 |