| Param | Original file | Final file |
|---|---|---|
| Filename | modeM0/AS1A07_091T10_9000003532_23853cztM0_level2.evt | modeM0/AS1A07_091T10_9000003532_23853cztM0_level2_quad_clean.evt |
| Size (bytes) | 206,519,040 | 18,285,120 |
| Size | 197.0 MB | 17.4 MB |
| Events in quadrant A | 1,411,808 | 93,472 |
| Events in quadrant B | 1,430,561 | 94,244 |
| Events in quadrant C | 1,510,759 | 90,954 |
| Events in quadrant D | 1,722,973 | 87,861 |
| Mode M9 | |||
|---|---|---|---|
| Quadrant | BADHDUFLAG | Total packets | Discarded packets |
| A | 0 | 1 | 0 |
| B | 0 | 2 | 0 |
| C | 0 | 2 | 0 |
| D | 0 | 2 | 0 |
| Mode M0 | |||
|---|---|---|---|
| Quadrant | BADHDUFLAG | Total packets | Discarded packets |
| A | 0 | 5857 | 1 |
| B | 0 | 5899 | 1 |
| C | 0 | 6170 | 1 |
| D | 0 | 6897 | 1 |
| Mode SS | |||
|---|---|---|---|
| Quadrant | BADHDUFLAG | Total packets | Discarded packets |
| A | 0 | 52 | 0 |
| B | 0 | 52 | 0 |
| C | 0 | 52 | 0 |
| D | 0 | 52 | 0 |
| Quadrant | Total seconds | Saturated seconds | Saturation percentage |
|---|---|---|---|
| A | 2599 | 5 | 0.192382% |
| B | 2599 | 8 | 0.307811% |
| C | 2599 | 41 | 1.577530% |
| D | 2599 | 43 | 1.654482% |
Noise dominated data is calculated using 1-second bins in cleaned event files. If a bin has >2000 counts, and if more than 50% of those come from <1% of pixels, then it is considered to be noise-dominated and hence unusable.
| Quadrant | # 1 sec bins | Bins with >0 counts | Bins with >2000 counts | High rate bins dominated by noise | Noise dominated (total time) | Noise dominated (detector-on time) | Marked lightcurve |
|---|---|---|---|---|---|---|---|
| A | 2599 | 2599 | 0 | 0 | 0.00% | 0.00% | 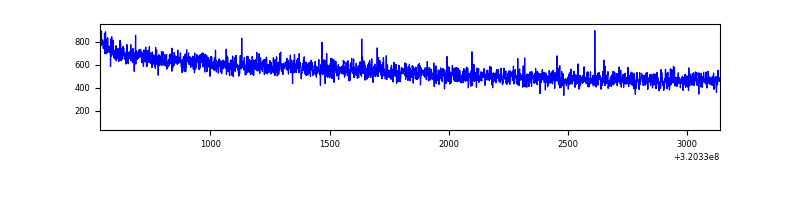 |
| B | 2599 | 2599 | 1 | 1 | 0.04% | 0.04% | 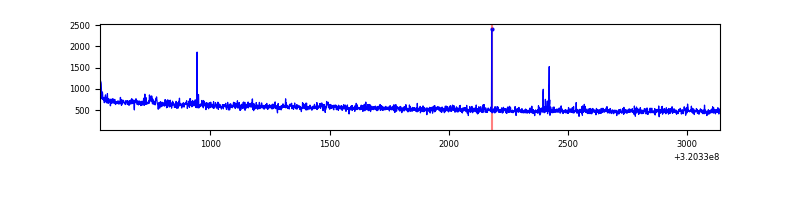 |
| C | 2599 | 2599 | 6 | 6 | 0.23% | 0.23% | 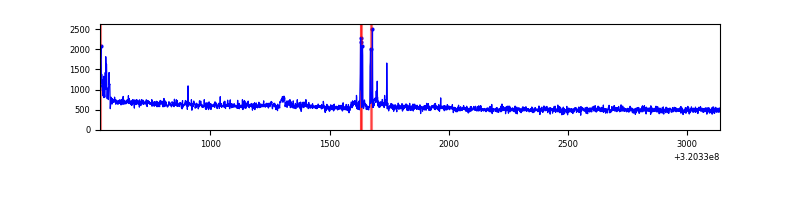 |
| D | 2599 | 2599 | 7 | 7 | 0.27% | 0.27% | 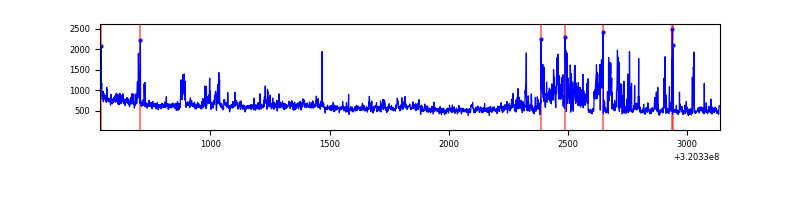 |
Top three noisy pixels from each quadrant. If the there are fewer than three noisy pixels in the level2.evt file, extra rows are filled as -1
| Pixel properties | Quadrant properties | ||||||
|---|---|---|---|---|---|---|---|
| Quadrant | DetID | PixID | Counts | Sigma | Mean | Median | Sigma |
| A | 13 | 254 | 4437 | 54.96 | 366 | 359 | 74.2 |
| A | 0 | 226 | 3275 | 39.3 | 366 | 359 | 74.2 |
| A | 3 | 137 | 2972 | 35.22 | 366 | 359 | 74.2 |
| B | 0 | 189 | 8868 | 123.4 | 360 | 351 | 69.0 |
| B | 12 | 111 | 7783 | 107.68 | 360 | 351 | 69.0 |
| B | 11 | 111 | 6946 | 95.56 | 360 | 351 | 69.0 |
| C | 14 | 238 | 57094 | 694.82 | 350 | 354 | 81.7 |
| C | 7 | 247 | 38460 | 466.63 | 350 | 354 | 81.7 |
| C | 0 | 207 | 29573 | 357.81 | 350 | 354 | 81.7 |
| D | 1 | 52 | 302635 | 3451.21 | 356 | 347 | 87.6 |
| D | 8 | 195 | 60108 | 682.29 | 356 | 347 | 87.6 |
| D | 2 | 234 | 10617 | 117.25 | 356 | 347 | 87.6 |
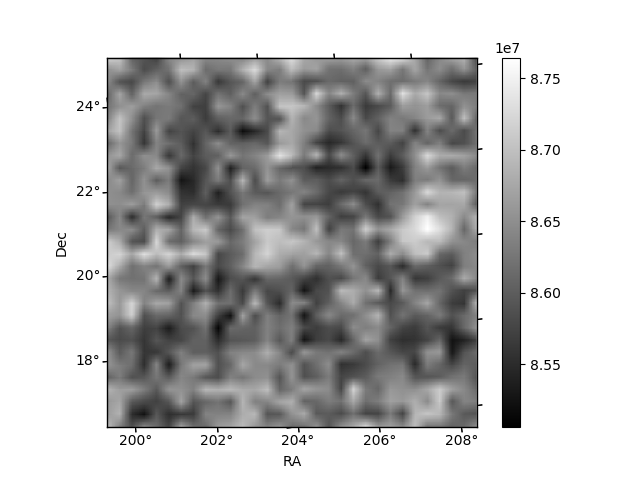
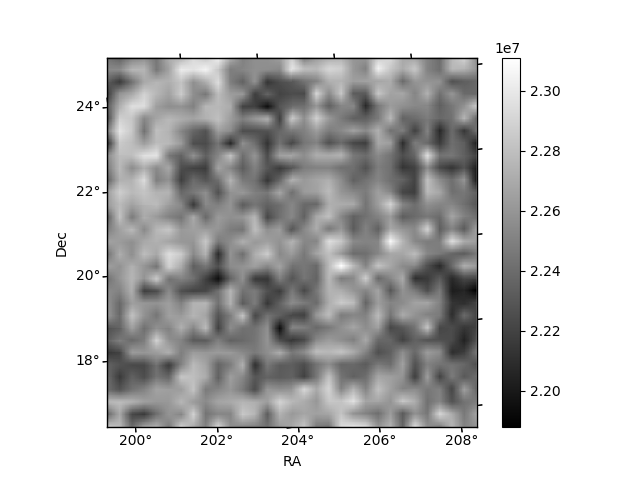
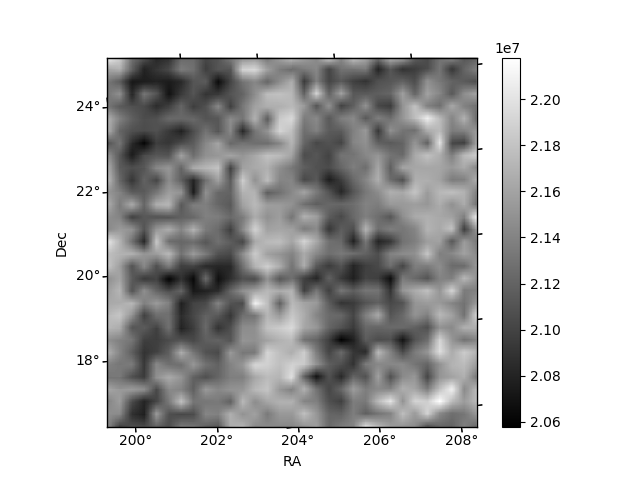
Histogram calculated using DETX and DETY for each event in the final _common_clean file
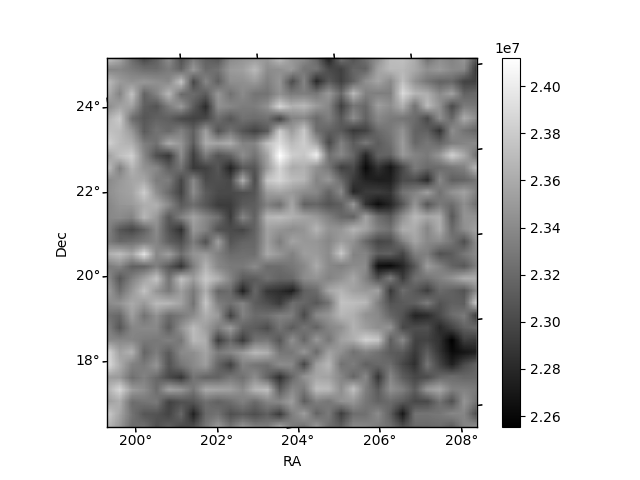
| Quadrant A | 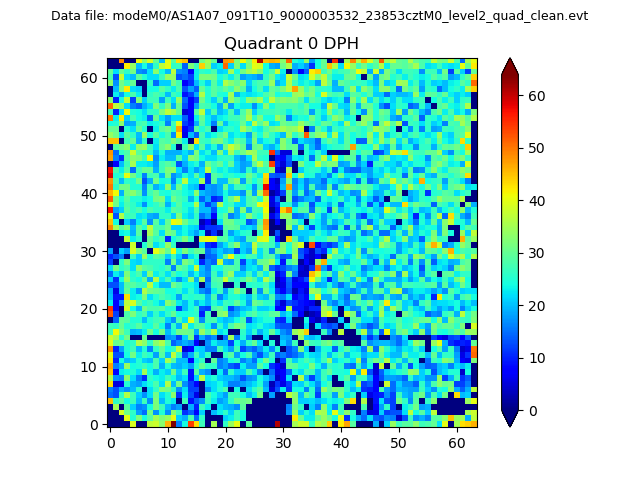 |
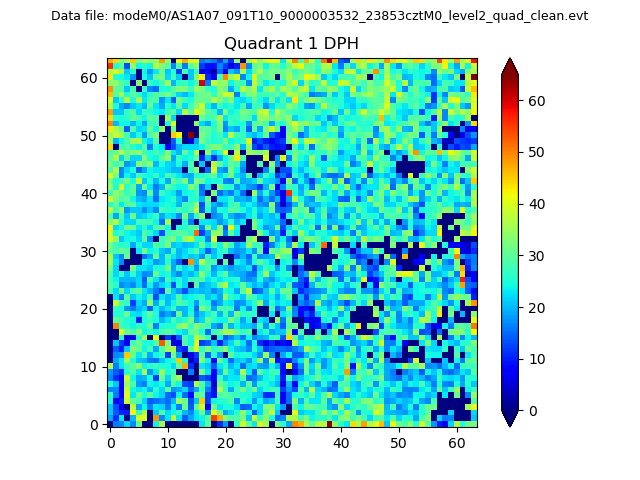 |
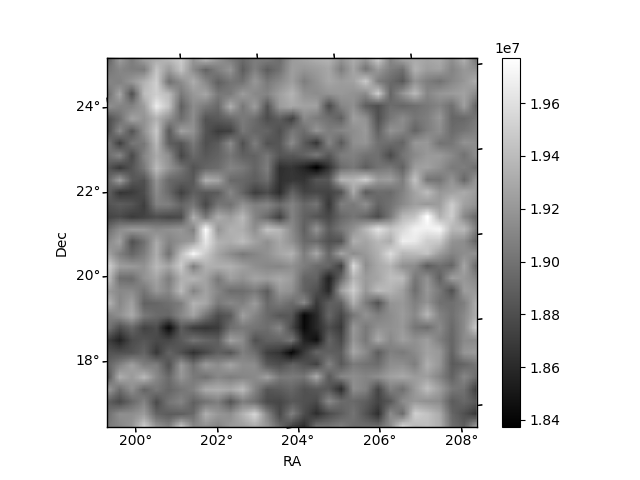
Quadrant B |
|---|---|---|---|
| Quadrant D |  |
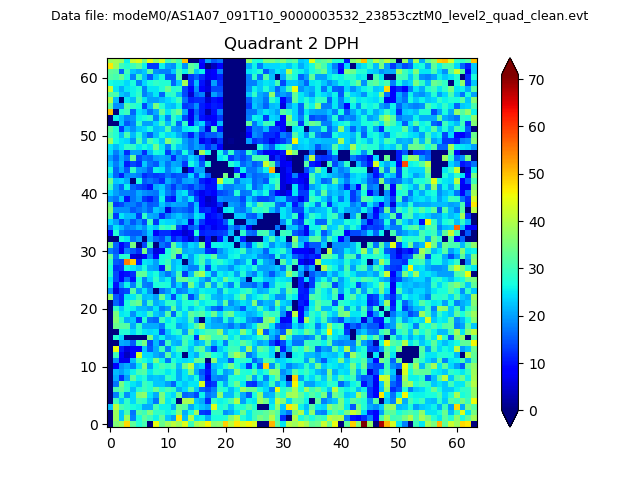 |
Quadrant C |
| Plot type | Count rate plots | Images |
|---|---|---|
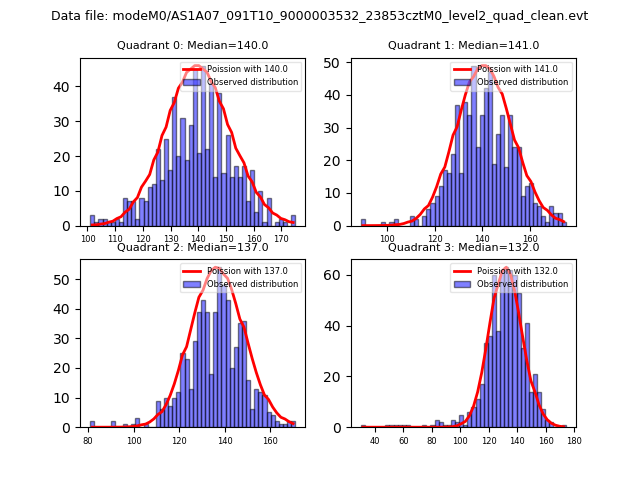
| Comparison with Poisson distribution Blue bars denote a histogram of data divided into 1 sec bins. Red curve is a Poisson curve with rate = median count rate of data. |
 |
 |
| Quadrant-wise count rates Data is divided into 100 sec bins |
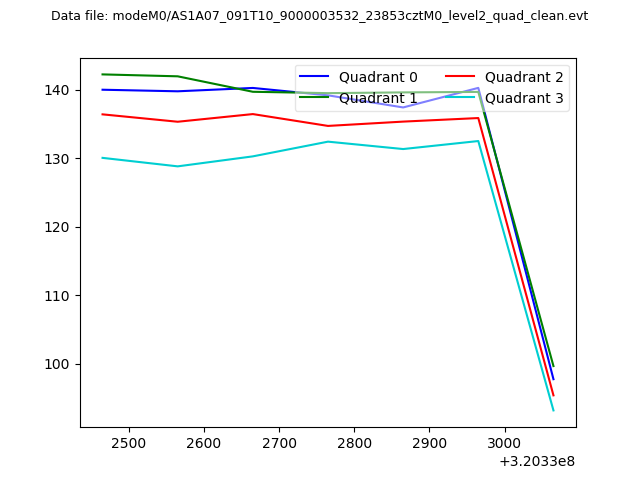 |
|
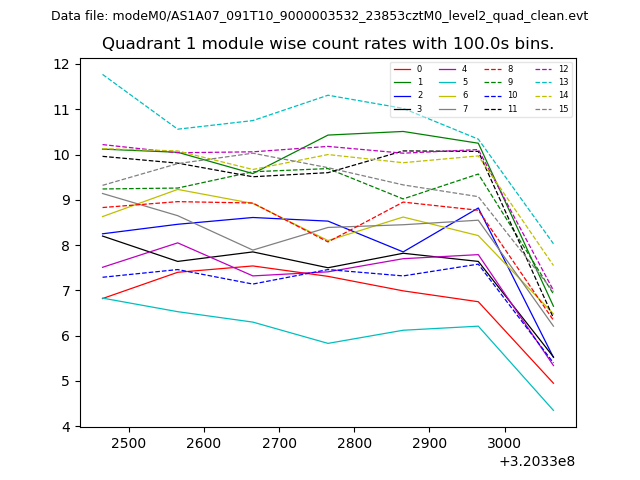
| Module-wise count rates for Quadrant A Data is divided into 100 sec bins |
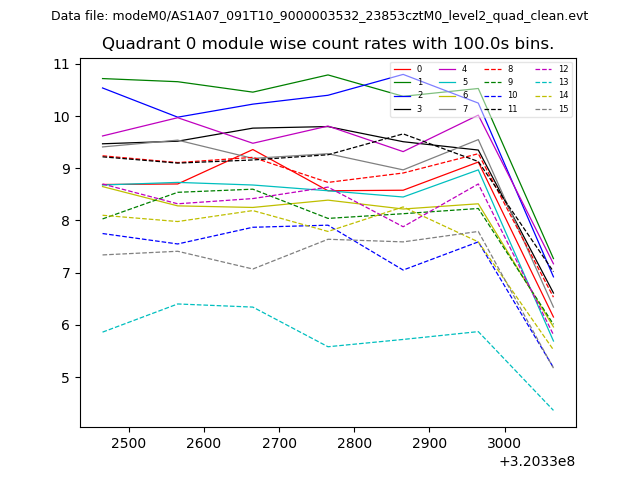 |
 |
| Module-wise count rates for Quadrant B Data is divided into 100 sec bins |
 |
 |
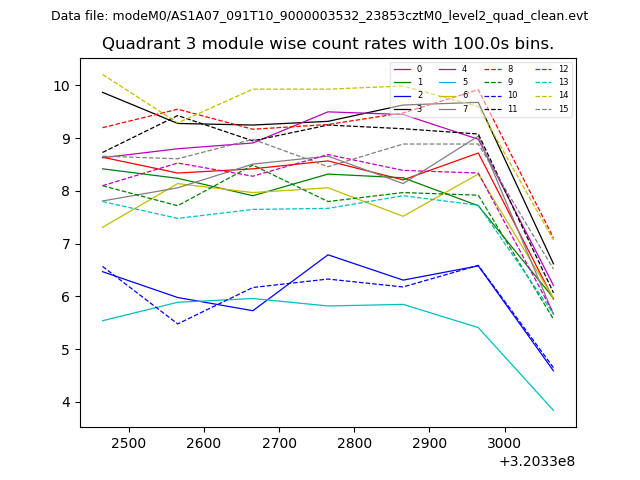
| Module-wise count rates for Quadrant C Data is divided into 100 sec bins |
 |
 |
| Module-wise count rates for Quadrant D Data is divided into 100 sec bins |
 |
 |
| Parameter | Plot |
|---|---|
| CZT HV Monitor |  |
| D_VDD | 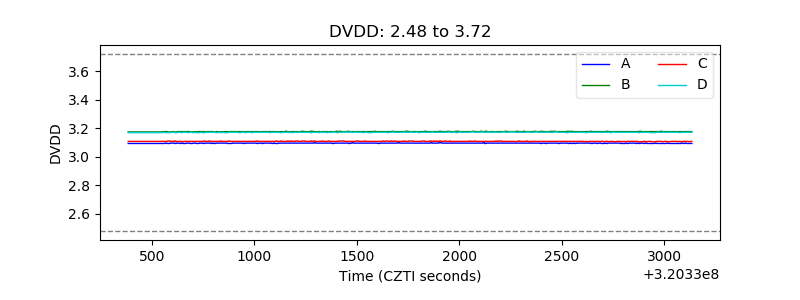 |
| Temperature 1 | 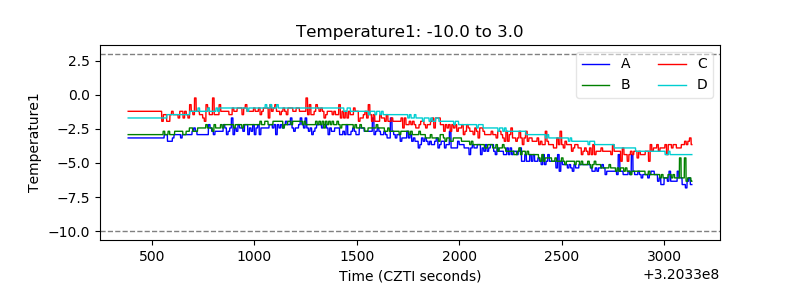 |
| Veto HV Monitor | 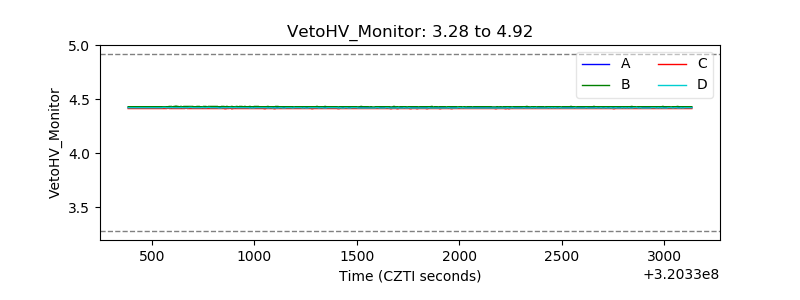 |
| Veto LLD | 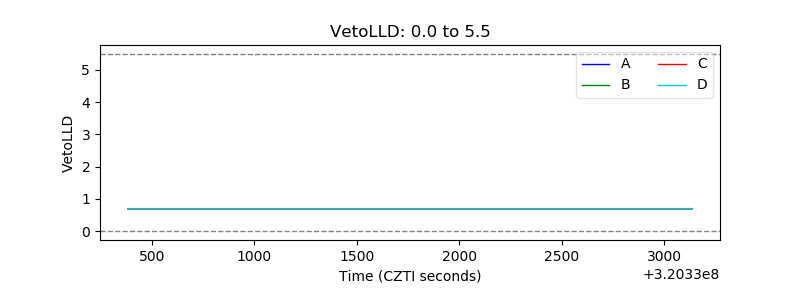 |
| Alpha Counter | 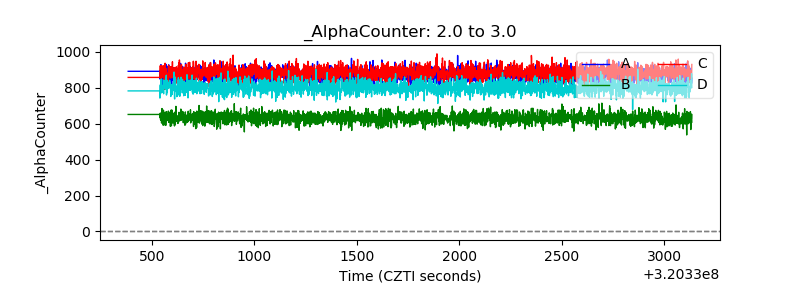 |
| _CPM_Rate | 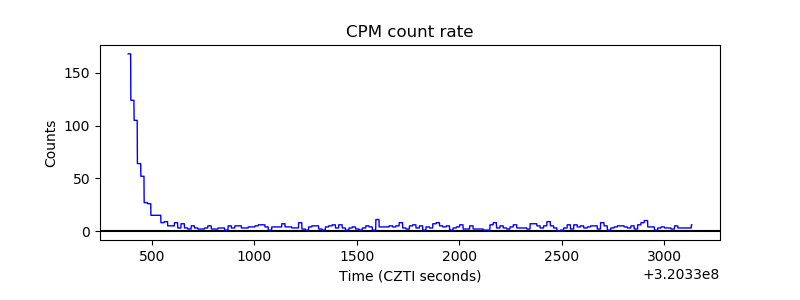 |
| CZT Counter | 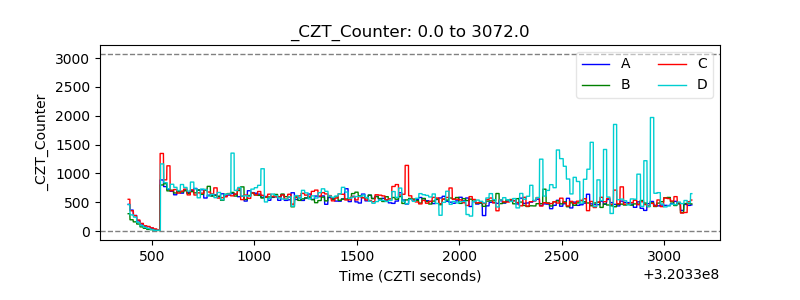 |
| +2.5 Volts monitor |  |
| +5 Volts monitor |  |
| _ROLL_ROT | 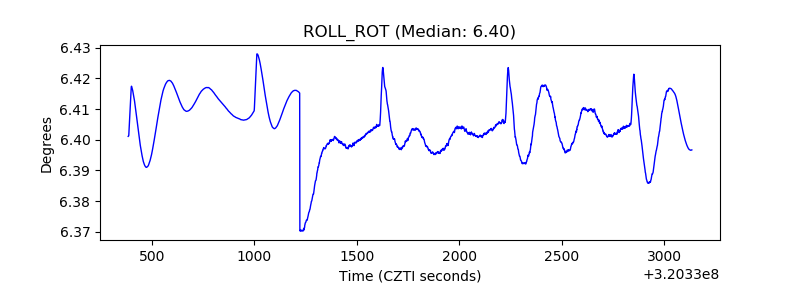 |
| _Roll_DEC | 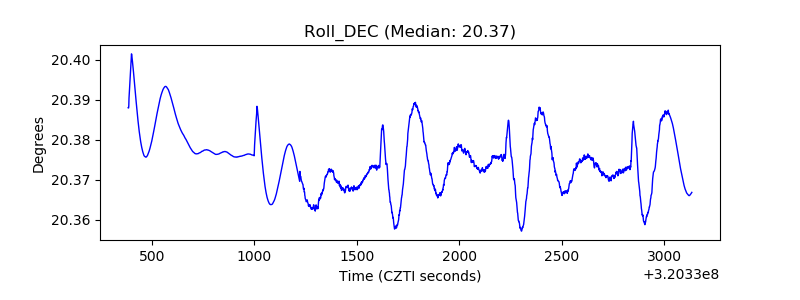 |
| _Roll_RA | 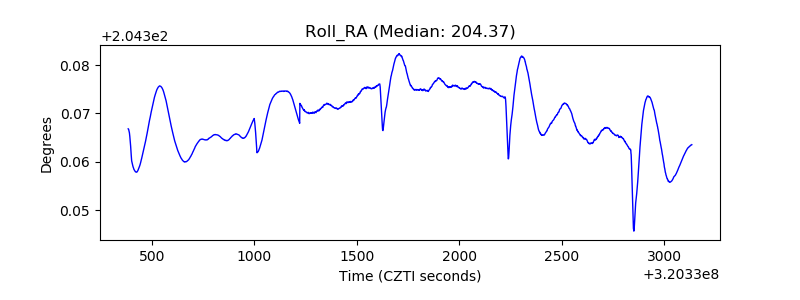 |
| Veto Counter | 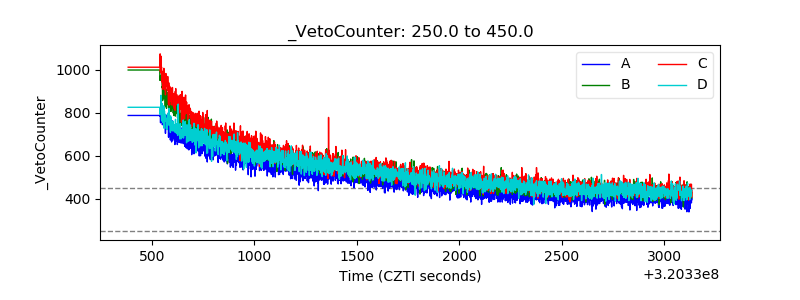 |