| Param | Original file | Final file |
|---|---|---|
| Filename | modeM0/AS1A07_149T01_9000003534cztM0_level2.fits | modeM0/AS1A07_149T01_9000003534cztM0_level2_quad_clean.evt |
| Size (bytes) | 655,110,720 | 589,769,280 |
| Size | 624.8 MB | 562.4 MB |
| Events in quadrant A | 4,108,874 | 3,503,150 |
| Events in quadrant B | 3,894,811 | 3,507,246 |
| Events in quadrant C | 3,920,233 | 3,315,498 |
| Events in quadrant D | 3,430,196 | 3,048,977 |
| Mode M0 | |||
|---|---|---|---|
| Quadrant | BADHDUFLAG | Total packets | Discarded packets |
| A | 0 | 136580 | 0 |
| B | 0 | 138785 | 0 |
| C | 0 | 140221 | 0 |
| D | 0 | 160794 | 0 |
| Mode SS | |||
|---|---|---|---|
| Quadrant | BADHDUFLAG | Total packets | Discarded packets |
| A | 0 | 1326 | 0 |
| B | 0 | 1328 | 0 |
| C | 0 | 1336 | 0 |
| D | 0 | 1323 | 0 |
| Mode M9 | |||
|---|---|---|---|
| Quadrant | BADHDUFLAG | Total packets | Discarded packets |
| A | 0 | 121 | 0 |
| B | 0 | 121 | 0 |
| C | 0 | 121 | 0 |
| D | 0 | 120 | 0 |
| Quadrant | Total seconds | Saturated seconds | Saturation percentage |
|---|---|---|---|
| A | 65453 | 716 | 1.093915% |
| B | 65403 | 889 | 1.359265% |
| C | 65418 | 1125 | 1.719710% |
| D | 65392 | 1537 | 2.350440% |
Noise dominated data is calculated using 1-second bins in cleaned event files. If a bin has >2000 counts, and if more than 50% of those come from <1% of pixels, then it is considered to be noise-dominated and hence unusable.
| Quadrant | # 1 sec bins | Bins with >0 counts | Bins with >2000 counts | High rate bins dominated by noise | Noise dominated (total time) | Noise dominated (detector-on time) | Marked lightcurve |
|---|---|---|---|---|---|---|---|
| A | 92250 | 65843 | 0 | 0 | 0.00% | 0.00% |  |
| B | 92250 | 65805 | 0 | 0 | 0.00% | 0.00% |  |
| C | 92250 | 65835 | 0 | 0 | 0.00% | 0.00% |  |
| D | 92250 | 65799 | 0 | 0 | 0.00% | 0.00% |  |
Top three noisy pixels from each quadrant. If the there are fewer than three noisy pixels in the level2.evt file, extra rows are filled as -1
| Pixel properties | Quadrant properties | ||||||
|---|---|---|---|---|---|---|---|
| Quadrant | DetID | PixID | Counts | Sigma | Mean | Median | Sigma |
| A | 0 | 29 | 3958 | 11.17 | 1070 | 1009 | 264.0 |
| A | 7 | 110 | 3293 | 8.65 | 1070 | 1009 | 264.0 |
| A | 0 | 30 | 3105 | 7.94 | 1070 | 1009 | 264.0 |
| B | 2 | 9 | 3179 | 10.86 | 1032 | 991 | 201.4 |
| B | 2 | 8 | 2648 | 8.23 | 1032 | 991 | 201.4 |
| B | 3 | 80 | 2520 | 7.59 | 1032 | 991 | 201.4 |
| C | 1 | 80 | 3044 | 7.86 | 1034 | 971 | 263.6 |
| C | 1 | 81 | 3010 | 7.74 | 1034 | 971 | 263.6 |
| C | 12 | 241 | 2768 | 6.82 | 1034 | 971 | 263.6 |
| D | 3 | 14 | 2550 | 6.42 | 978 | 894 | 258.1 |
| D | 10 | 189 | 2406 | 5.86 | 978 | 894 | 258.1 |
| D | 15 | 46 | 2403 | 5.85 | 978 | 894 | 258.1 |
Histogram calculated using DETX and DETY for each event in the final _common_clean file
| Quadrant A | 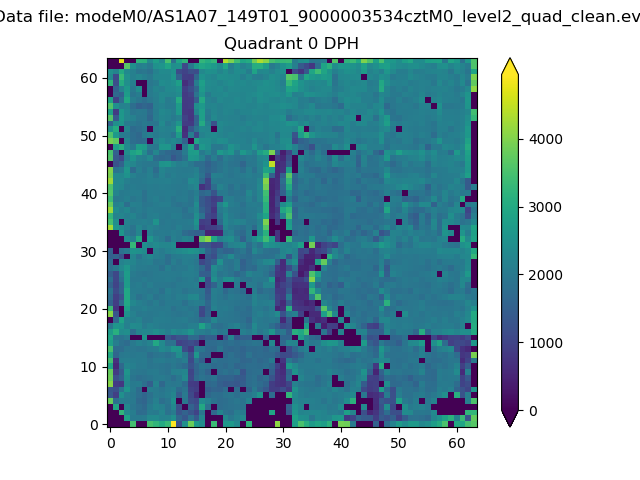 |
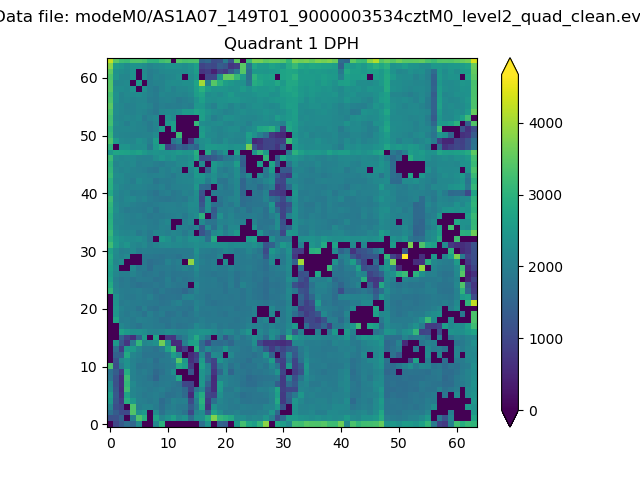 |
Quadrant B |
|---|---|---|---|
| Quadrant D |  |
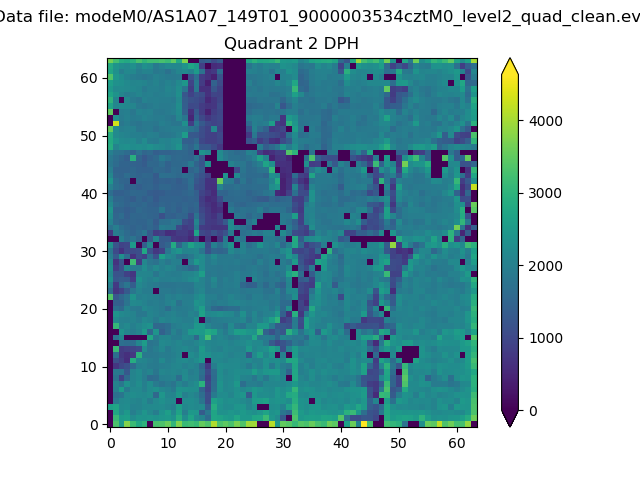 |
Quadrant C |
| Plot type | Count rate plots | Images |
|---|---|---|
| Comparison with Poisson distribution Blue bars denote a histogram of data divided into 1 sec bins. Red curve is a Poisson curve with rate = median count rate of data. |
 |
 |
| Quadrant-wise count rates Data is divided into 100 sec bins |
 |
|
| Module-wise count rates for Quadrant A Data is divided into 100 sec bins |
 |
 |
| Module-wise count rates for Quadrant B Data is divided into 100 sec bins |
 |
 |
| Module-wise count rates for Quadrant C Data is divided into 100 sec bins |
 |
 |
| Module-wise count rates for Quadrant D Data is divided into 100 sec bins |
 |
 |
| Parameter | Plot |
|---|---|
| CZT HV Monitor |  |
| D_VDD |  |
| Temperature 1 |  |
| Veto HV Monitor |  |
| Veto LLD | 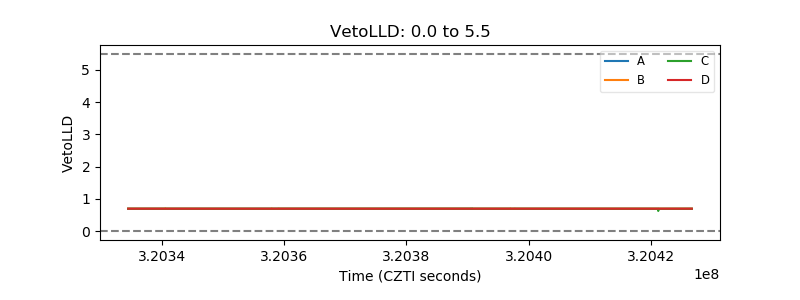 |
| Alpha Counter |  |
| _CPM_Rate |  |
| CZT Counter |  |
| +2.5 Volts monitor |  |
| +5 Volts monitor | 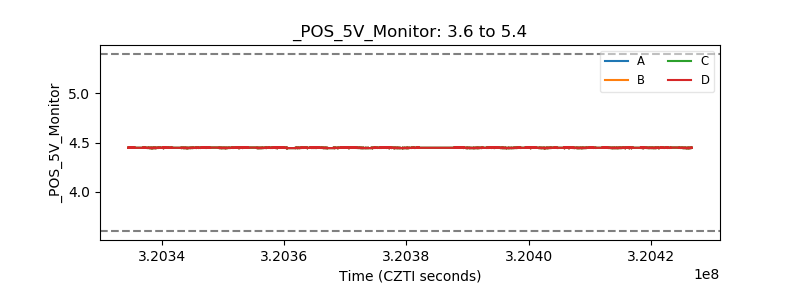 |
| _ROLL_ROT |  |
| _Roll_DEC |  |
| _Roll_RA |  |
| Veto Counter |  |