| Param | Original file | Final file |
|---|---|---|
| Filename | modeM0/AS1A07_149T01_9000003534_23853cztM0_level2.evt | modeM0/AS1A07_149T01_9000003534_23853cztM0_level2_quad_clean.evt |
| Size (bytes) | 496,817,280 | 114,984,000 |
| Size | 473.8 MB | 109.7 MB |
| Events in quadrant A | 3,445,182 | 777,943 |
| Events in quadrant B | 3,479,272 | 785,579 |
| Events in quadrant C | 3,539,761 | 732,719 |
| Events in quadrant D | 4,130,118 | 722,356 |
| Mode M0 | |||
|---|---|---|---|
| Quadrant | BADHDUFLAG | Total packets | Discarded packets |
| A | 0 | 16076 | 1525 |
| B | 0 | 16099 | 1544 |
| C | 0 | 16446 | 1618 |
| D | 0 | 18329 | 1570 |
| Mode SS | |||
|---|---|---|---|
| Quadrant | BADHDUFLAG | Total packets | Discarded packets |
| A | 0 | 152 | 20 |
| B | 0 | 152 | 22 |
| C | 0 | 152 | 18 |
| D | 0 | 152 | 22 |
| Mode M9 | |||
|---|---|---|---|
| Quadrant | BADHDUFLAG | Total packets | Discarded packets |
| A | 0 | 26 | 2 |
| B | 0 | 25 | 1 |
| C | 0 | 25 | 1 |
| D | 0 | 25 | 2 |
| Quadrant | Total seconds | Saturated seconds | Saturation percentage |
|---|---|---|---|
| A | 6673 | 87 | 1.303761% |
| B | 6662 | 97 | 1.456019% |
| C | 6666 | 118 | 1.770177% |
| D | 6661 | 248 | 3.723165% |
Noise dominated data is calculated using 1-second bins in cleaned event files. If a bin has >2000 counts, and if more than 50% of those come from <1% of pixels, then it is considered to be noise-dominated and hence unusable.
| Quadrant | # 1 sec bins | Bins with >0 counts | Bins with >2000 counts | High rate bins dominated by noise | Noise dominated (total time) | Noise dominated (detector-on time) | Marked lightcurve |
|---|---|---|---|---|---|---|---|
| A | 9922 | 6787 | 0 | 0 | 0.00% | 0.00% | 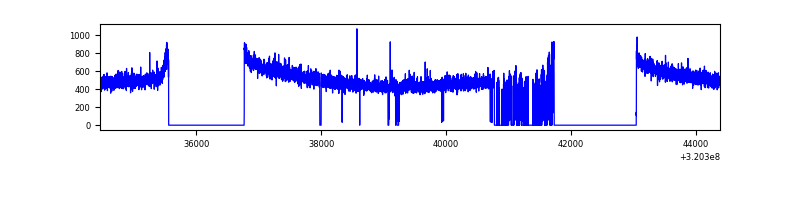 |
| B | 9921 | 6788 | 2 | 2 | 0.02% | 0.03% | 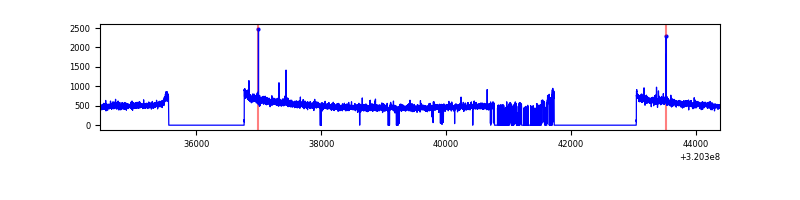 |
| C | 9921 | 6786 | 3 | 3 | 0.03% | 0.04% | 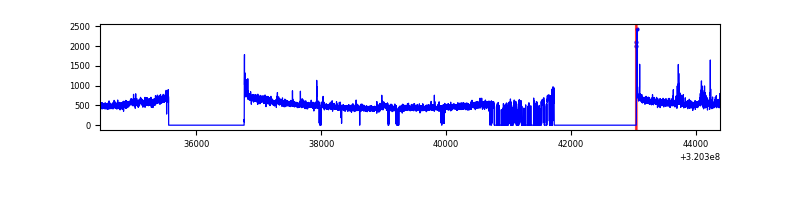 |
| D | 9921 | 6792 | 64 | 64 | 0.65% | 0.94% | 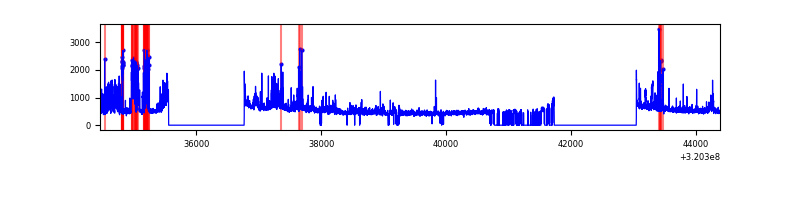 |
Top three noisy pixels from each quadrant. If the there are fewer than three noisy pixels in the level2.evt file, extra rows are filled as -1
| Pixel properties | Quadrant properties | ||||||
|---|---|---|---|---|---|---|---|
| Quadrant | DetID | PixID | Counts | Sigma | Mean | Median | Sigma |
| A | 13 | 254 | 12211 | 63.8 | 893 | 876 | 177.7 |
| A | 0 | 226 | 8144 | 40.91 | 893 | 876 | 177.7 |
| A | 3 | 137 | 7145 | 35.29 | 893 | 876 | 177.7 |
| B | 12 | 111 | 18664 | 108.77 | 882 | 863 | 163.7 |
| B | 11 | 111 | 16332 | 94.52 | 882 | 863 | 163.7 |
| B | 14 | 111 | 14385 | 82.63 | 882 | 863 | 163.7 |
| C | 14 | 238 | 135761 | 709.28 | 831 | 835 | 190.2 |
| C | 7 | 247 | 91139 | 474.71 | 831 | 835 | 190.2 |
| C | 0 | 10 | 63548 | 329.67 | 831 | 835 | 190.2 |
| D | 1 | 52 | 624797 | 3076.33 | 844 | 819 | 202.8 |
| D | 8 | 195 | 184415 | 905.16 | 844 | 819 | 202.8 |
| D | 12 | 218 | 60967 | 296.54 | 844 | 819 | 202.8 |
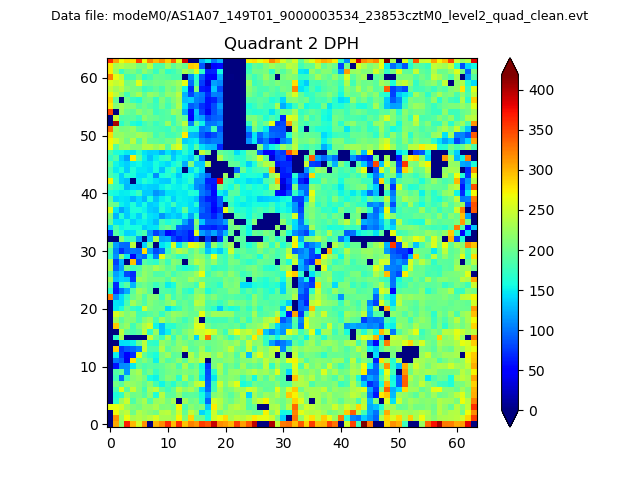
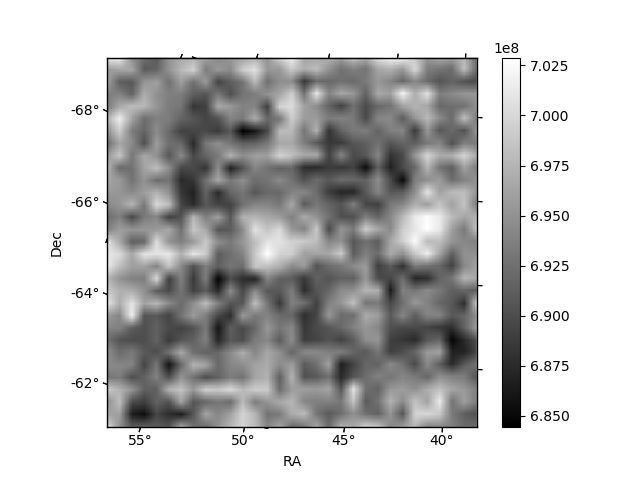
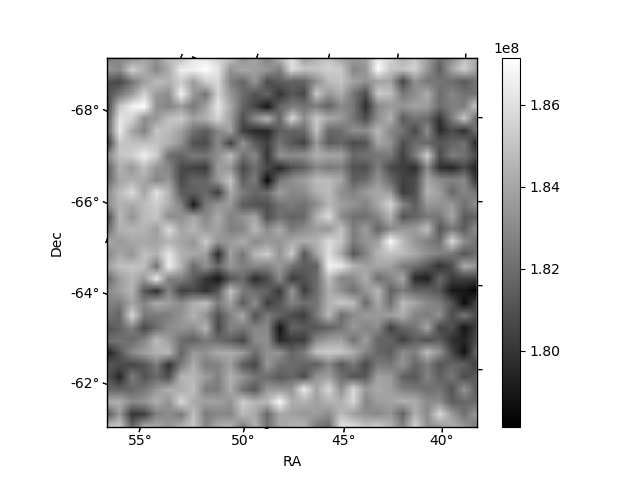
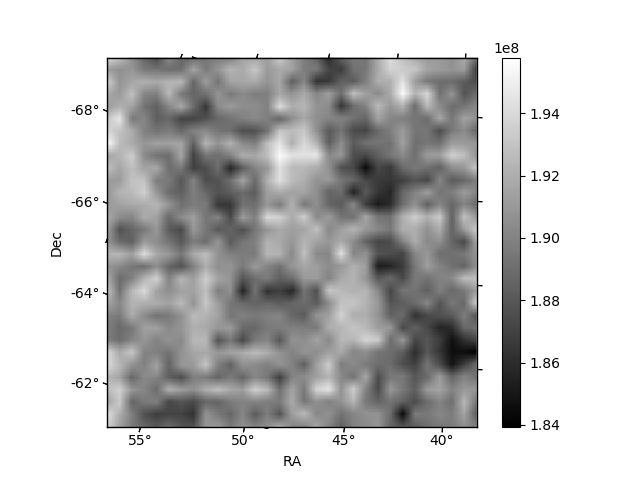
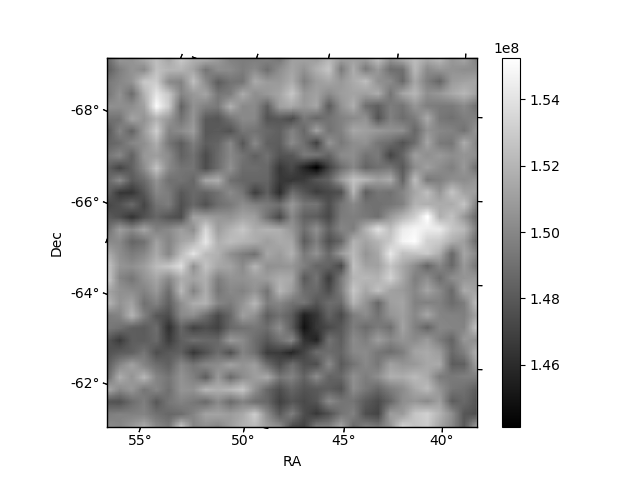
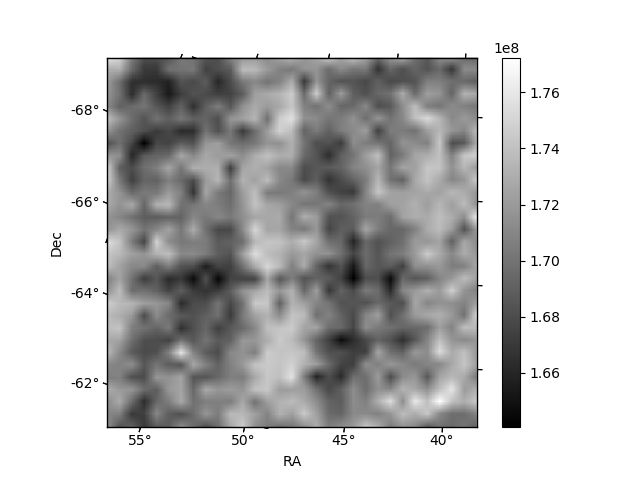
Histogram calculated using DETX and DETY for each event in the final _common_clean file
| Quadrant A | 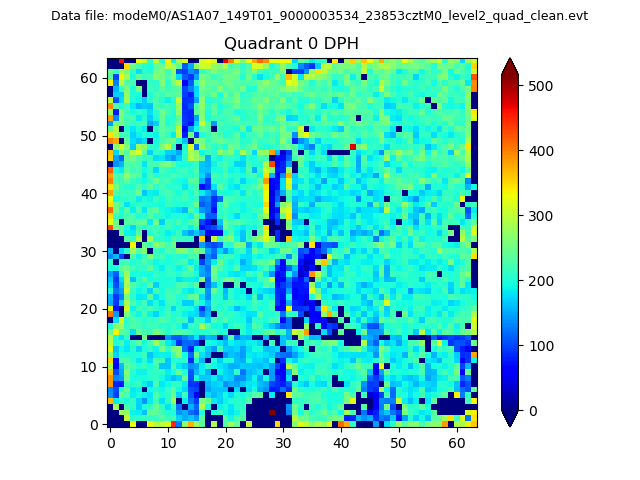 |
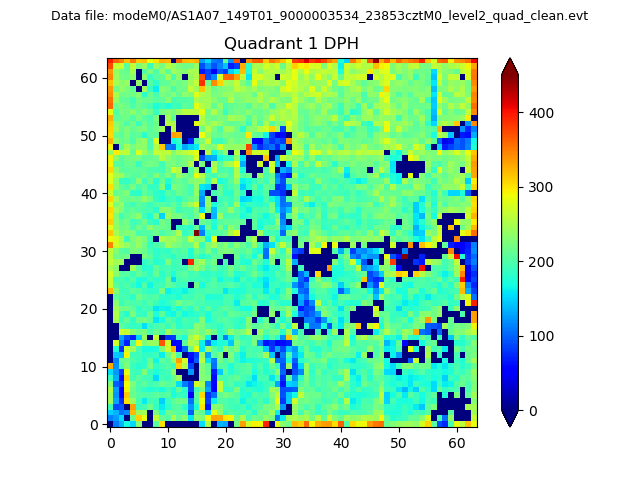 |
Quadrant B |
|---|---|---|---|
| Quadrant D | 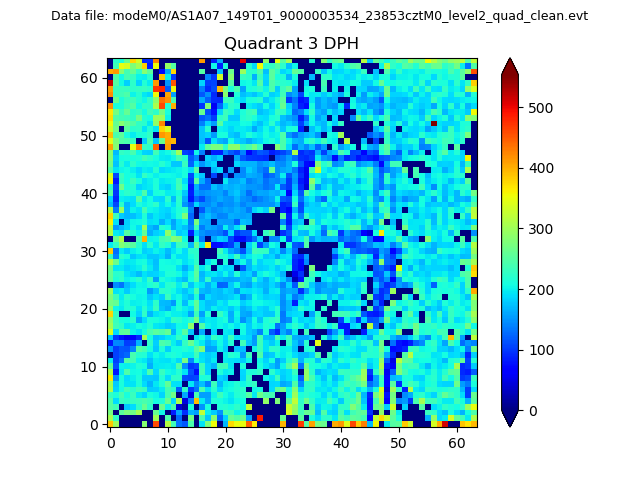 |
 |
Quadrant C |
| Plot type | Count rate plots | Images |
|---|---|---|
| Comparison with Poisson distribution Blue bars denote a histogram of data divided into 1 sec bins. Red curve is a Poisson curve with rate = median count rate of data. |
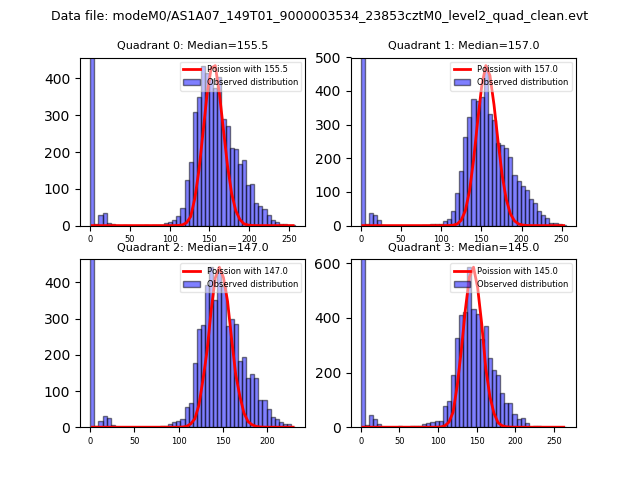 |
 |
| Quadrant-wise count rates Data is divided into 100 sec bins |
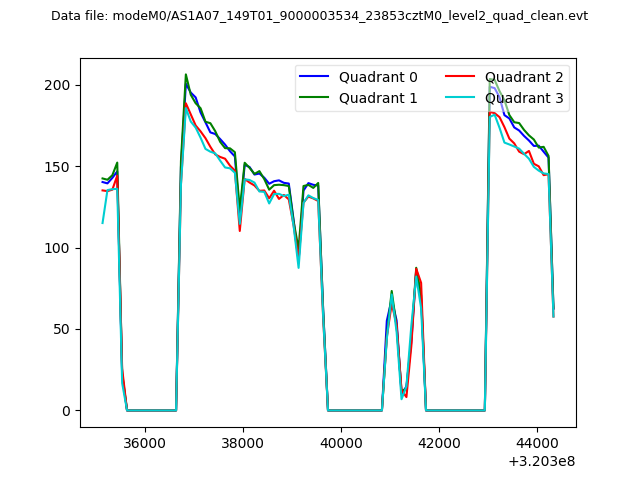 |
|
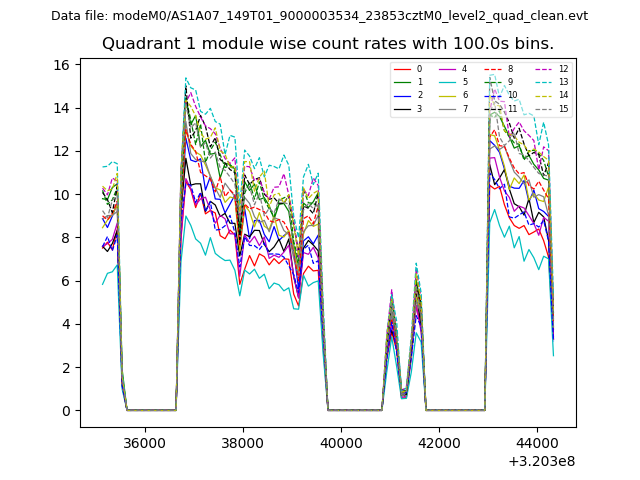
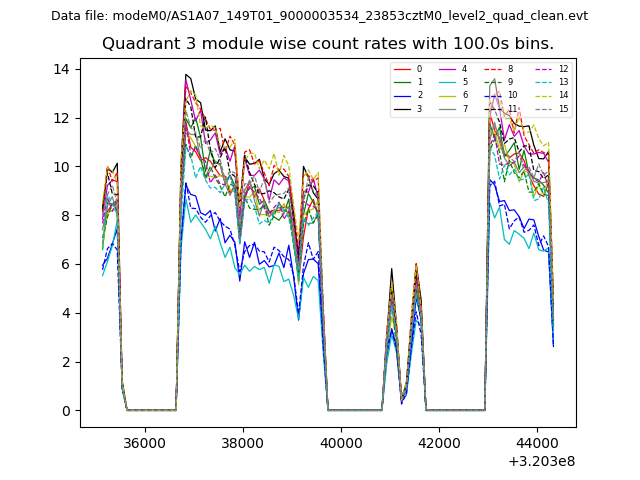
| Module-wise count rates for Quadrant A Data is divided into 100 sec bins |
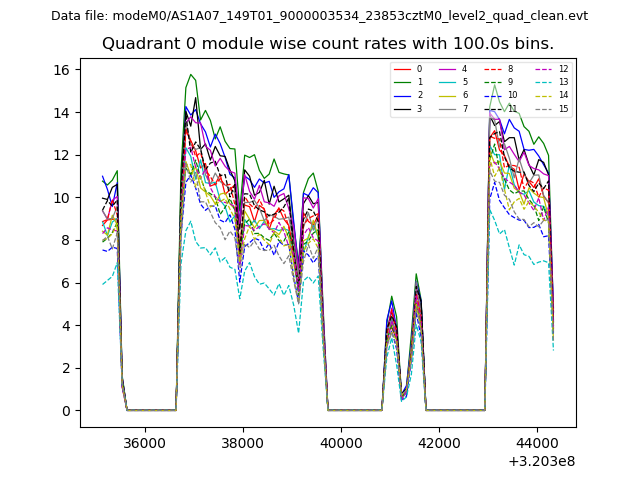 |
 |
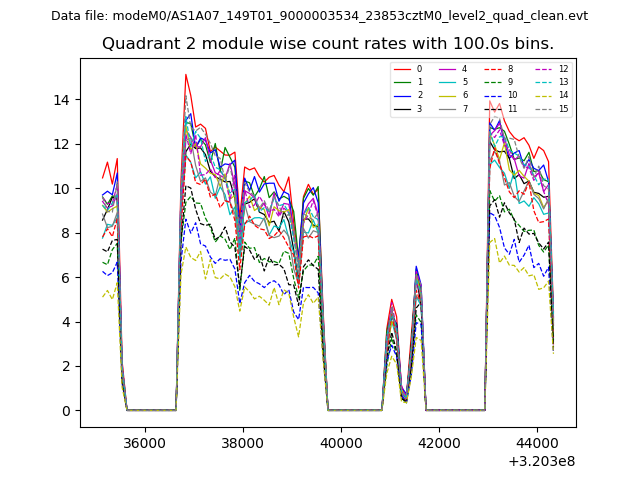
| Module-wise count rates for Quadrant B Data is divided into 100 sec bins |
 |
 |
| Module-wise count rates for Quadrant C Data is divided into 100 sec bins |
 |
 |
| Module-wise count rates for Quadrant D Data is divided into 100 sec bins |
 |
 |
| Parameter | Plot |
|---|---|
| CZT HV Monitor | 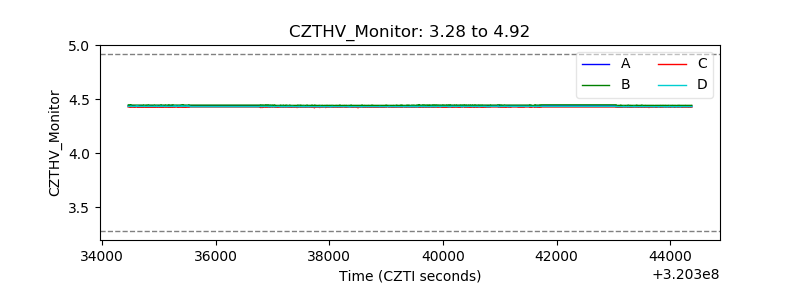 |
| D_VDD | 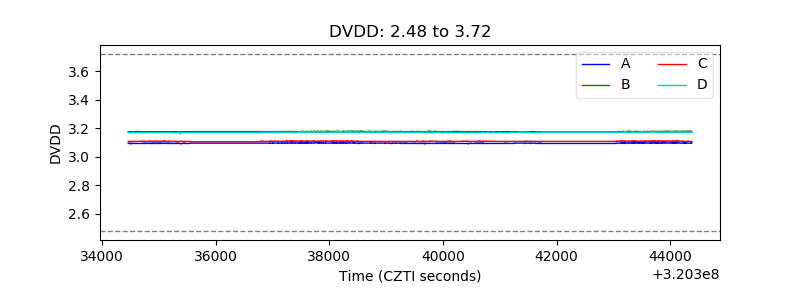 |
| Temperature 1 | 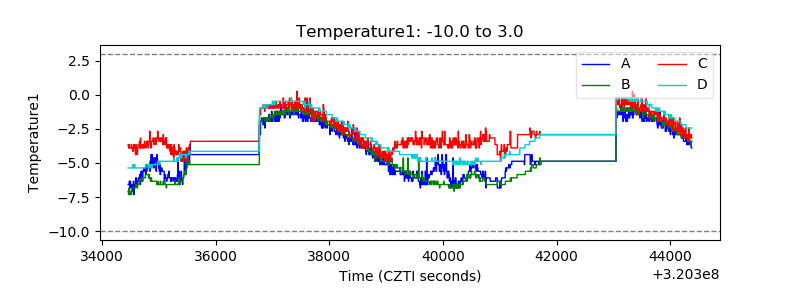 |
| Veto HV Monitor | 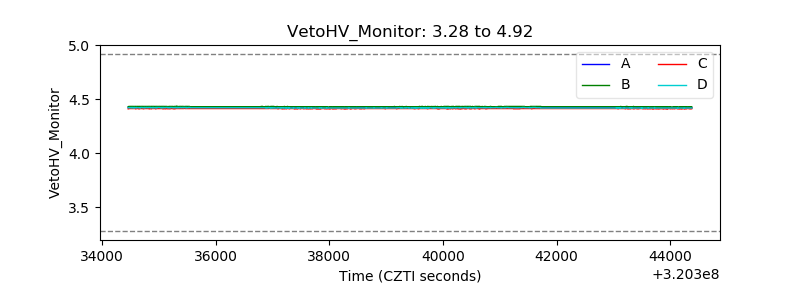 |
| Veto LLD | 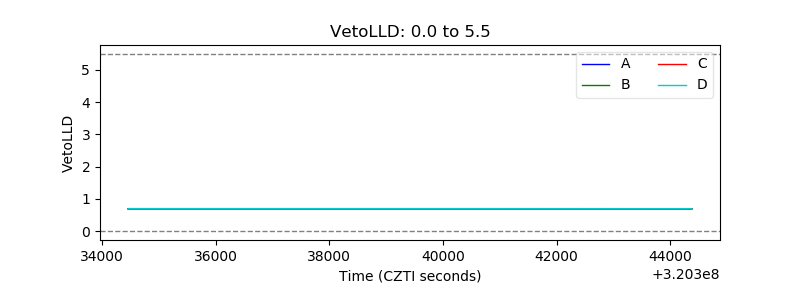 |
| Alpha Counter | 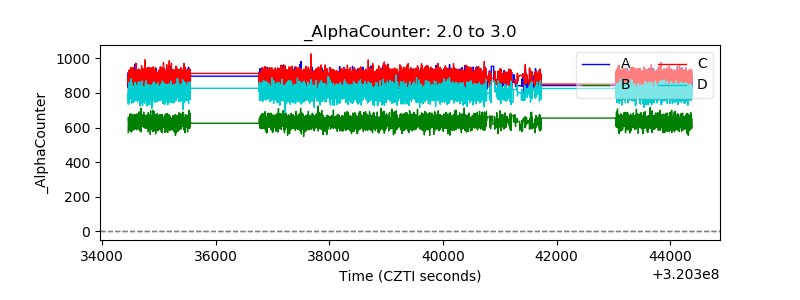 |
| _CPM_Rate | 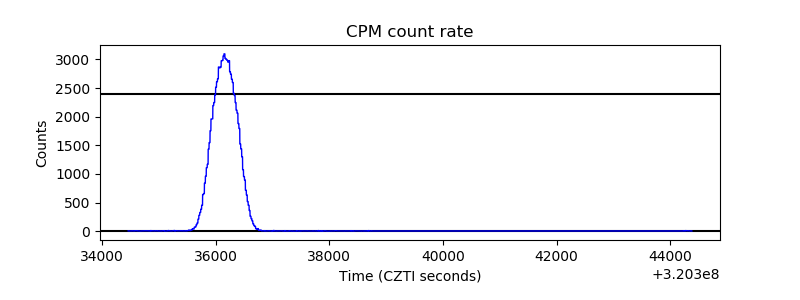 |
| CZT Counter | 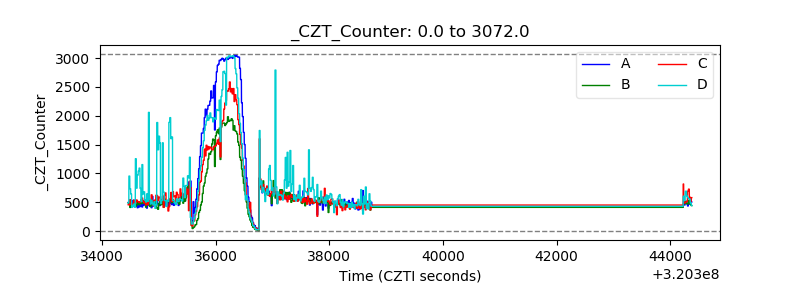 |
| +2.5 Volts monitor |  |
| +5 Volts monitor |  |
| _ROLL_ROT | 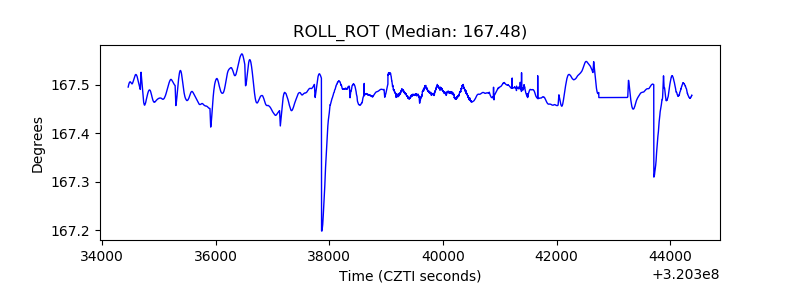 |
| _Roll_DEC | 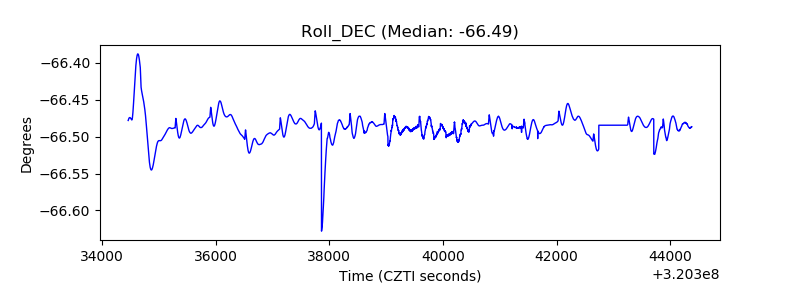 |
| _Roll_RA | 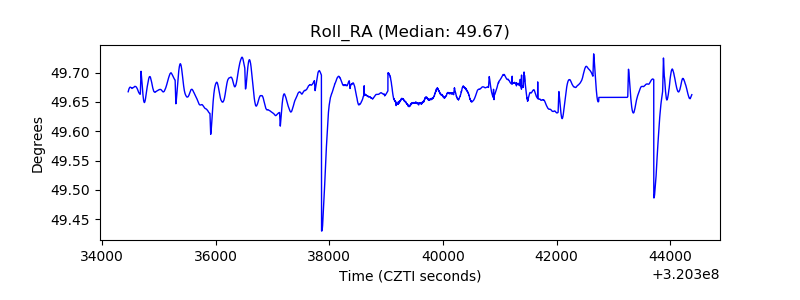 |
| Veto Counter | 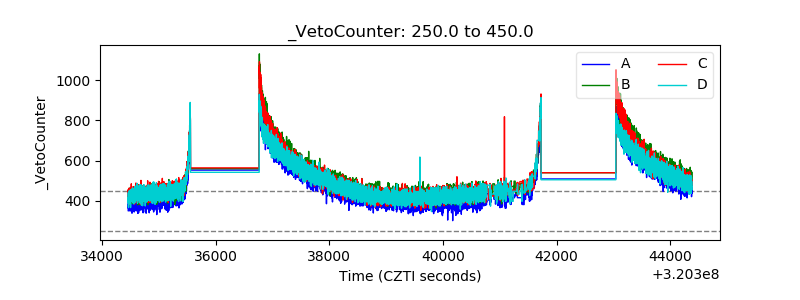 |