| Param | Original file | Final file |
|---|---|---|
| Filename | modeM0/AS1A07_149T01_9000003534_23855cztM0_level2.evt | modeM0/AS1A07_149T01_9000003534_23855cztM0_level2_quad_clean.evt |
| Size (bytes) | 467,421,120 | 108,161,280 |
| Size | 445.8 MB | 103.2 MB |
| Events in quadrant A | 3,043,510 | 731,989 |
| Events in quadrant B | 3,192,999 | 745,432 |
| Events in quadrant C | 3,203,890 | 698,108 |
| Events in quadrant D | 4,302,054 | 675,115 |
| Mode M0 | |||
|---|---|---|---|
| Quadrant | BADHDUFLAG | Total packets | Discarded packets |
| A | 0 | 12816 | 1 |
| B | 0 | 13284 | 1 |
| C | 0 | 13350 | 1 |
| D | 0 | 16998 | 1 |
| Mode SS | |||
|---|---|---|---|
| Quadrant | BADHDUFLAG | Total packets | Discarded packets |
| A | 0 | 122 | 0 |
| B | 0 | 122 | 0 |
| C | 0 | 122 | 0 |
| D | 0 | 122 | 0 |
| Mode M9 | |||
|---|---|---|---|
| Quadrant | BADHDUFLAG | Total packets | Discarded packets |
| A | 0 | 14 | 0 |
| B | 0 | 14 | 0 |
| C | 0 | 14 | 0 |
| D | 0 | 14 | 0 |
| Quadrant | Total seconds | Saturated seconds | Saturation percentage |
|---|---|---|---|
| A | 6095 | 44 | 0.721903% |
| B | 6096 | 84 | 1.377953% |
| C | 6096 | 93 | 1.525591% |
| D | 6095 | 162 | 2.657916% |
Noise dominated data is calculated using 1-second bins in cleaned event files. If a bin has >2000 counts, and if more than 50% of those come from <1% of pixels, then it is considered to be noise-dominated and hence unusable.
| Quadrant | # 1 sec bins | Bins with >0 counts | Bins with >2000 counts | High rate bins dominated by noise | Noise dominated (total time) | Noise dominated (detector-on time) | Marked lightcurve |
|---|---|---|---|---|---|---|---|
| A | 7430 | 6096 | 0 | 0 | 0.00% | 0.00% | 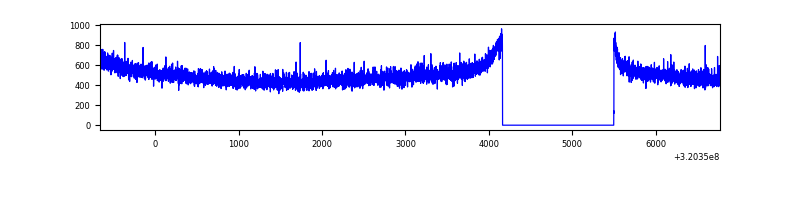 |
| B | 7431 | 6097 | 16 | 16 | 0.22% | 0.26% | 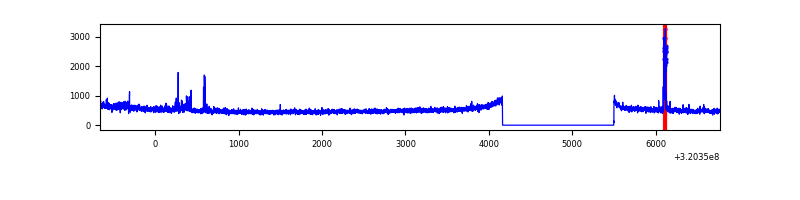 |
| C | 7431 | 6097 | 6 | 6 | 0.08% | 0.10% | 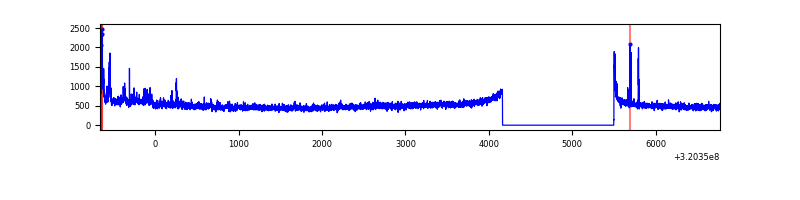 |
| D | 7430 | 6096 | 114 | 114 | 1.53% | 1.87% | 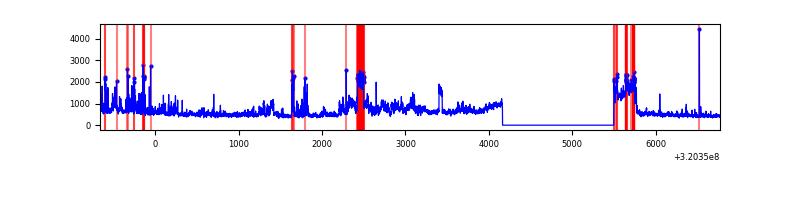 |
Top three noisy pixels from each quadrant. If the there are fewer than three noisy pixels in the level2.evt file, extra rows are filled as -1
| Pixel properties | Quadrant properties | ||||||
|---|---|---|---|---|---|---|---|
| Quadrant | DetID | PixID | Counts | Sigma | Mean | Median | Sigma |
| A | 13 | 254 | 11021 | 65.43 | 788 | 775 | 156.6 |
| A | 0 | 226 | 6820 | 38.6 | 788 | 775 | 156.6 |
| A | 3 | 137 | 6520 | 36.69 | 788 | 775 | 156.6 |
| B | 15 | 32 | 99455 | 684.88 | 786 | 769 | 144.1 |
| B | 12 | 111 | 16412 | 108.56 | 786 | 769 | 144.1 |
| B | 11 | 111 | 14380 | 94.46 | 786 | 769 | 144.1 |
| C | 14 | 238 | 122520 | 714.33 | 741 | 745 | 170.5 |
| C | 0 | 10 | 110110 | 641.53 | 741 | 745 | 170.5 |
| C | 7 | 247 | 66901 | 388.07 | 741 | 745 | 170.5 |
| D | 13 | 174 | 578567 | 3232.82 | 742 | 721 | 178.7 |
| D | 1 | 52 | 512964 | 2865.79 | 742 | 721 | 178.7 |
| D | 8 | 195 | 177526 | 989.15 | 742 | 721 | 178.7 |
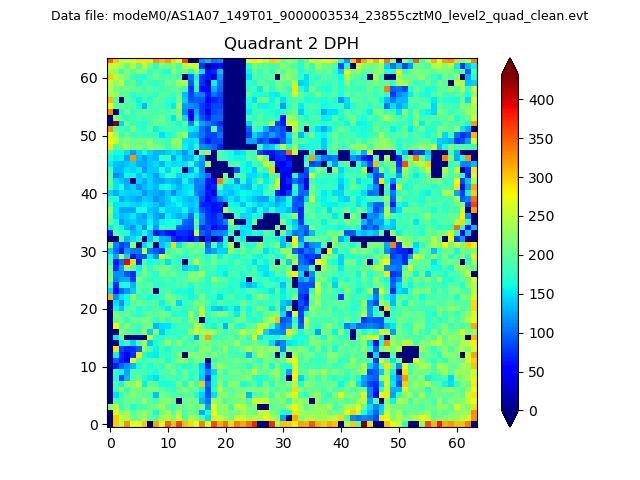
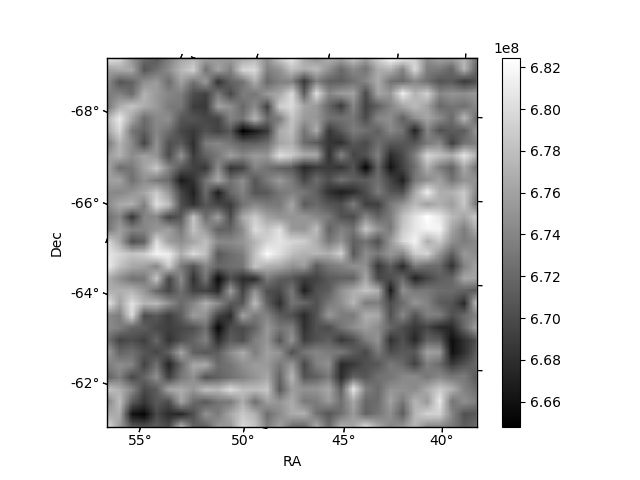
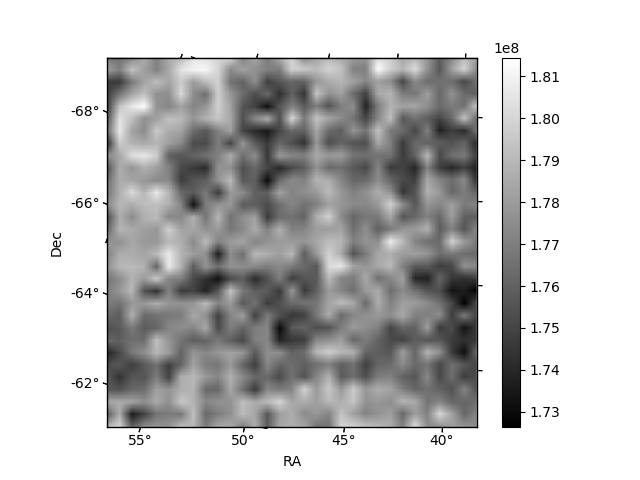
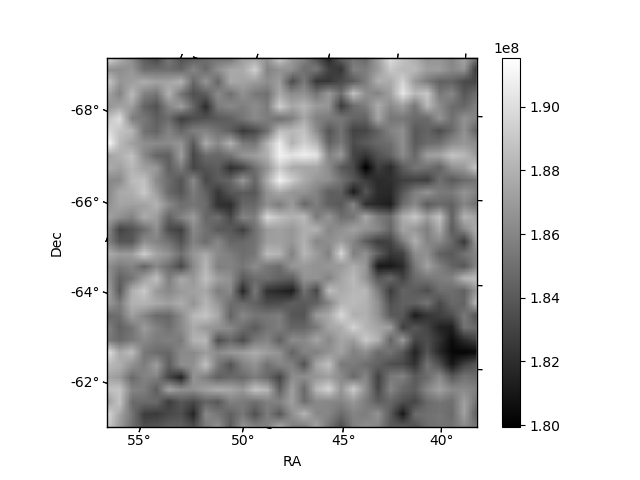
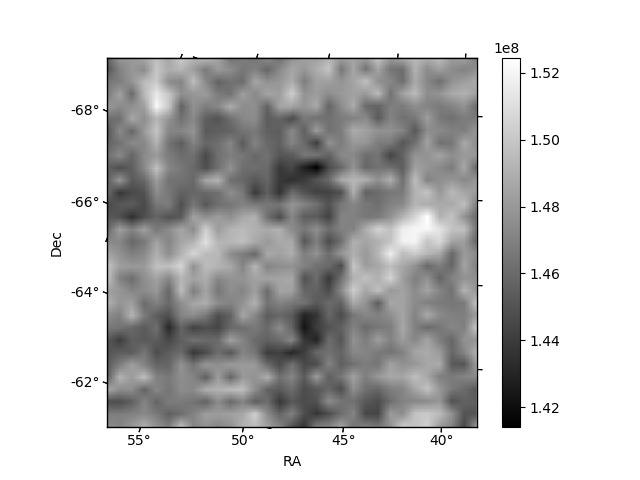
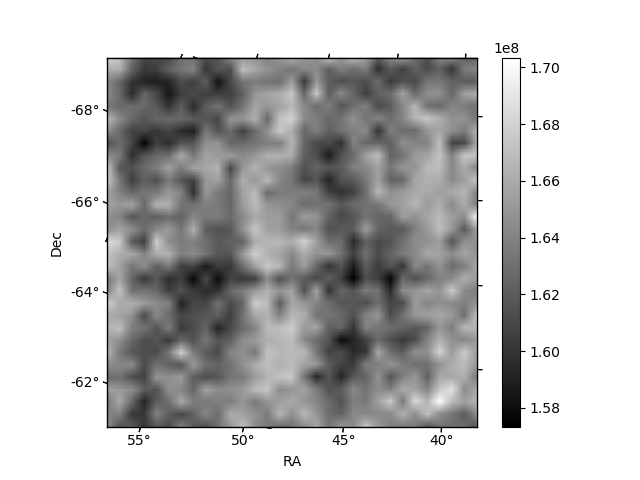
Histogram calculated using DETX and DETY for each event in the final _common_clean file
| Quadrant A | 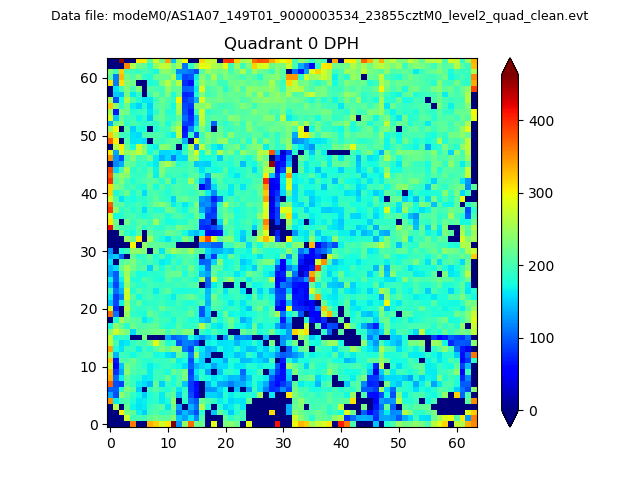 |
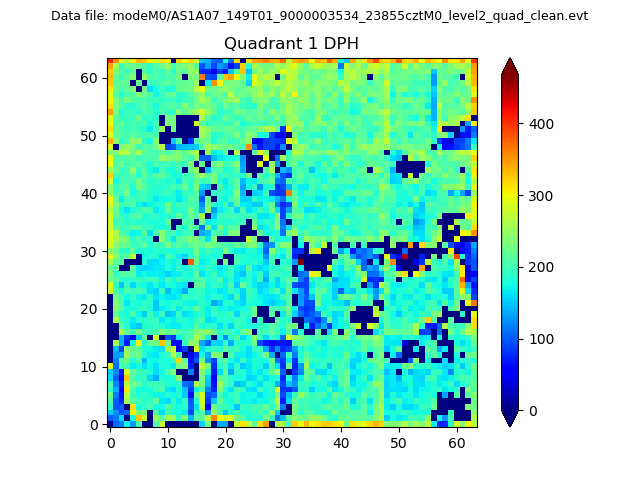 |
Quadrant B |
|---|---|---|---|
| Quadrant D | 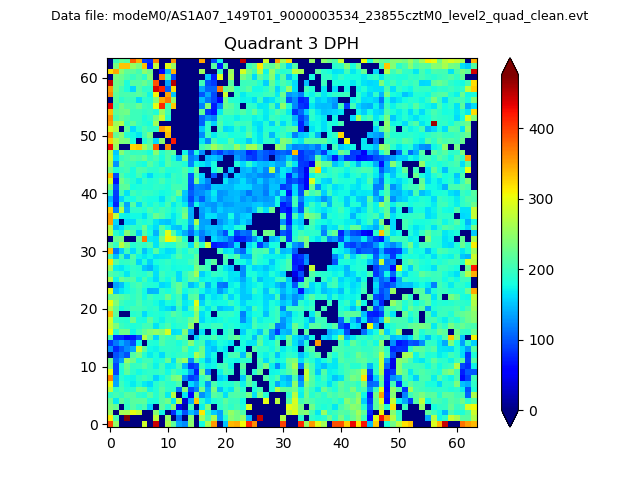 |
 |
Quadrant C |
| Plot type | Count rate plots | Images |
|---|---|---|
| Comparison with Poisson distribution Blue bars denote a histogram of data divided into 1 sec bins. Red curve is a Poisson curve with rate = median count rate of data. |
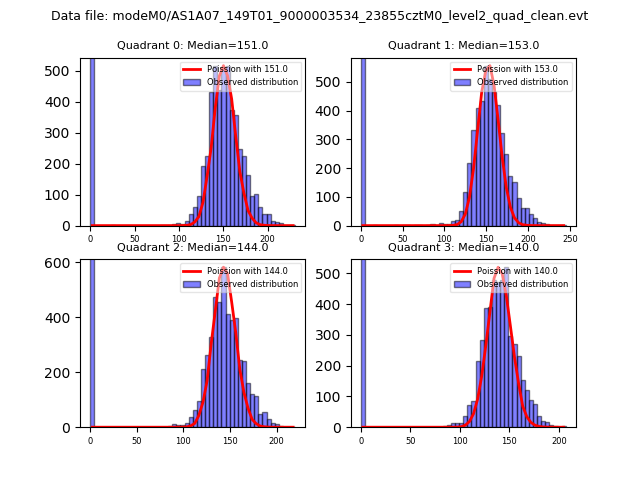 |
 |
| Quadrant-wise count rates Data is divided into 100 sec bins |
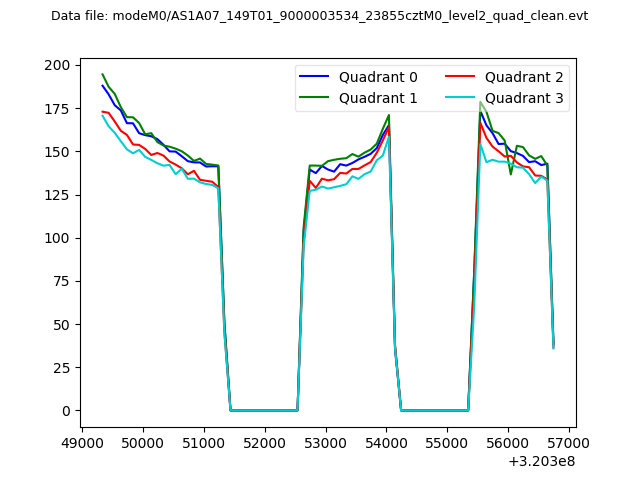 |
|
| Module-wise count rates for Quadrant A Data is divided into 100 sec bins |
 |
 |
| Module-wise count rates for Quadrant B Data is divided into 100 sec bins |
 |
 |
| Module-wise count rates for Quadrant C Data is divided into 100 sec bins |
 |
 |
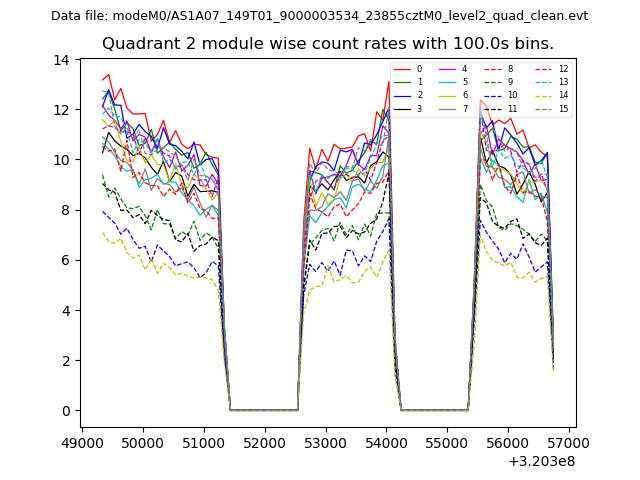
| Module-wise count rates for Quadrant D Data is divided into 100 sec bins |
 |
 |
| Parameter | Plot |
|---|---|
| CZT HV Monitor |  |
| D_VDD | 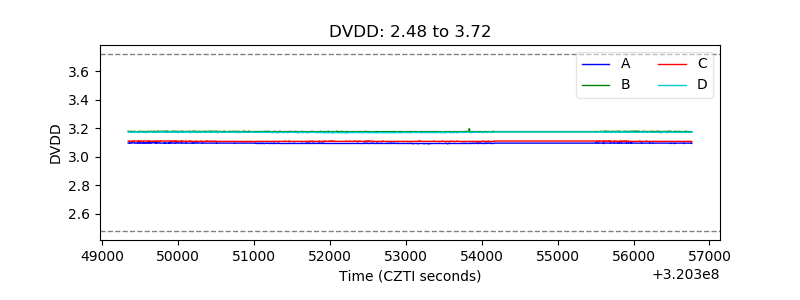 |
| Temperature 1 | 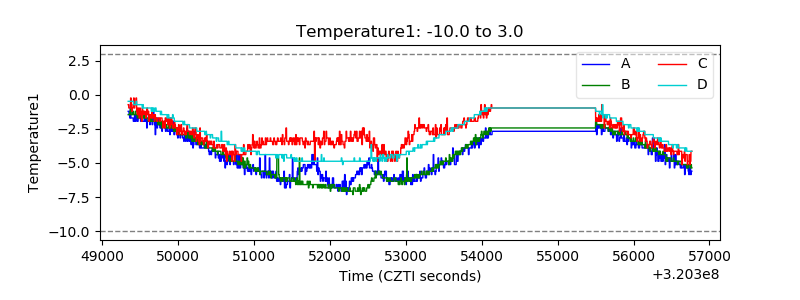 |
| Veto HV Monitor | 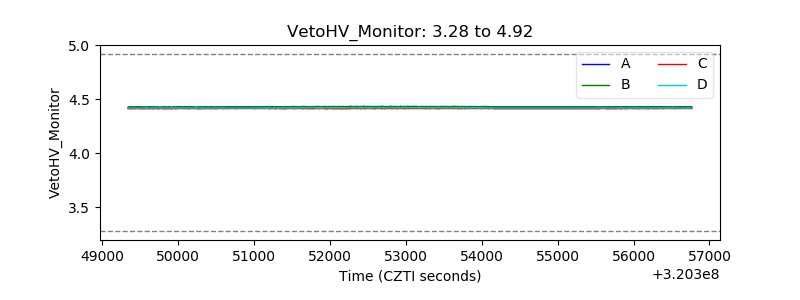 |
| Veto LLD | 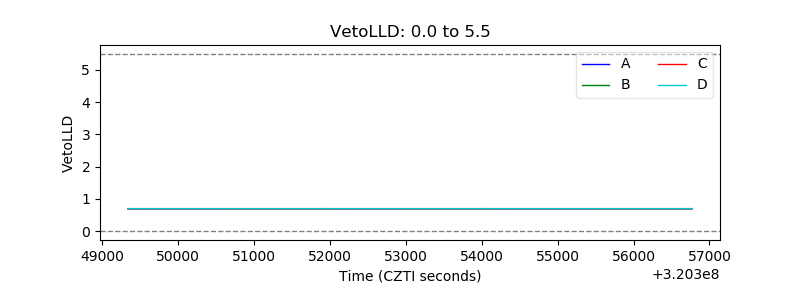 |
| Alpha Counter | 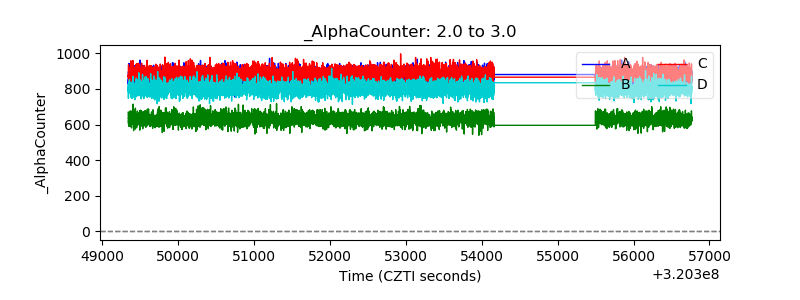 |
| _CPM_Rate | 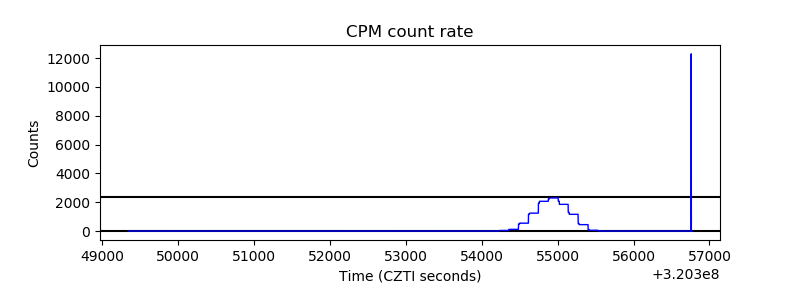 |
| CZT Counter | 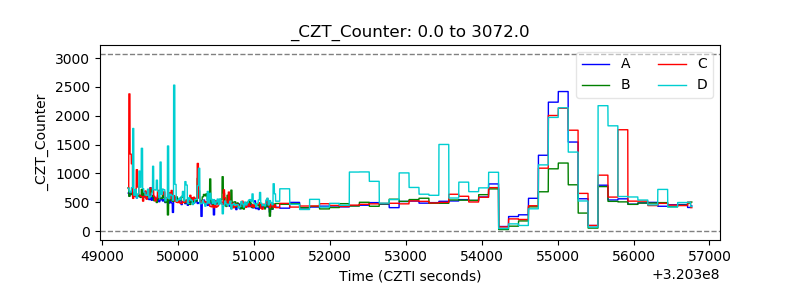 |
| +2.5 Volts monitor |  |
| +5 Volts monitor |  |
| _ROLL_ROT | 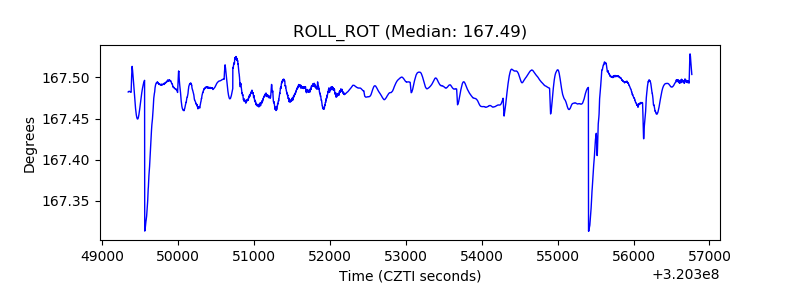 |
| _Roll_DEC | 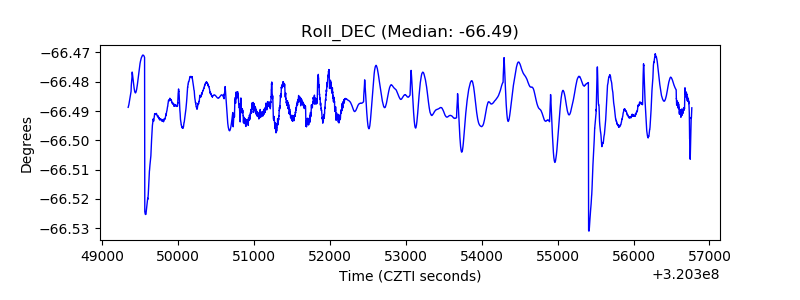 |
| _Roll_RA | 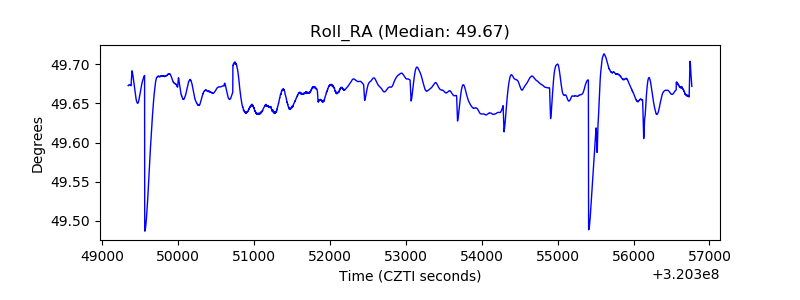 |
| Veto Counter | 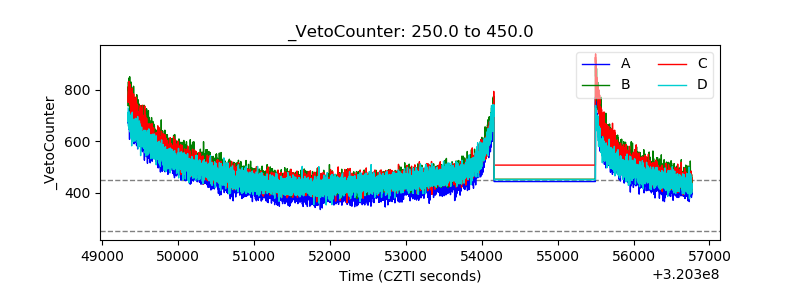 |