| Param | Original file | Final file |
|---|---|---|
| Filename | modeM0/AS1A07_149T01_9000003534_23857cztM0_level2.evt | modeM0/AS1A07_149T01_9000003534_23857cztM0_level2_quad_clean.evt |
| Size (bytes) | 448,856,640 | 103,953,600 |
| Size | 428.1 MB | 99.1 MB |
| Events in quadrant A | 3,129,356 | 680,266 |
| Events in quadrant B | 3,283,055 | 692,895 |
| Events in quadrant C | 3,468,458 | 657,890 |
| Events in quadrant D | 3,253,742 | 646,688 |
| Mode M0 | |||
|---|---|---|---|
| Quadrant | BADHDUFLAG | Total packets | Discarded packets |
| A | 0 | 13759 | 2 |
| B | 0 | 14081 | 2 |
| C | 0 | 14307 | 2 |
| D | 0 | 14284 | 2 |
| Mode SS | |||
|---|---|---|---|
| Quadrant | BADHDUFLAG | Total packets | Discarded packets |
| A | 0 | 138 | 0 |
| B | 0 | 138 | 0 |
| C | 0 | 138 | 0 |
| D | 0 | 138 | 0 |
| Mode M9 | |||
|---|---|---|---|
| Quadrant | BADHDUFLAG | Total packets | Discarded packets |
| A | 0 | 15 | 0 |
| B | 0 | 16 | 0 |
| C | 0 | 16 | 0 |
| D | 0 | 16 | 0 |
| Quadrant | Total seconds | Saturated seconds | Saturation percentage |
|---|---|---|---|
| A | 6749 | 34 | 0.503778% |
| B | 6749 | 47 | 0.696399% |
| C | 6749 | 85 | 1.259446% |
| D | 6749 | 30 | 0.444510% |
Noise dominated data is calculated using 1-second bins in cleaned event files. If a bin has >2000 counts, and if more than 50% of those come from <1% of pixels, then it is considered to be noise-dominated and hence unusable.
| Quadrant | # 1 sec bins | Bins with >0 counts | Bins with >2000 counts | High rate bins dominated by noise | Noise dominated (total time) | Noise dominated (detector-on time) | Marked lightcurve |
|---|---|---|---|---|---|---|---|
| A | 7579 | 6750 | 0 | 0 | 0.00% | 0.00% | 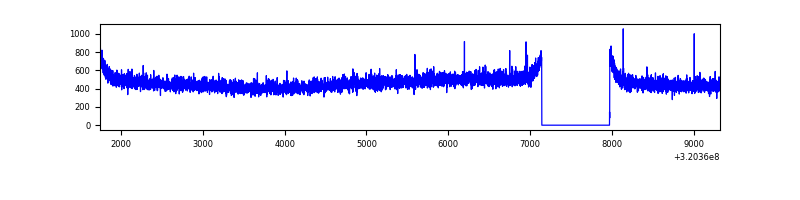 |
| B | 7579 | 6750 | 8 | 8 | 0.11% | 0.12% | 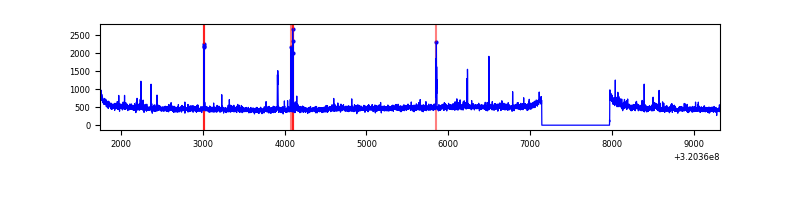 |
| C | 7579 | 6750 | 0 | 0 | 0.00% | 0.00% | 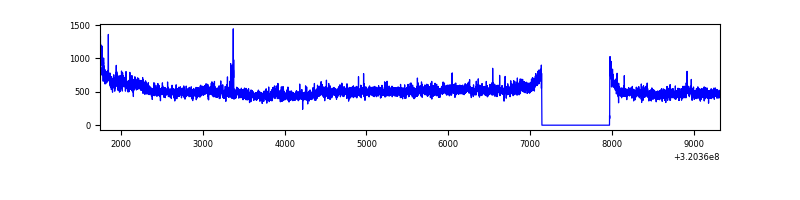 |
| D | 7579 | 6750 | 11 | 11 | 0.15% | 0.16% | 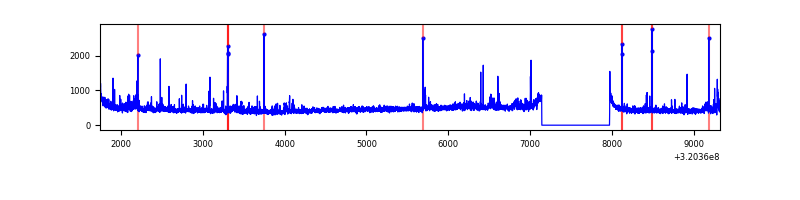 |
Top three noisy pixels from each quadrant. If the there are fewer than three noisy pixels in the level2.evt file, extra rows are filled as -1
| Pixel properties | Quadrant properties | ||||||
|---|---|---|---|---|---|---|---|
| Quadrant | DetID | PixID | Counts | Sigma | Mean | Median | Sigma |
| A | 13 | 254 | 11977 | 68.53 | 811 | 794 | 163.2 |
| A | 0 | 226 | 7090 | 38.58 | 811 | 794 | 163.2 |
| A | 3 | 137 | 7060 | 38.4 | 811 | 794 | 163.2 |
| B | 5 | 172 | 50047 | 323.67 | 811 | 792 | 152.2 |
| B | 7 | 202 | 19801 | 124.92 | 811 | 792 | 152.2 |
| B | 12 | 111 | 18077 | 113.59 | 811 | 792 | 152.2 |
| C | 7 | 247 | 319800 | 1775.33 | 772 | 775 | 179.7 |
| C | 14 | 238 | 123842 | 684.85 | 772 | 775 | 179.7 |
| C | 0 | 10 | 13551 | 71.1 | 772 | 775 | 179.7 |
| D | 8 | 195 | 142139 | 748.99 | 781 | 758 | 188.8 |
| D | 1 | 52 | 83259 | 437.06 | 781 | 758 | 188.8 |
| D | 2 | 234 | 27610 | 142.25 | 781 | 758 | 188.8 |
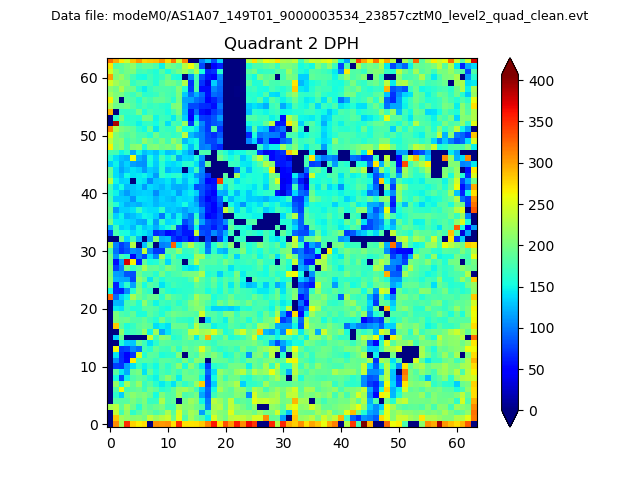
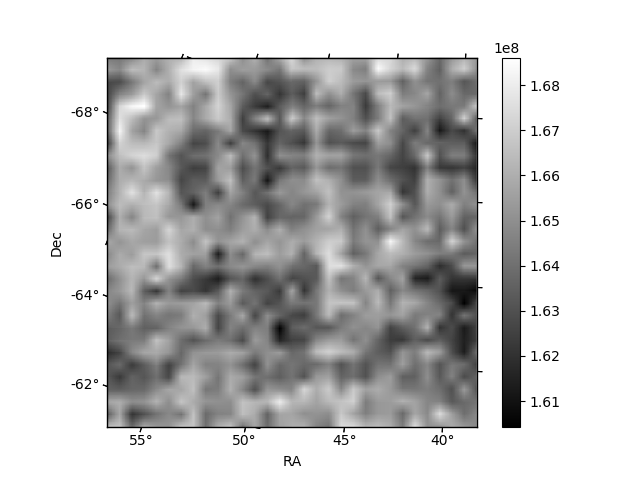
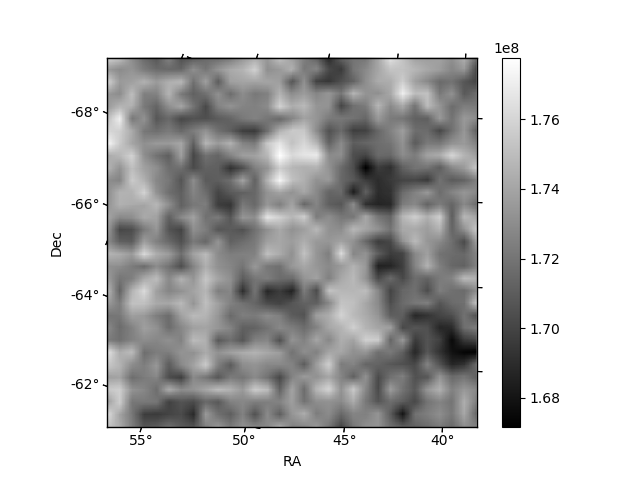
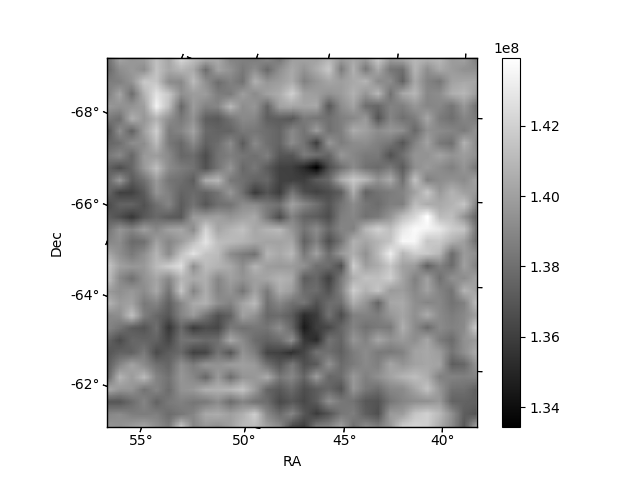
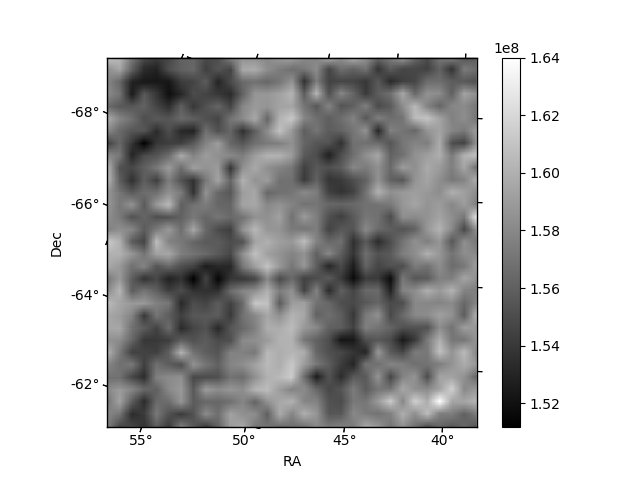
Histogram calculated using DETX and DETY for each event in the final _common_clean file
| Quadrant A | 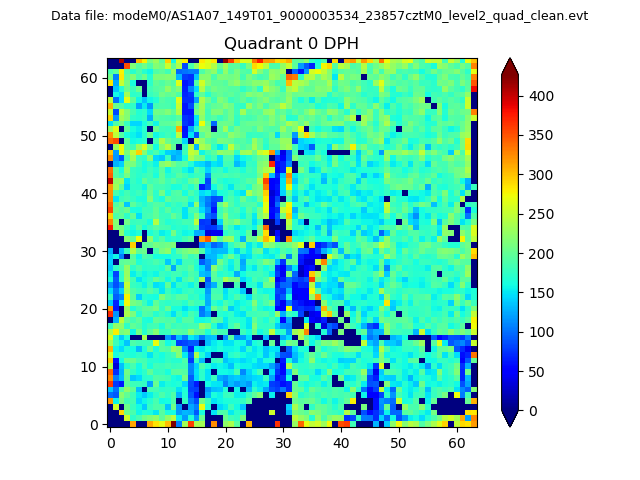 |
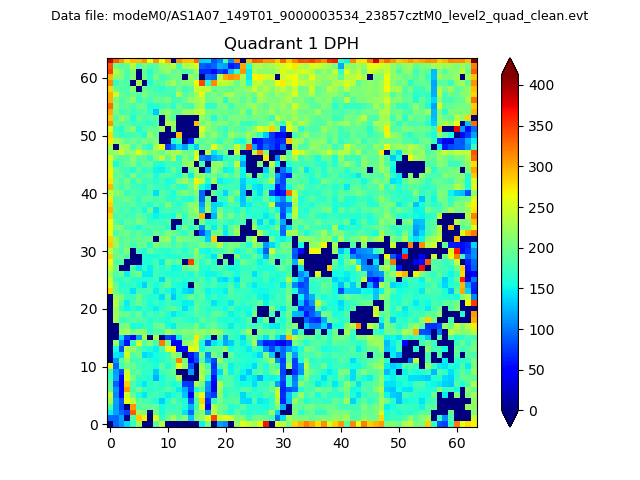 |
Quadrant B |
|---|---|---|---|
| Quadrant D | 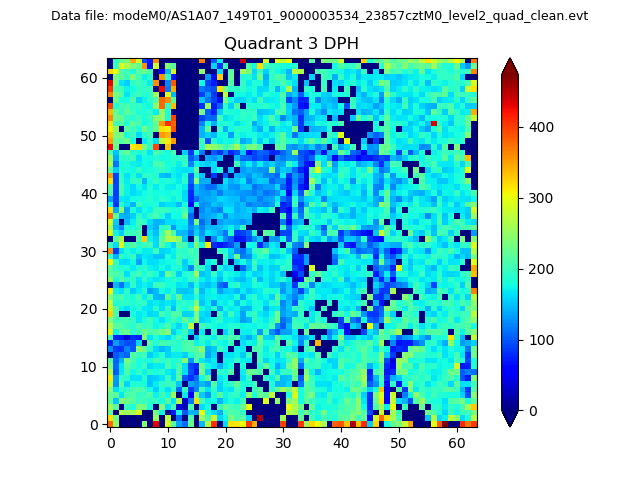 |
 |
Quadrant C |
| Plot type | Count rate plots | Images |
|---|---|---|
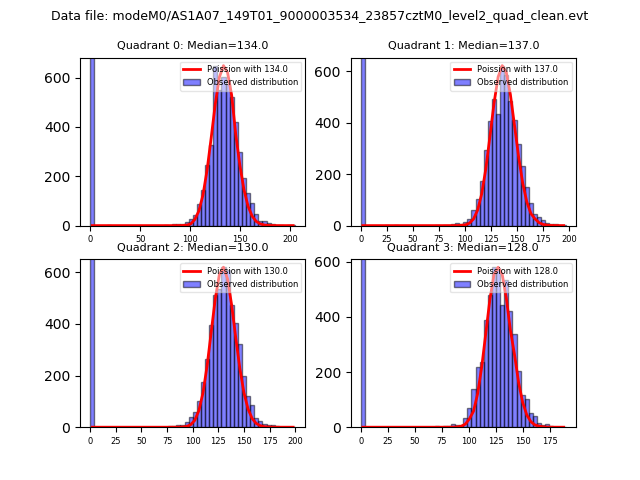
| Comparison with Poisson distribution Blue bars denote a histogram of data divided into 1 sec bins. Red curve is a Poisson curve with rate = median count rate of data. |
 |
 |
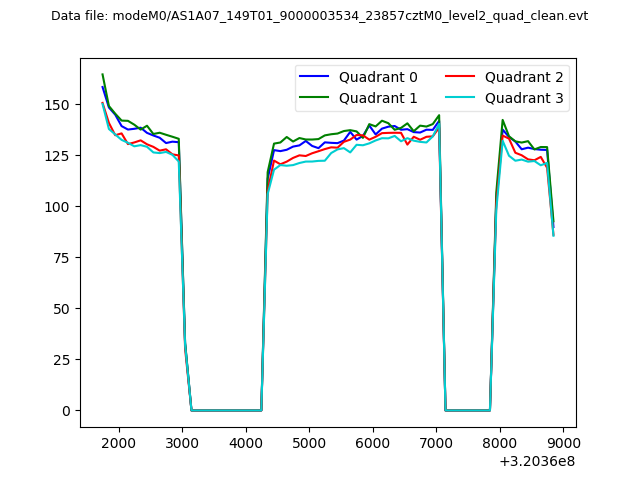
| Quadrant-wise count rates Data is divided into 100 sec bins |
 |
|
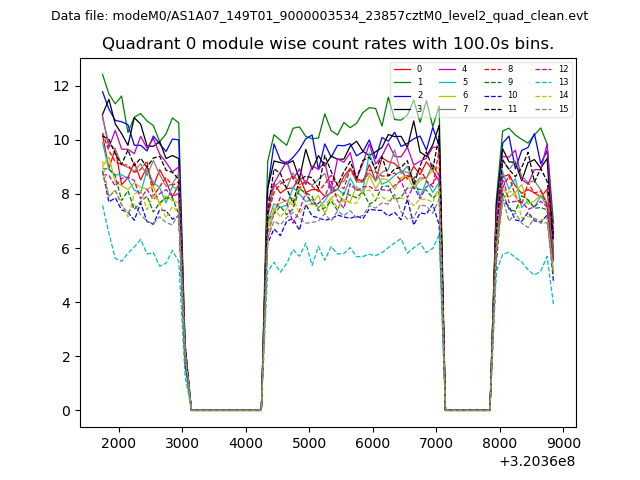
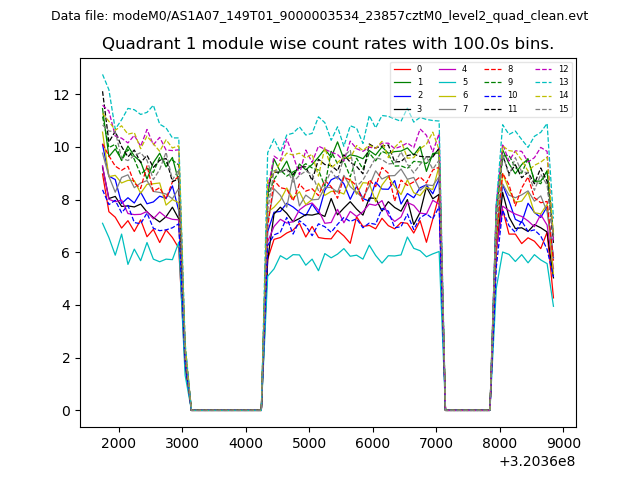
| Module-wise count rates for Quadrant A Data is divided into 100 sec bins |
 |
 |
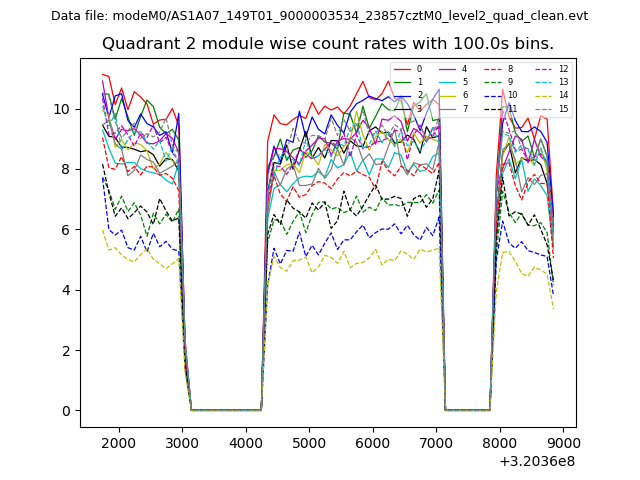
| Module-wise count rates for Quadrant B Data is divided into 100 sec bins |
 |
 |
| Module-wise count rates for Quadrant C Data is divided into 100 sec bins |
 |
 |
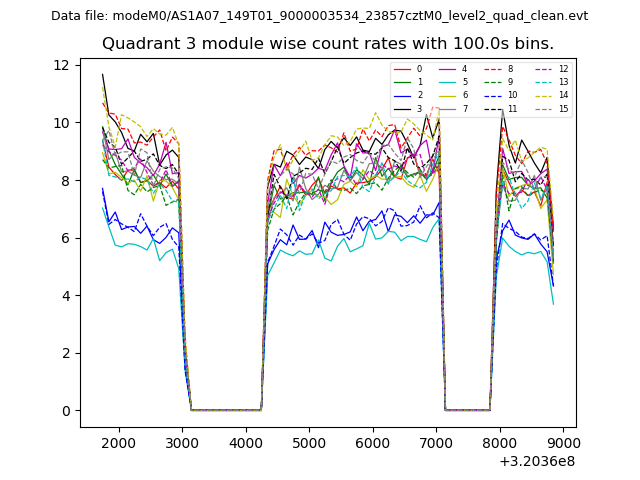
| Module-wise count rates for Quadrant D Data is divided into 100 sec bins |
 |
 |
| Parameter | Plot |
|---|---|
| CZT HV Monitor | 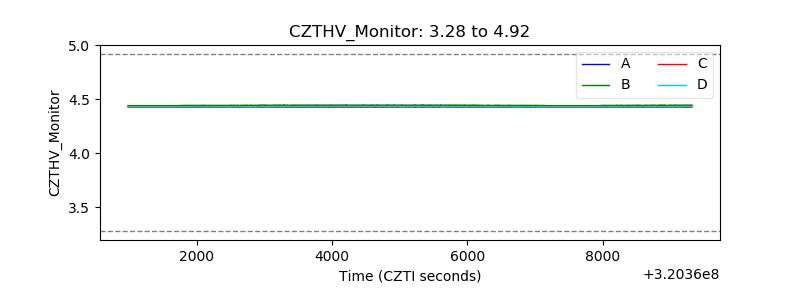 |
| D_VDD | 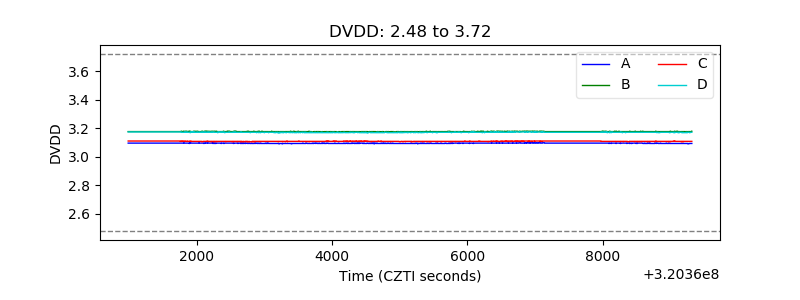 |
| Temperature 1 | 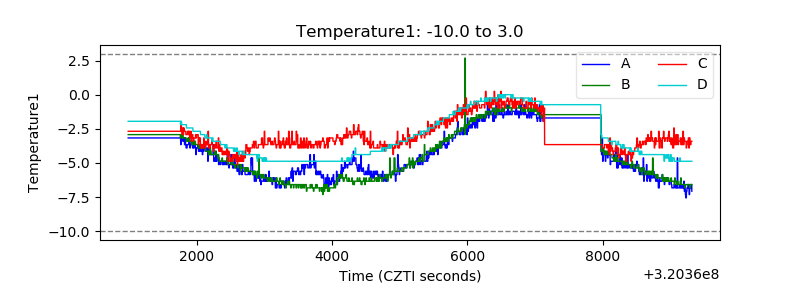 |
| Veto HV Monitor | 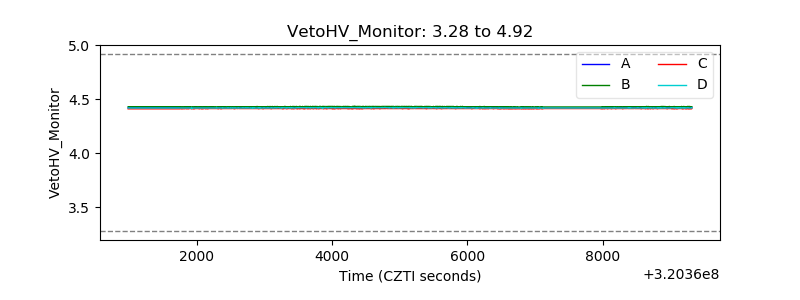 |
| Veto LLD | 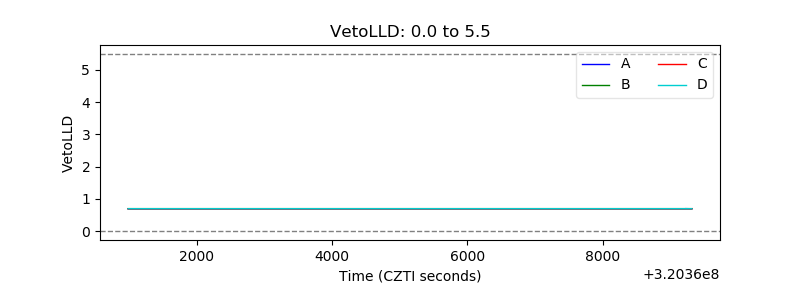 |
| Alpha Counter | 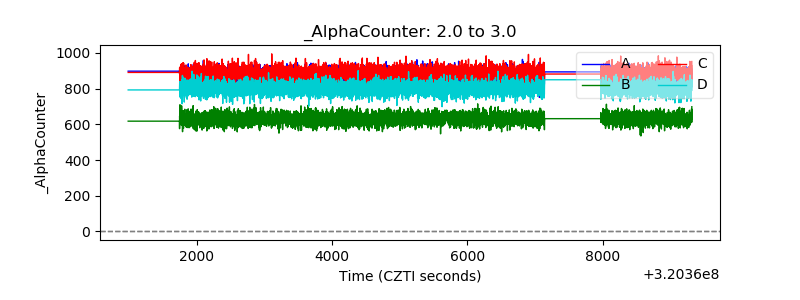 |
| _CPM_Rate | 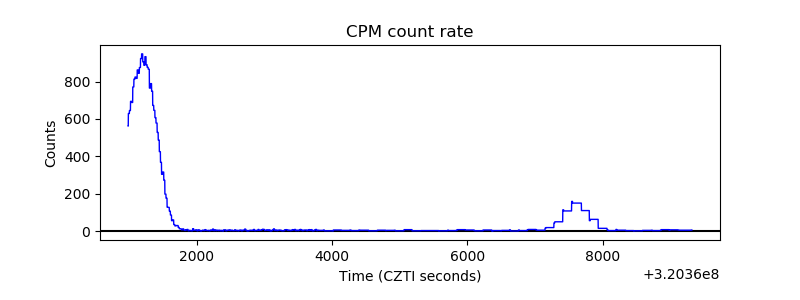 |
| CZT Counter | 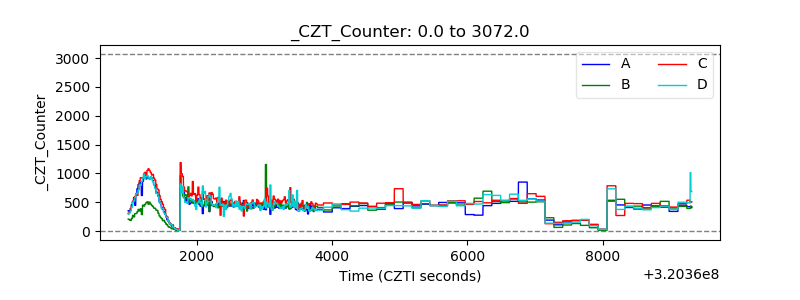 |
| +2.5 Volts monitor |  |
| +5 Volts monitor |  |
| _ROLL_ROT | 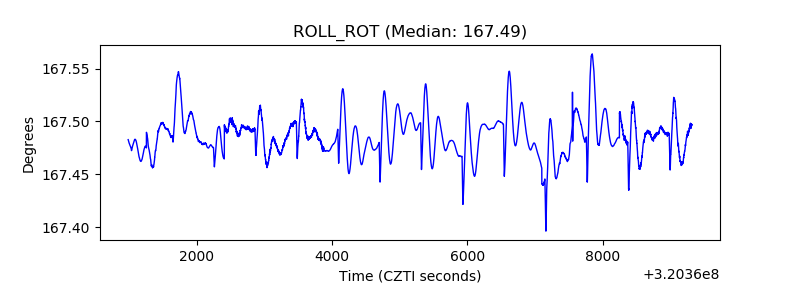 |
| _Roll_DEC |  |
| _Roll_RA | 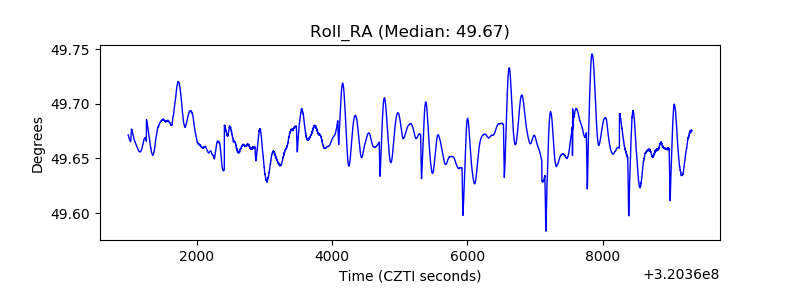 |
| Veto Counter | 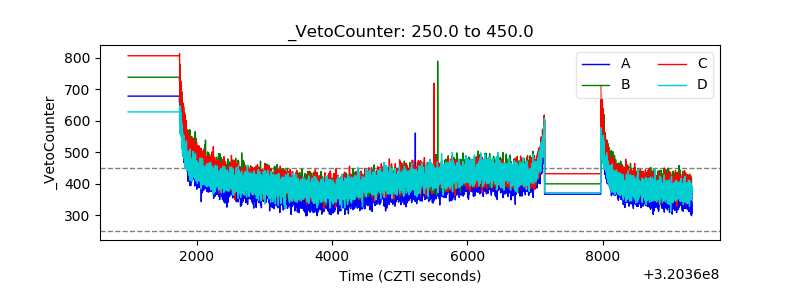 |