| Param | Original file | Final file |
|---|---|---|
| Filename | modeM0/AS1A07_149T01_9000003534_23858cztM0_level2.evt | modeM0/AS1A07_149T01_9000003534_23858cztM0_level2_quad_clean.evt |
| Size (bytes) | 505,848,960 | 108,518,400 |
| Size | 482.4 MB | 103.5 MB |
| Events in quadrant A | 3,528,823 | 702,337 |
| Events in quadrant B | 3,679,249 | 711,340 |
| Events in quadrant C | 3,714,524 | 678,446 |
| Events in quadrant D | 3,879,456 | 664,624 |
| Mode M0 | |||
|---|---|---|---|
| Quadrant | BADHDUFLAG | Total packets | Discarded packets |
| A | 0 | 15598 | 3 |
| B | 0 | 15988 | 4 |
| C | 0 | 15753 | 3 |
| D | 0 | 16666 | 3 |
| Mode SS | |||
|---|---|---|---|
| Quadrant | BADHDUFLAG | Total packets | Discarded packets |
| A | 0 | 160 | 0 |
| B | 0 | 160 | 0 |
| C | 0 | 160 | 0 |
| D | 0 | 160 | 0 |
| Mode M9 | |||
|---|---|---|---|
| Quadrant | BADHDUFLAG | Total packets | Discarded packets |
| A | 0 | 11 | 0 |
| B | 0 | 11 | 0 |
| C | 0 | 11 | 0 |
| D | 0 | 11 | 0 |
| Quadrant | Total seconds | Saturated seconds | Saturation percentage |
|---|---|---|---|
| A | 7606 | 66 | 0.867736% |
| B | 7605 | 91 | 1.196581% |
| C | 7605 | 114 | 1.499014% |
| D | 7606 | 110 | 1.446227% |
Noise dominated data is calculated using 1-second bins in cleaned event files. If a bin has >2000 counts, and if more than 50% of those come from <1% of pixels, then it is considered to be noise-dominated and hence unusable.
| Quadrant | # 1 sec bins | Bins with >0 counts | Bins with >2000 counts | High rate bins dominated by noise | Noise dominated (total time) | Noise dominated (detector-on time) | Marked lightcurve |
|---|---|---|---|---|---|---|---|
| A | 8851 | 7609 | 0 | 0 | 0.00% | 0.00% | 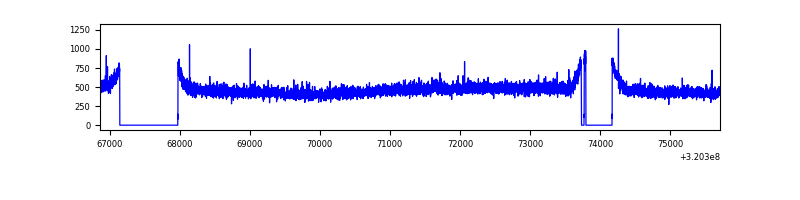 |
| B | 8850 | 7608 | 1 | 1 | 0.01% | 0.01% | 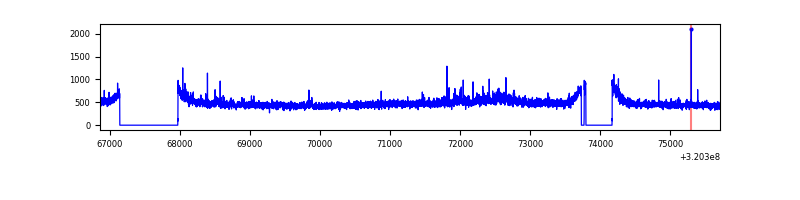 |
| C | 8850 | 7608 | 0 | 0 | 0.00% | 0.00% | 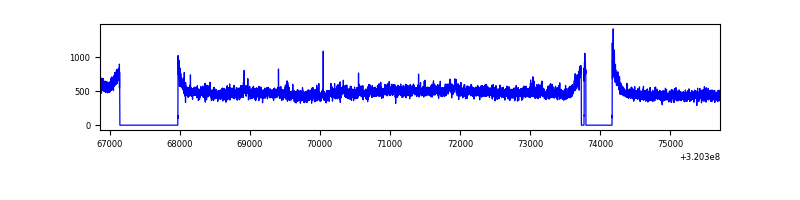 |
| D | 8851 | 7609 | 64 | 64 | 0.72% | 0.84% | 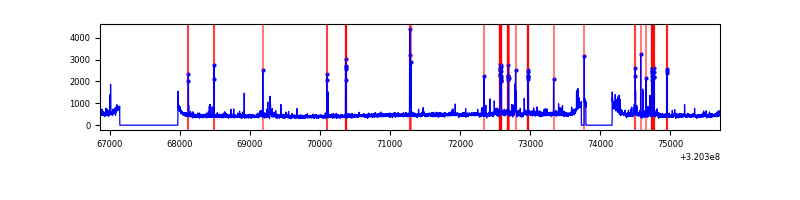 |
Top three noisy pixels from each quadrant. If the there are fewer than three noisy pixels in the level2.evt file, extra rows are filled as -1
| Pixel properties | Quadrant properties | ||||||
|---|---|---|---|---|---|---|---|
| Quadrant | DetID | PixID | Counts | Sigma | Mean | Median | Sigma |
| A | 13 | 254 | 13166 | 66.95 | 913 | 894 | 183.3 |
| A | 3 | 137 | 8133 | 39.49 | 913 | 894 | 183.3 |
| A | 0 | 226 | 8000 | 38.76 | 913 | 894 | 183.3 |
| B | 0 | 189 | 62060 | 352.7 | 910 | 886 | 173.4 |
| B | 15 | 32 | 21097 | 116.53 | 910 | 886 | 173.4 |
| B | 12 | 111 | 20956 | 115.71 | 910 | 886 | 173.4 |
| C | 7 | 247 | 174293 | 854.49 | 869 | 871 | 203.0 |
| C | 14 | 238 | 137530 | 673.35 | 869 | 871 | 203.0 |
| C | 0 | 10 | 13317 | 61.32 | 869 | 871 | 203.0 |
| D | 1 | 52 | 217075 | 1018.5 | 877 | 849 | 212.3 |
| D | 8 | 195 | 212791 | 998.32 | 877 | 849 | 212.3 |
| D | 12 | 233 | 38788 | 178.71 | 877 | 849 | 212.3 |
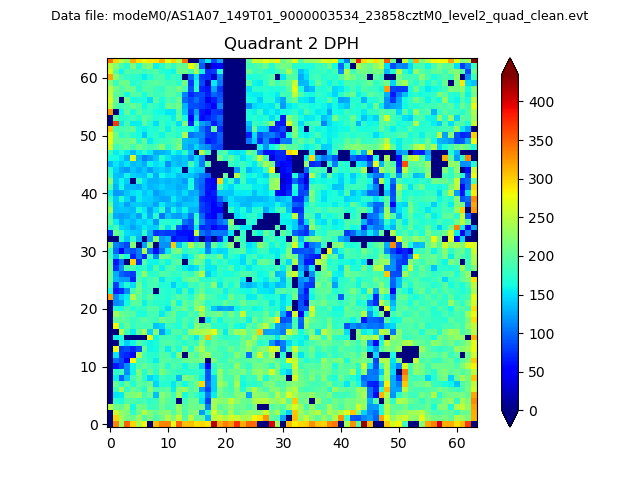
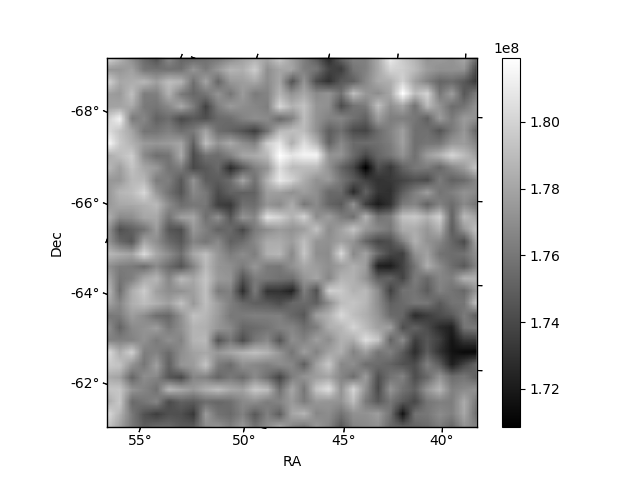
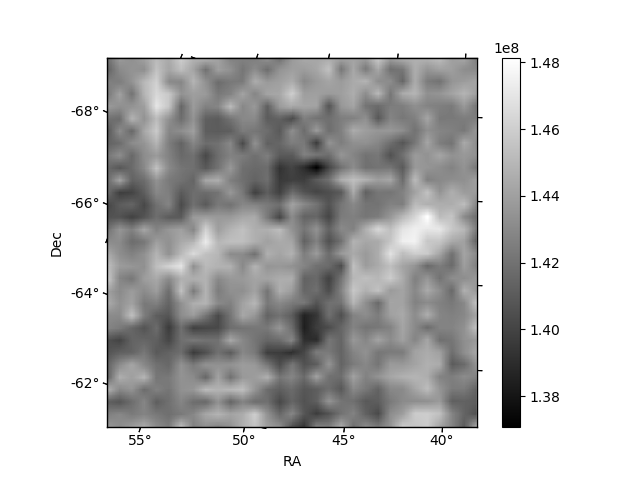
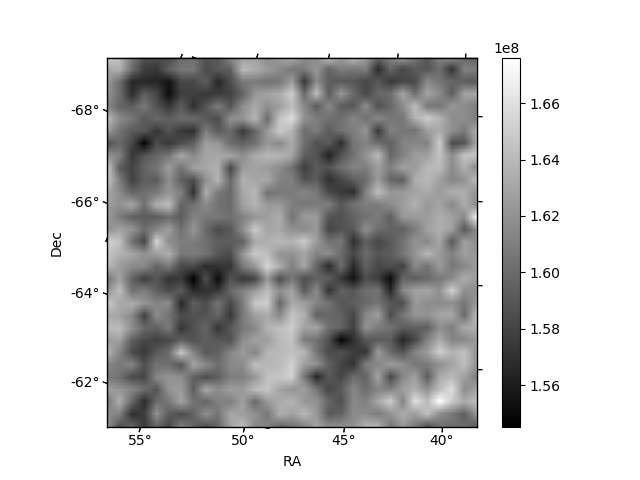
Histogram calculated using DETX and DETY for each event in the final _common_clean file
| Quadrant A | 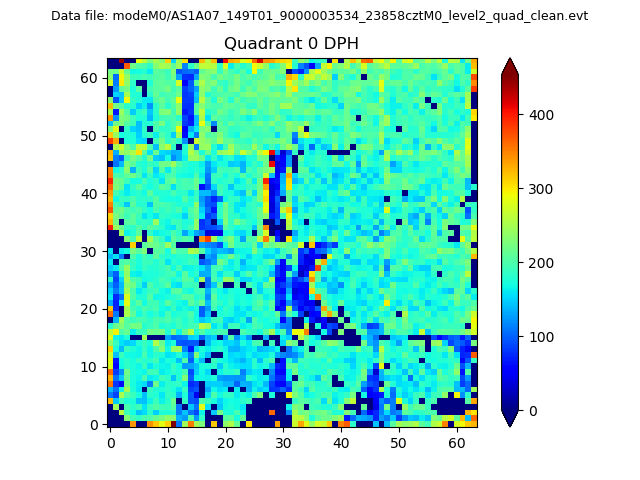 |
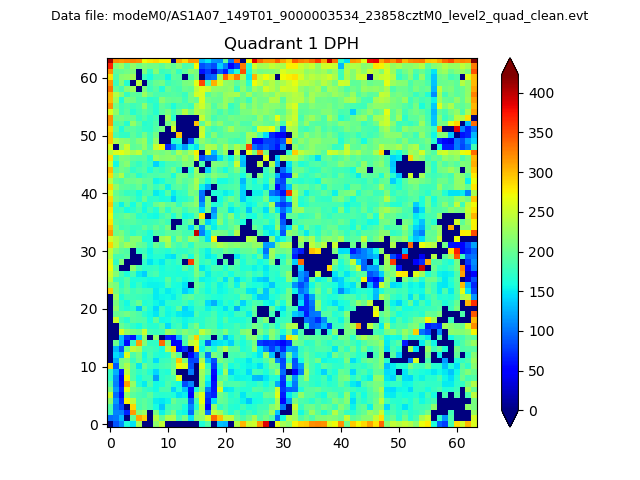 |
Quadrant B |
|---|---|---|---|
| Quadrant D | 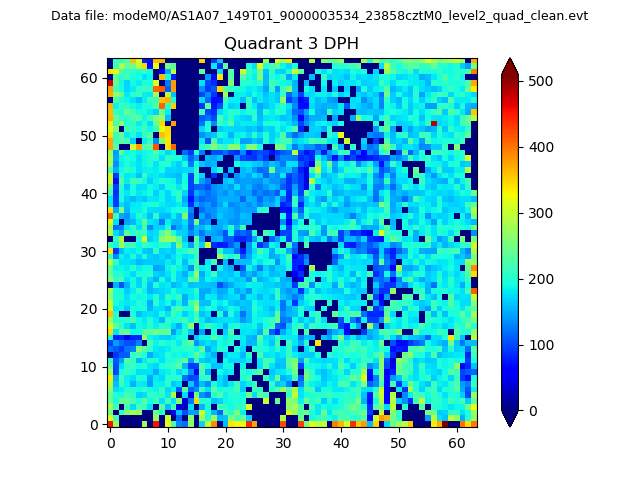 |
 |
Quadrant C |
| Plot type | Count rate plots | Images |
|---|---|---|
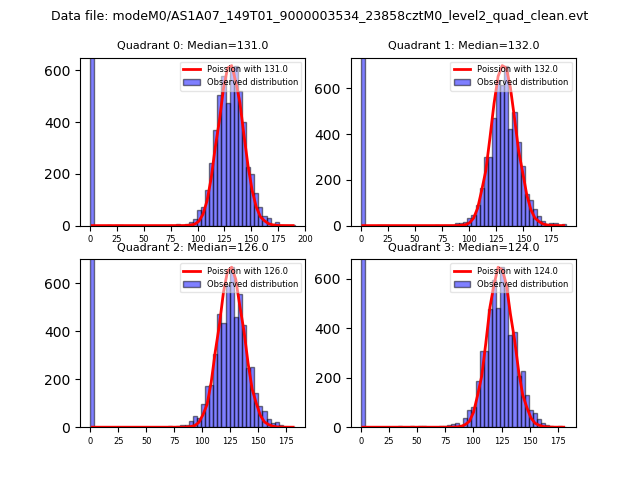
| Comparison with Poisson distribution Blue bars denote a histogram of data divided into 1 sec bins. Red curve is a Poisson curve with rate = median count rate of data. |
 |
 |
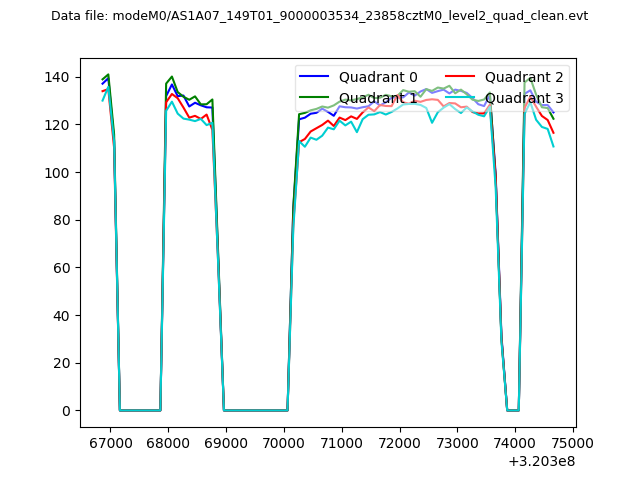
| Quadrant-wise count rates Data is divided into 100 sec bins |
 |
|
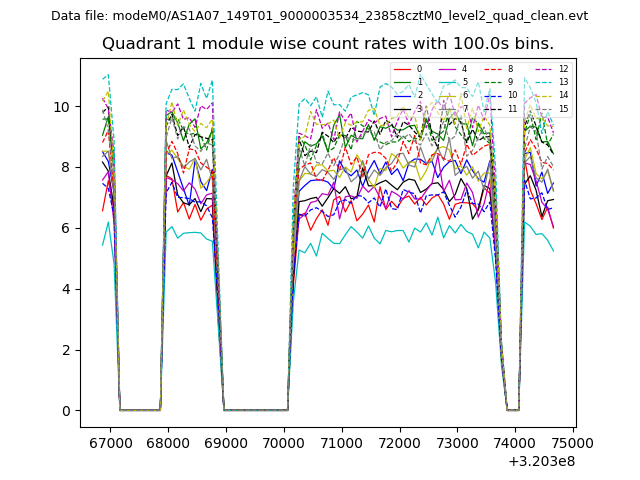
| Module-wise count rates for Quadrant A Data is divided into 100 sec bins |
 |
 |
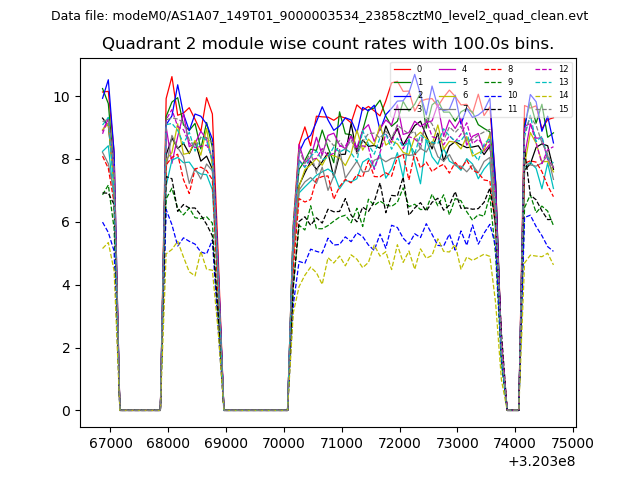
| Module-wise count rates for Quadrant B Data is divided into 100 sec bins |
 |
 |
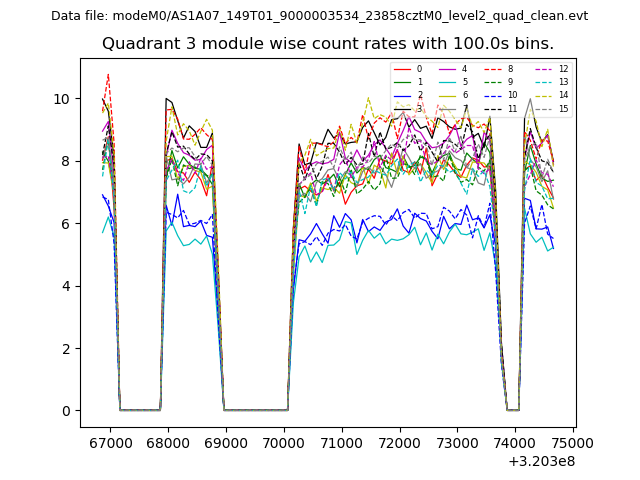
| Module-wise count rates for Quadrant C Data is divided into 100 sec bins |
 |
 |
| Module-wise count rates for Quadrant D Data is divided into 100 sec bins |
 |
 |
| Parameter | Plot |
|---|---|
| CZT HV Monitor | 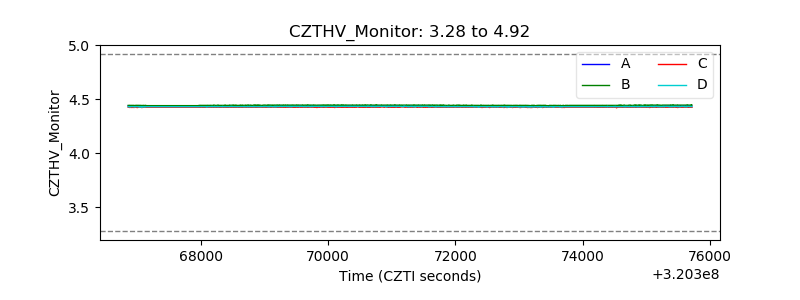 |
| D_VDD | 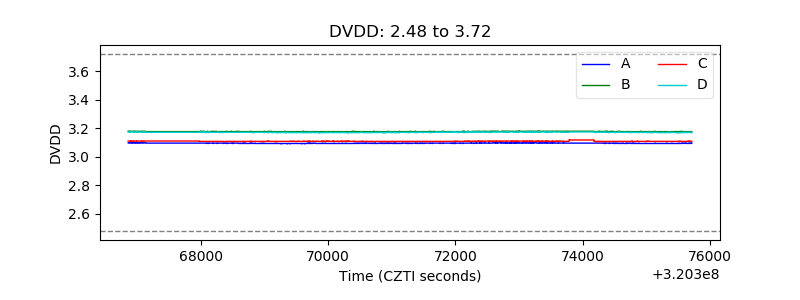 |
| Temperature 1 | 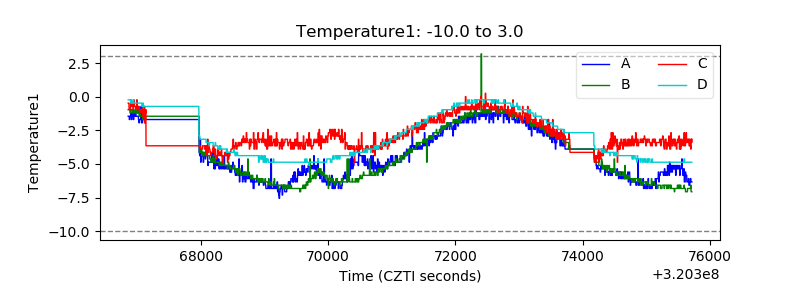 |
| Veto HV Monitor | 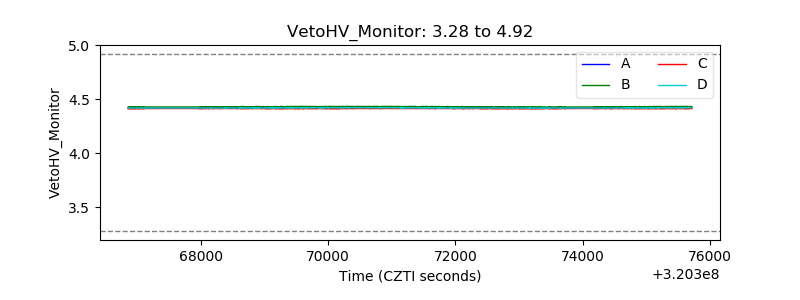 |
| Veto LLD | 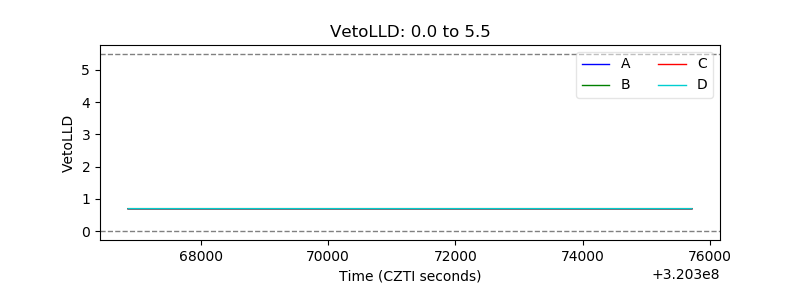 |
| Alpha Counter | 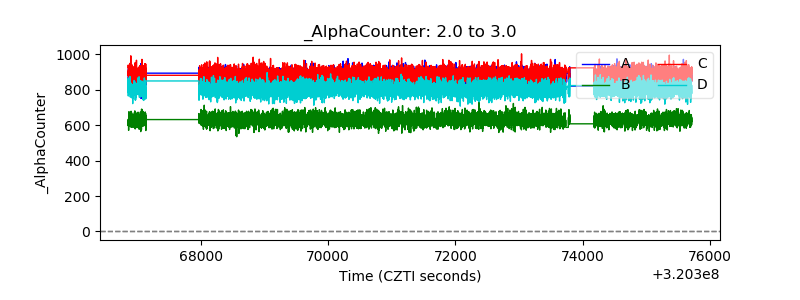 |
| _CPM_Rate | 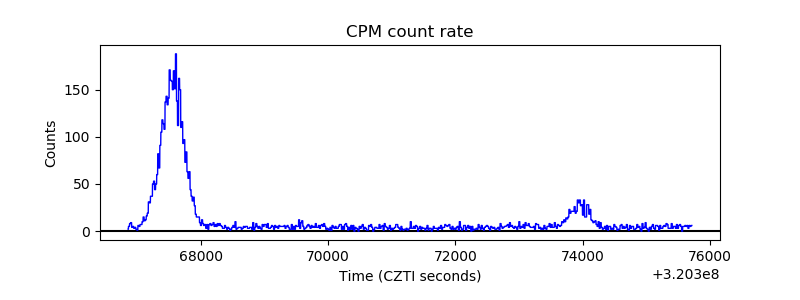 |
| CZT Counter | 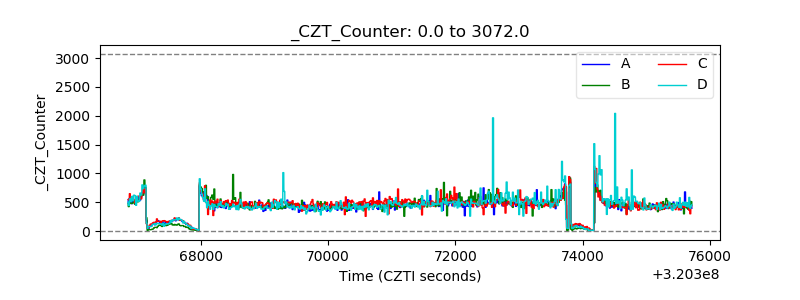 |
| +2.5 Volts monitor | 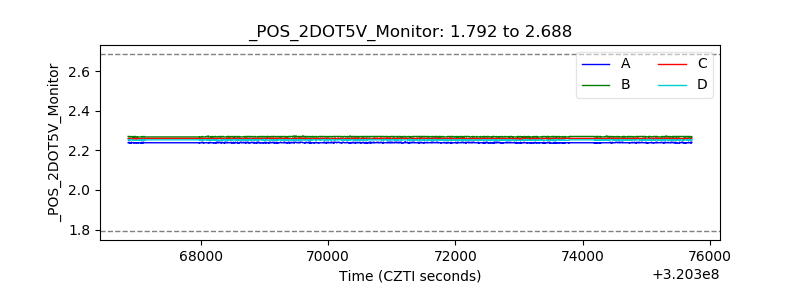 |
| +5 Volts monitor | 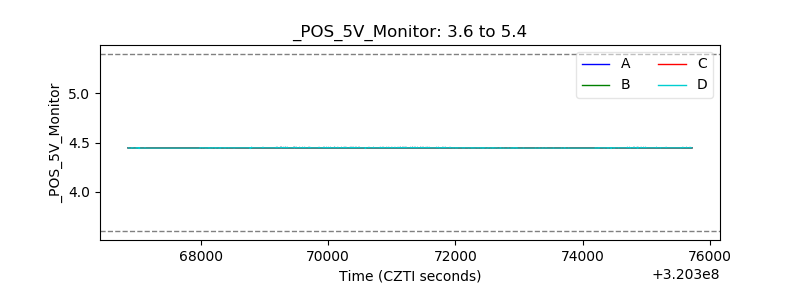 |
| _ROLL_ROT | 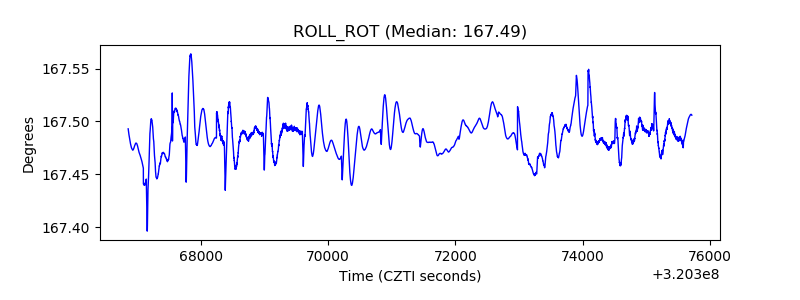 |
| _Roll_DEC | 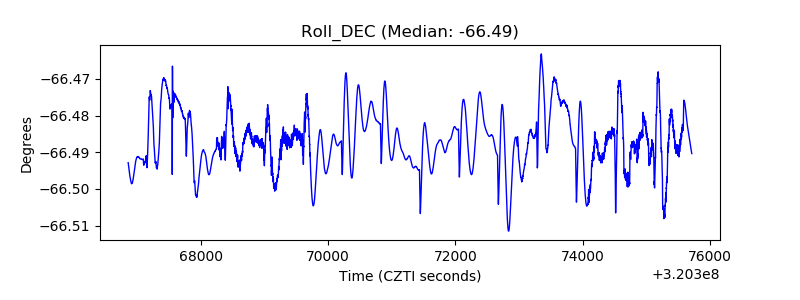 |
| _Roll_RA | 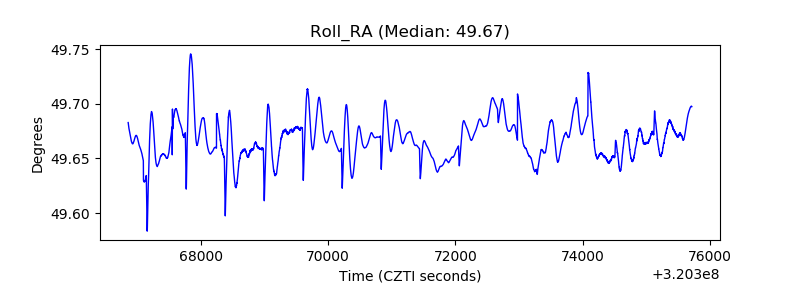 |
| Veto Counter | 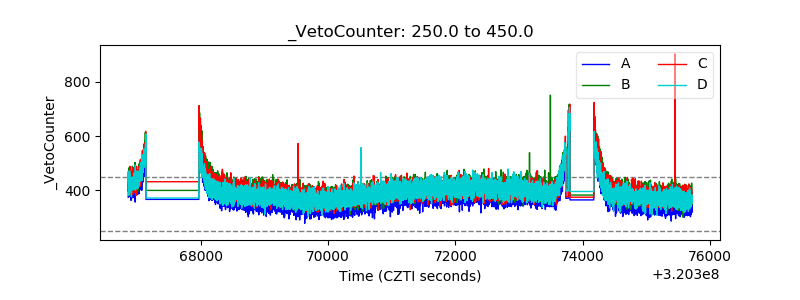 |