| Param | Original file | Final file |
|---|---|---|
| Filename | modeM0/AS1A07_149T01_9000003534_23859cztM0_level2.evt | modeM0/AS1A07_149T01_9000003534_23859cztM0_level2_quad_clean.evt |
| Size (bytes) | 549,846,720 | 108,190,080 |
| Size | 524.4 MB | 103.2 MB |
| Events in quadrant A | 3,773,038 | 694,531 |
| Events in quadrant B | 3,851,315 | 703,919 |
| Events in quadrant C | 3,827,423 | 670,406 |
| Events in quadrant D | 4,658,188 | 652,539 |
| Mode M0 | |||
|---|---|---|---|
| Quadrant | BADHDUFLAG | Total packets | Discarded packets |
| A | 0 | 16586 | 3 |
| B | 0 | 16683 | 3 |
| C | 0 | 16658 | 3 |
| D | 0 | 19092 | 3 |
| Mode SS | |||
|---|---|---|---|
| Quadrant | BADHDUFLAG | Total packets | Discarded packets |
| A | 0 | 164 | 0 |
| B | 0 | 164 | 0 |
| C | 0 | 164 | 0 |
| D | 0 | 164 | 0 |
| Mode M9 | |||
|---|---|---|---|
| Quadrant | BADHDUFLAG | Total packets | Discarded packets |
| A | 0 | 4 | 0 |
| B | 0 | 4 | 0 |
| C | 0 | 4 | 0 |
| D | 0 | 4 | 0 |
| Quadrant | Total seconds | Saturated seconds | Saturation percentage |
|---|---|---|---|
| A | 7979 | 239 | 2.995363% |
| B | 7980 | 306 | 3.834586% |
| C | 7980 | 308 | 3.859649% |
| D | 7980 | 330 | 4.135338% |
Noise dominated data is calculated using 1-second bins in cleaned event files. If a bin has >2000 counts, and if more than 50% of those come from <1% of pixels, then it is considered to be noise-dominated and hence unusable.
| Quadrant | # 1 sec bins | Bins with >0 counts | Bins with >2000 counts | High rate bins dominated by noise | Noise dominated (total time) | Noise dominated (detector-on time) | Marked lightcurve |
|---|---|---|---|---|---|---|---|
| A | 8449 | 7982 | 0 | 0 | 0.00% | 0.00% | 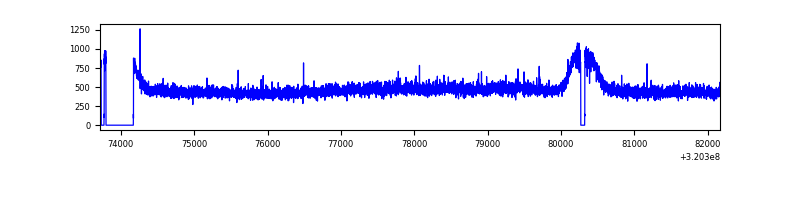 |
| B | 8450 | 7983 | 1 | 1 | 0.01% | 0.01% | 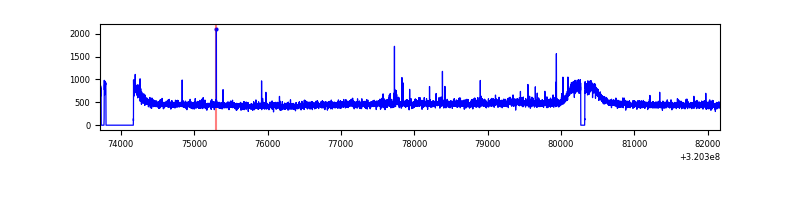 |
| C | 8450 | 7983 | 3 | 3 | 0.04% | 0.04% | 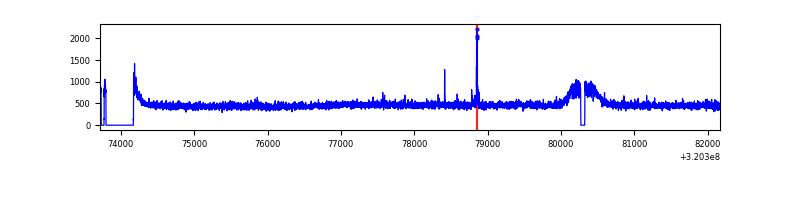 |
| D | 8450 | 7983 | 103 | 103 | 1.22% | 1.29% | 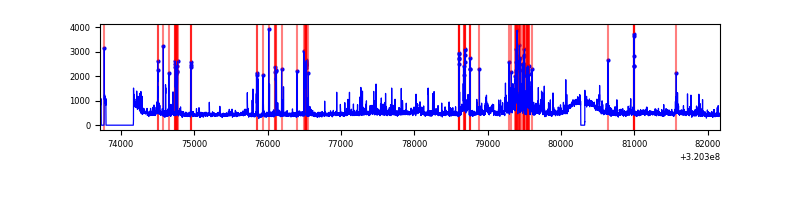 |
Top three noisy pixels from each quadrant. If the there are fewer than three noisy pixels in the level2.evt file, extra rows are filled as -1
| Pixel properties | Quadrant properties | ||||||
|---|---|---|---|---|---|---|---|
| Quadrant | DetID | PixID | Counts | Sigma | Mean | Median | Sigma |
| A | 2 | 250 | 18378 | 89.0 | 970 | 947 | 195.9 |
| A | 6 | 16 | 15367 | 73.63 | 970 | 947 | 195.9 |
| A | 13 | 254 | 13264 | 62.89 | 970 | 947 | 195.9 |
| B | 12 | 111 | 22867 | 118.49 | 971 | 946 | 185.0 |
| B | 11 | 111 | 19678 | 101.25 | 971 | 946 | 185.0 |
| B | 15 | 32 | 17474 | 89.34 | 971 | 946 | 185.0 |
| C | 14 | 238 | 144710 | 660.51 | 930 | 931 | 217.7 |
| C | 0 | 207 | 24772 | 109.52 | 930 | 931 | 217.7 |
| C | 7 | 247 | 15416 | 66.54 | 930 | 931 | 217.7 |
| D | 1 | 52 | 576658 | 2523.25 | 937 | 906 | 228.2 |
| D | 8 | 195 | 316891 | 1384.81 | 937 | 906 | 228.2 |
| D | 12 | 233 | 154303 | 672.27 | 937 | 906 | 228.2 |
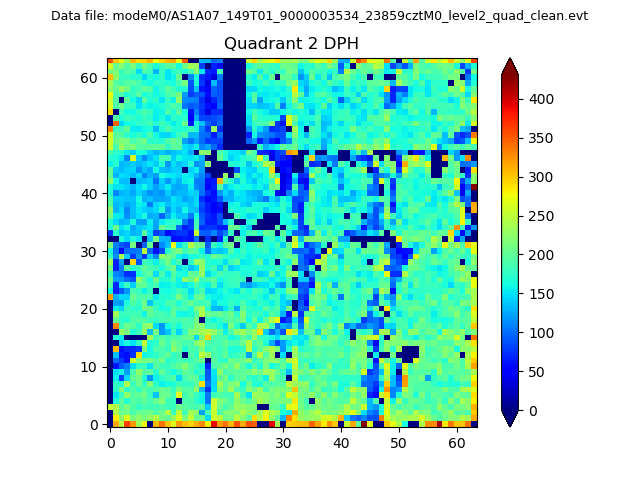
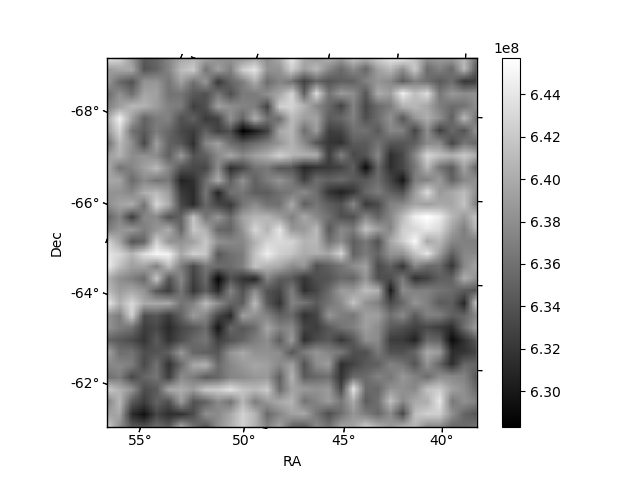
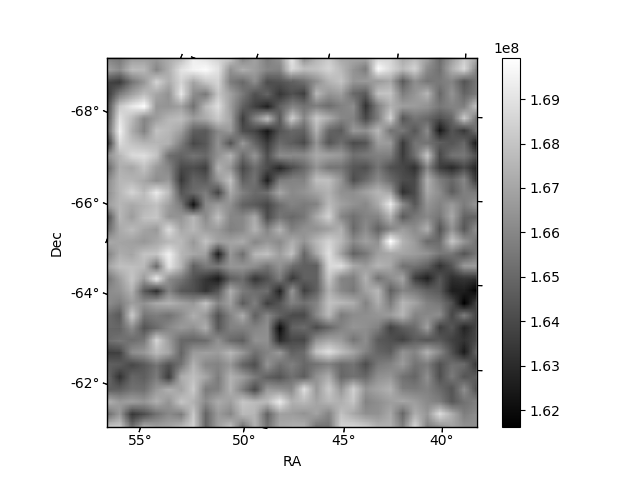
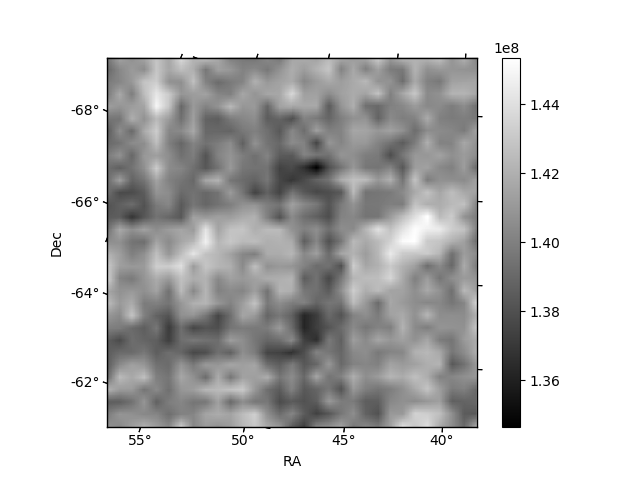
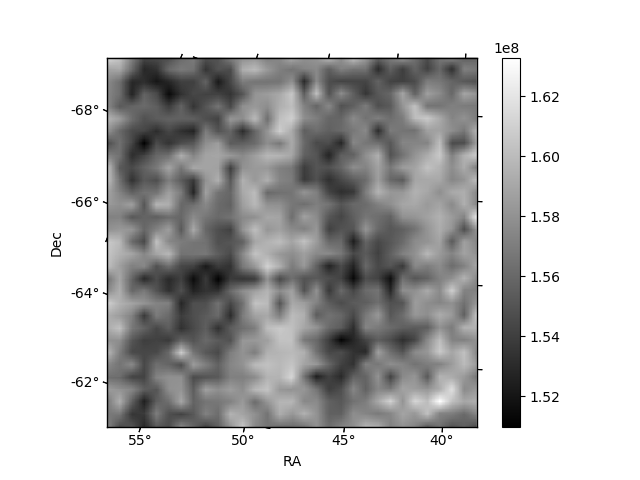
Histogram calculated using DETX and DETY for each event in the final _common_clean file
| Quadrant A | 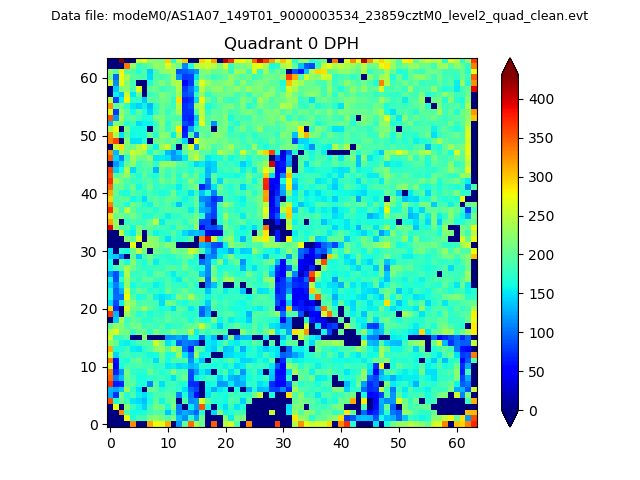 |
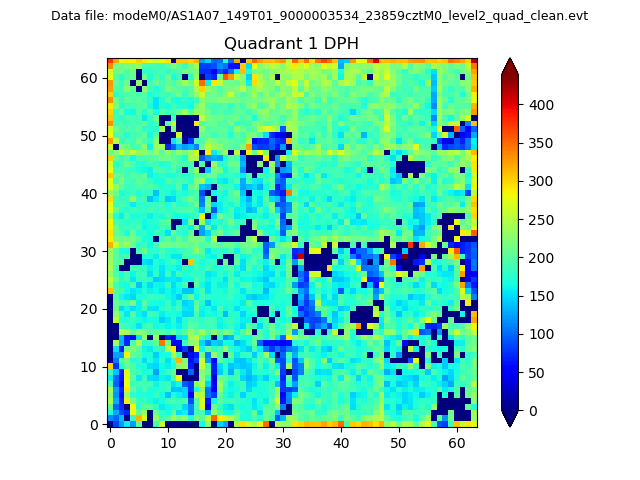 |
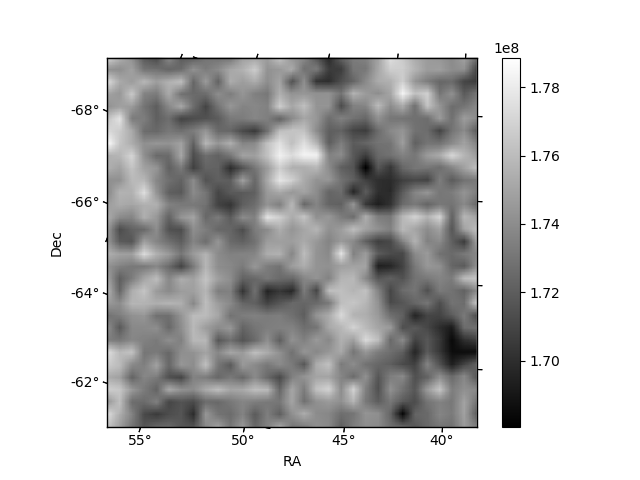
Quadrant B |
|---|---|---|---|
| Quadrant D | 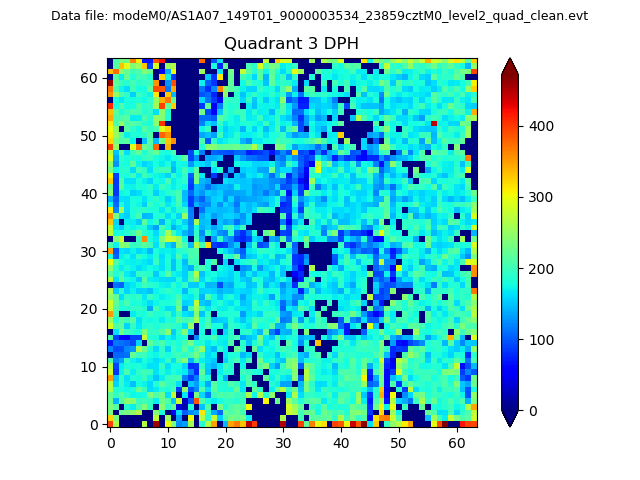 |
 |
Quadrant C |
| Plot type | Count rate plots | Images |
|---|---|---|
| Comparison with Poisson distribution Blue bars denote a histogram of data divided into 1 sec bins. Red curve is a Poisson curve with rate = median count rate of data. |
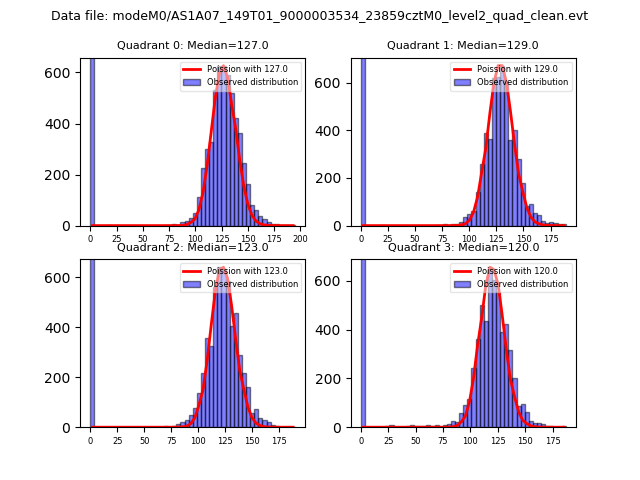 |
 |
| Quadrant-wise count rates Data is divided into 100 sec bins |
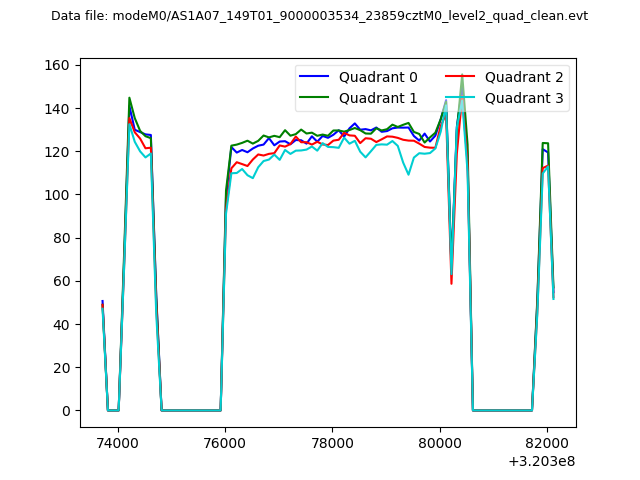 |
|
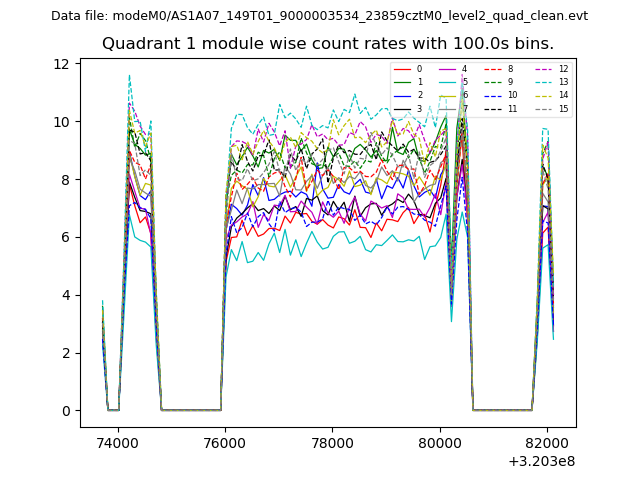
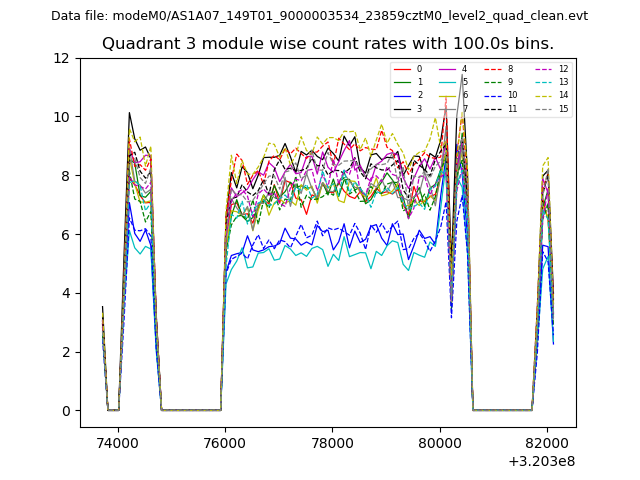
| Module-wise count rates for Quadrant A Data is divided into 100 sec bins |
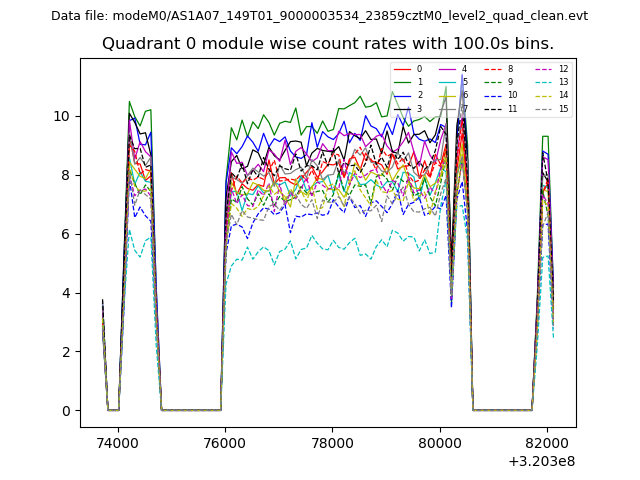 |
 |
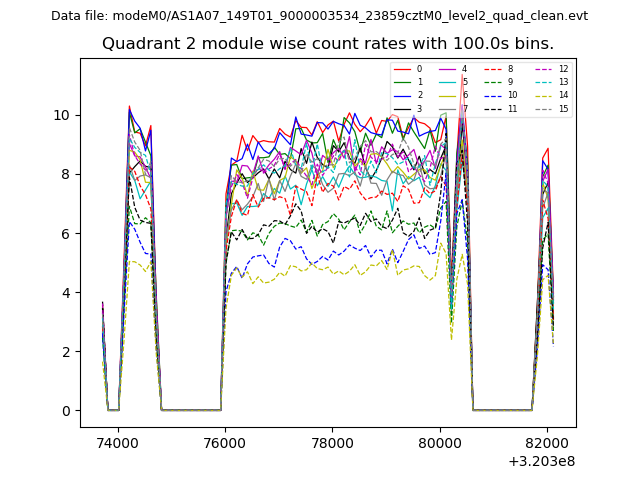
| Module-wise count rates for Quadrant B Data is divided into 100 sec bins |
 |
 |
| Module-wise count rates for Quadrant C Data is divided into 100 sec bins |
 |
 |
| Module-wise count rates for Quadrant D Data is divided into 100 sec bins |
 |
 |
| Parameter | Plot |
|---|---|
| CZT HV Monitor | 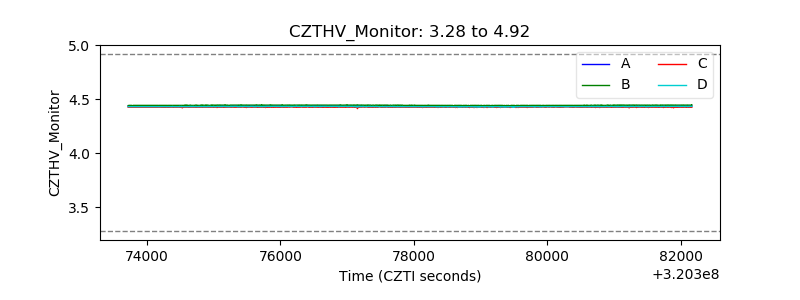 |
| D_VDD | 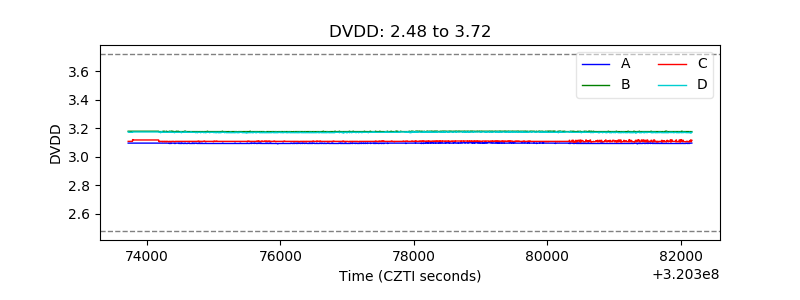 |
| Temperature 1 | 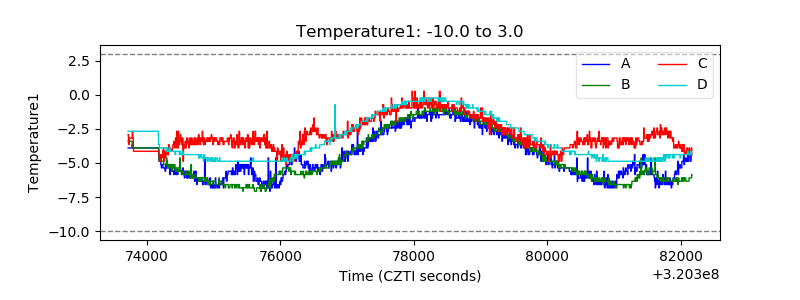 |
| Veto HV Monitor | 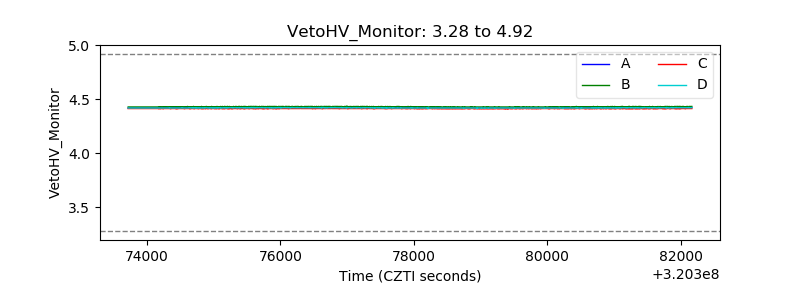 |
| Veto LLD | 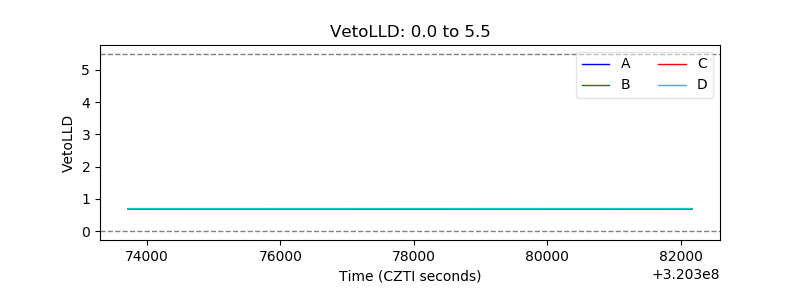 |
| Alpha Counter | 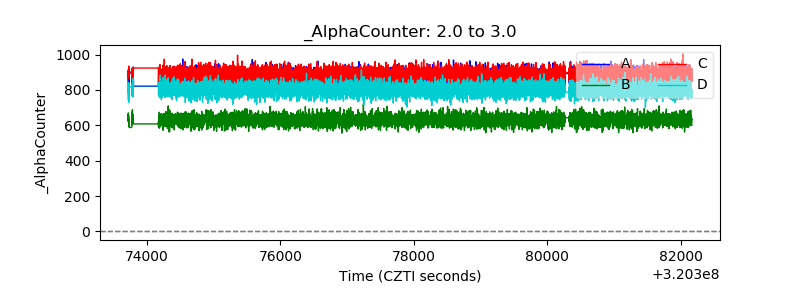 |
| _CPM_Rate | 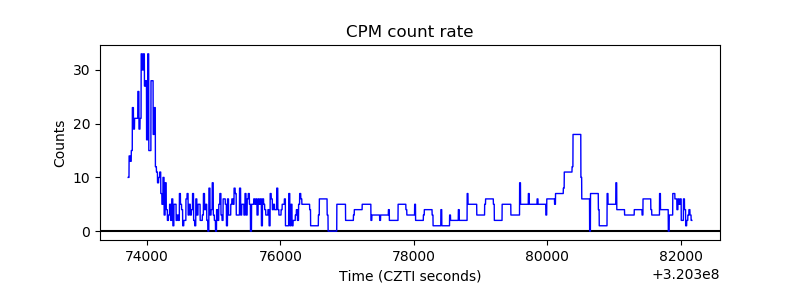 |
| CZT Counter | 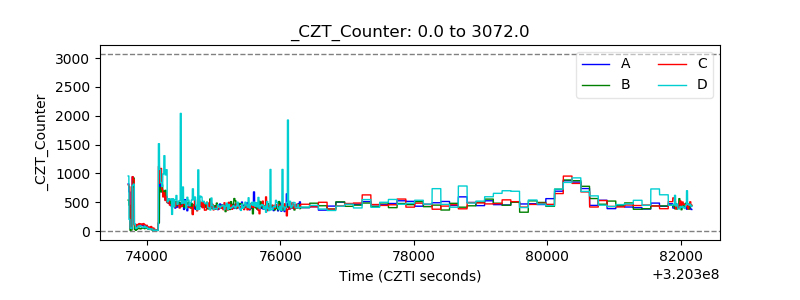 |
| +2.5 Volts monitor |  |
| +5 Volts monitor | 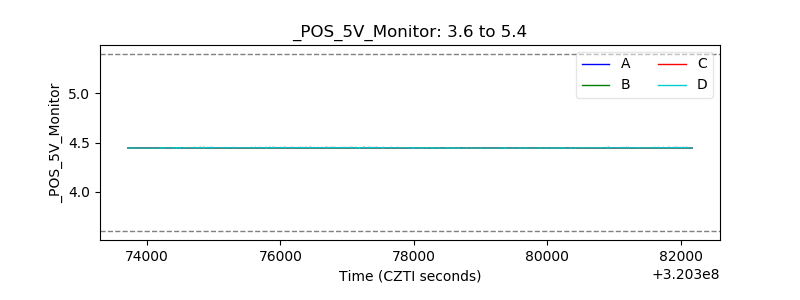 |
| _ROLL_ROT | 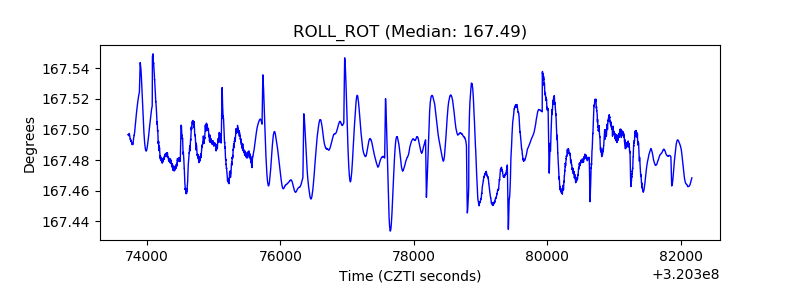 |
| _Roll_DEC | 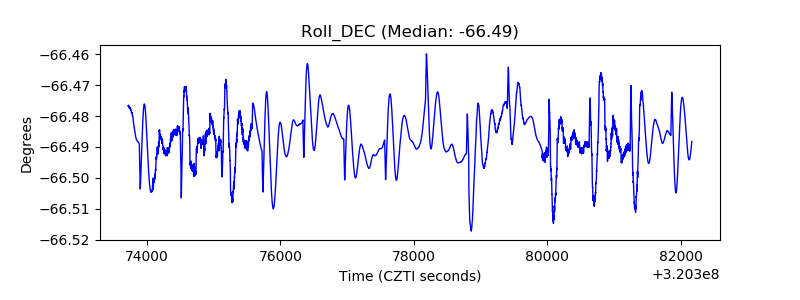 |
| _Roll_RA | 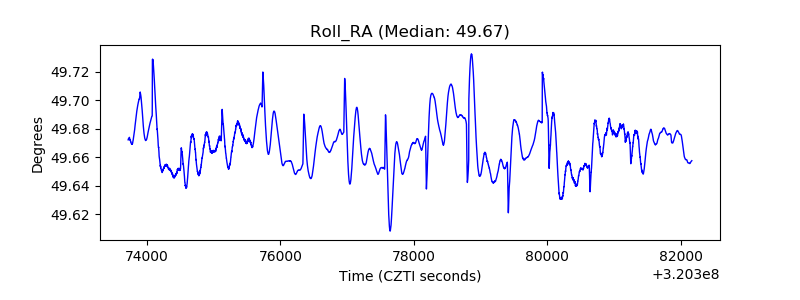 |
| Veto Counter | 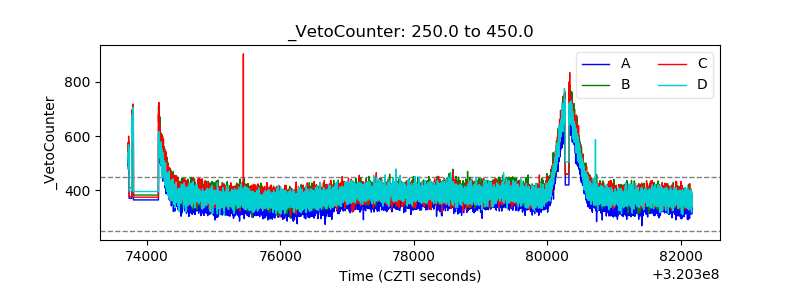 |