| Param | Original file | Final file |
|---|---|---|
| Filename | modeM0/AS1A07_149T01_9000003534_23863cztM0_level2.evt | modeM0/AS1A07_149T01_9000003534_23863cztM0_level2_quad_clean.evt |
| Size (bytes) | 665,409,600 | 171,460,800 |
| Size | 634.6 MB | 163.5 MB |
| Events in quadrant A | 4,778,208 | 1,138,652 |
| Events in quadrant B | 4,951,164 | 1,148,582 |
| Events in quadrant C | 4,777,134 | 1,106,773 |
| Events in quadrant D | 4,950,304 | 1,089,793 |
| Mode M0 | |||
|---|---|---|---|
| Quadrant | BADHDUFLAG | Total packets | Discarded packets |
| A | 0 | 23601 | 2652 |
| B | 0 | 24155 | 2872 |
| C | 0 | 23630 | 2740 |
| D | 0 | 24188 | 2881 |
| Mode SS | |||
|---|---|---|---|
| Quadrant | BADHDUFLAG | Total packets | Discarded packets |
| A | 0 | 238 | 34 |
| B | 0 | 238 | 30 |
| C | 0 | 237 | 25 |
| D | 0 | 237 | 34 |
| Mode M9 | |||
|---|---|---|---|
| Quadrant | BADHDUFLAG | Total packets | Discarded packets |
| A | 0 | 11 | 0 |
| B | 0 | 11 | 0 |
| C | 0 | 11 | 0 |
| D | 0 | 11 | 0 |
| Quadrant | Total seconds | Saturated seconds | Saturation percentage |
|---|---|---|---|
| A | 10277 | 99 | 0.963316% |
| B | 10238 | 119 | 1.162336% |
| C | 10250 | 136 | 1.326829% |
| D | 10228 | 97 | 0.948377% |
Noise dominated data is calculated using 1-second bins in cleaned event files. If a bin has >2000 counts, and if more than 50% of those come from <1% of pixels, then it is considered to be noise-dominated and hence unusable.
| Quadrant | # 1 sec bins | Bins with >0 counts | Bins with >2000 counts | High rate bins dominated by noise | Noise dominated (total time) | Noise dominated (detector-on time) | Marked lightcurve |
|---|---|---|---|---|---|---|---|
| A | 25170 | 10576 | 0 | 0 | 0.00% | 0.00% | 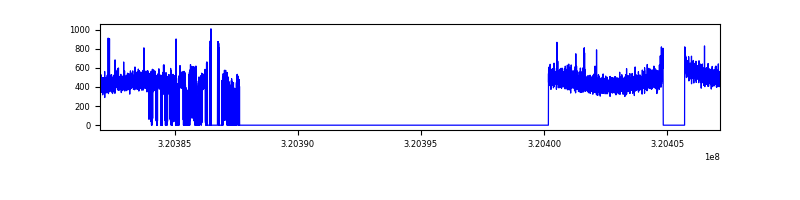 |
| B | 25171 | 10535 | 5 | 5 | 0.02% | 0.05% | 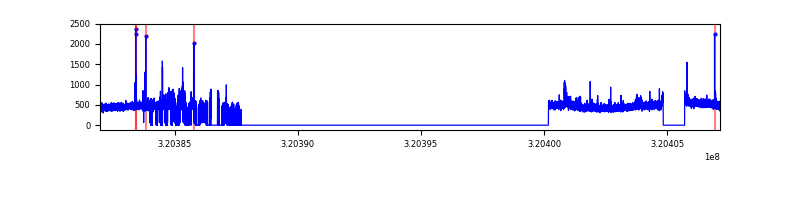 |
| C | 25171 | 10563 | 0 | 0 | 0.00% | 0.00% | 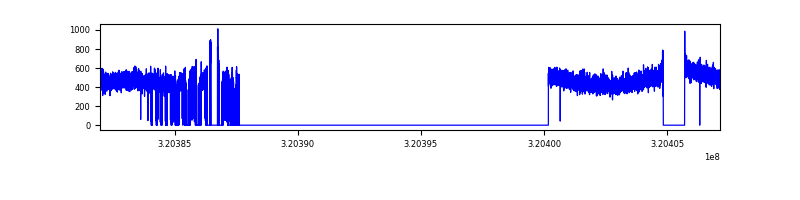 |
| D | 25171 | 10530 | 1 | 1 | 0.00% | 0.01% | 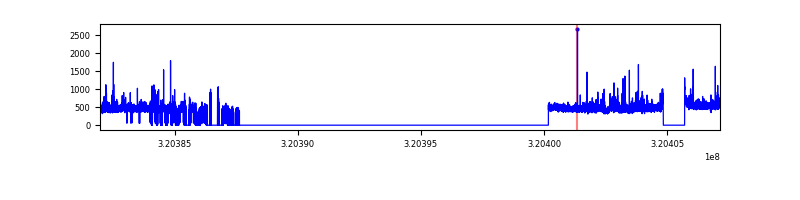 |
Top three noisy pixels from each quadrant. If the there are fewer than three noisy pixels in the level2.evt file, extra rows are filled as -1
| Pixel properties | Quadrant properties | ||||||
|---|---|---|---|---|---|---|---|
| Quadrant | DetID | PixID | Counts | Sigma | Mean | Median | Sigma |
| A | 13 | 252 | 30516 | 119.11 | 1228 | 1202 | 246.1 |
| A | 13 | 254 | 16421 | 61.84 | 1228 | 1202 | 246.1 |
| A | 2 | 250 | 13857 | 51.42 | 1228 | 1202 | 246.1 |
| B | 0 | 189 | 88247 | 379.93 | 1213 | 1181 | 229.2 |
| B | 15 | 32 | 46750 | 198.85 | 1213 | 1181 | 229.2 |
| B | 12 | 111 | 28074 | 117.35 | 1213 | 1181 | 229.2 |
| C | 14 | 238 | 185018 | 675.69 | 1169 | 1174 | 272.1 |
| C | 7 | 247 | 19839 | 68.6 | 1169 | 1174 | 272.1 |
| C | 13 | 61 | 8112 | 25.5 | 1169 | 1174 | 272.1 |
| D | 8 | 195 | 297857 | 1026.07 | 1192 | 1156 | 289.2 |
| D | 1 | 52 | 109901 | 376.07 | 1192 | 1156 | 289.2 |
| D | 2 | 234 | 46237 | 155.9 | 1192 | 1156 | 289.2 |
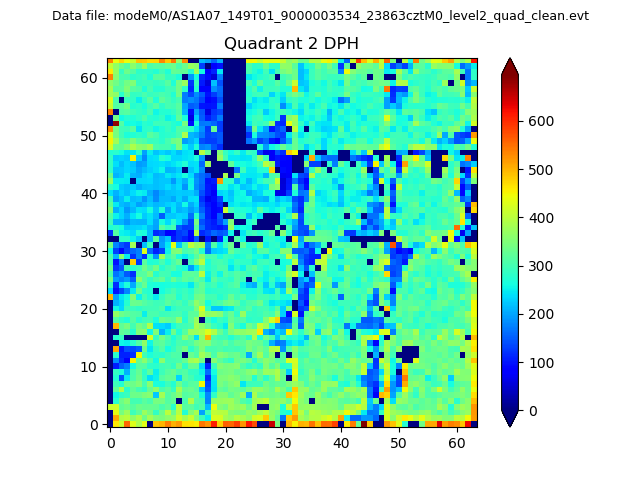
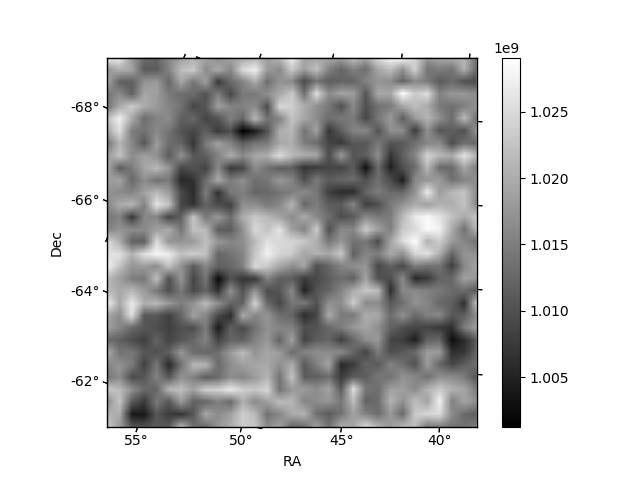
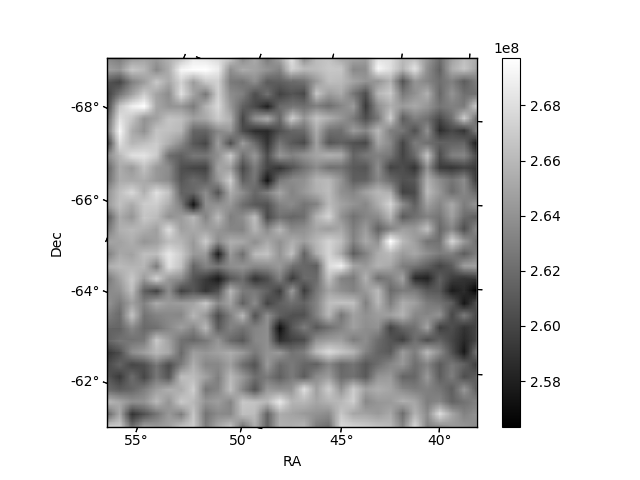
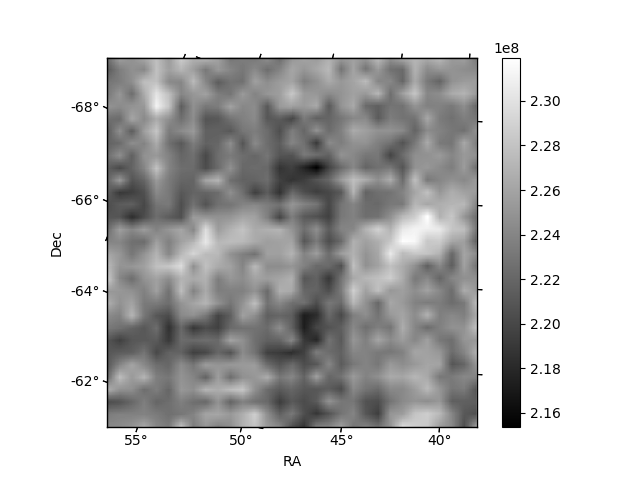
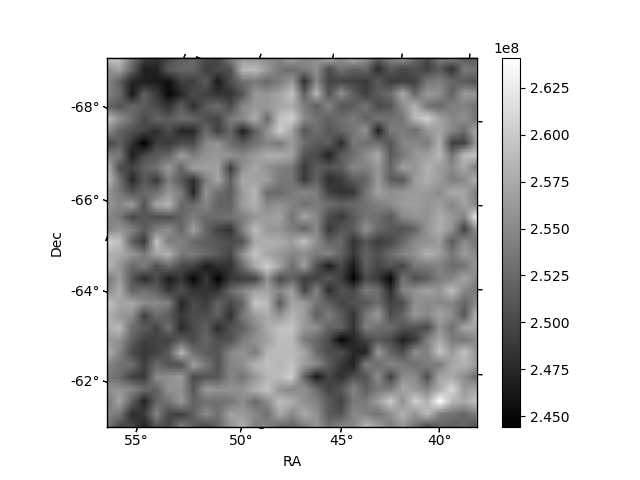
Histogram calculated using DETX and DETY for each event in the final _common_clean file
| Quadrant A | 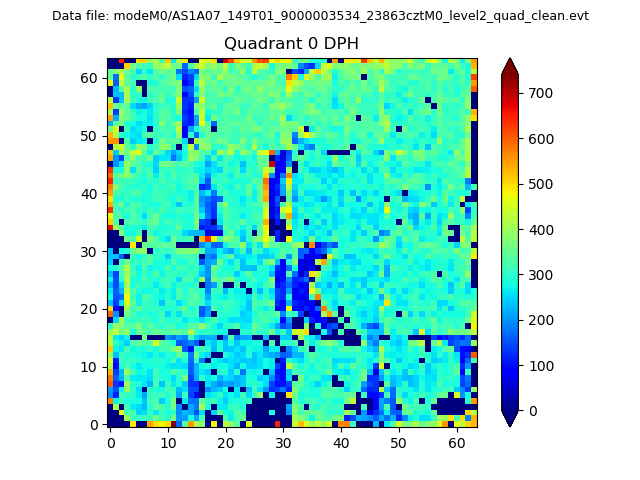 |
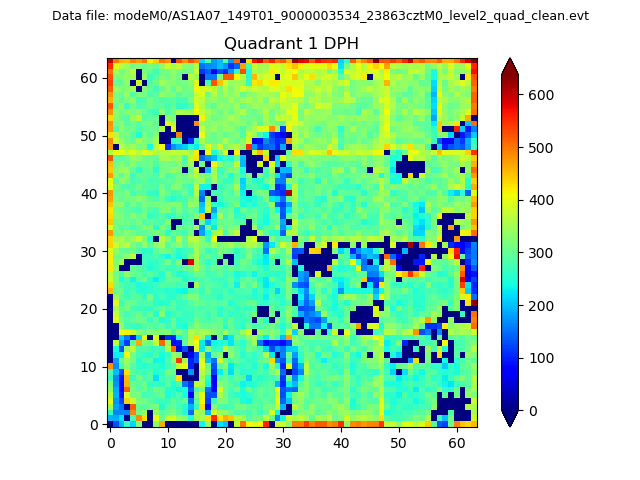 |
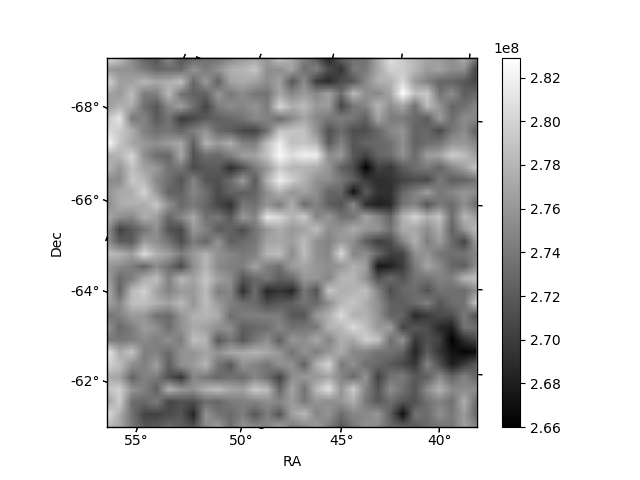
Quadrant B |
|---|---|---|---|
| Quadrant D | 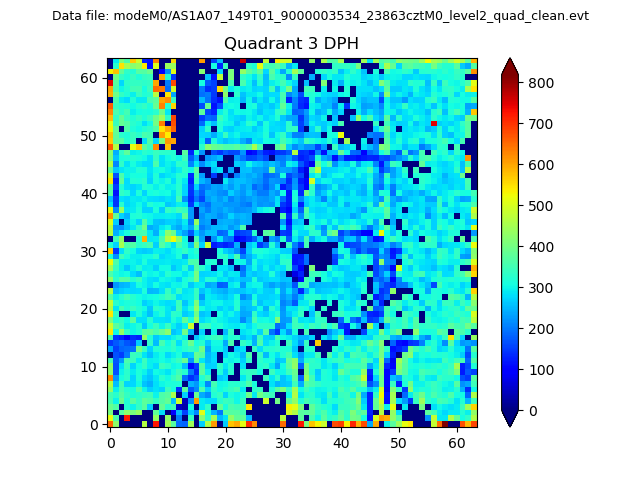 |
 |
Quadrant C |
| Plot type | Count rate plots | Images |
|---|---|---|
| Comparison with Poisson distribution Blue bars denote a histogram of data divided into 1 sec bins. Red curve is a Poisson curve with rate = median count rate of data. |
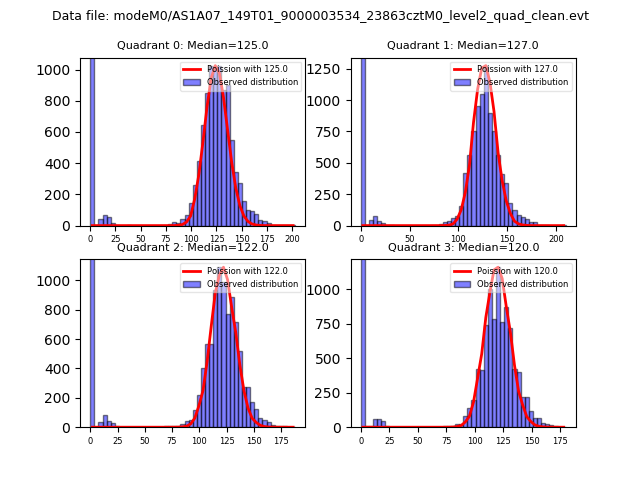 |
 |
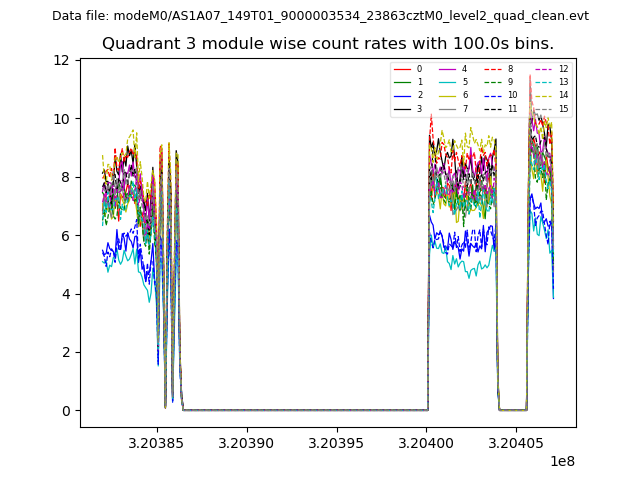
| Quadrant-wise count rates Data is divided into 100 sec bins |
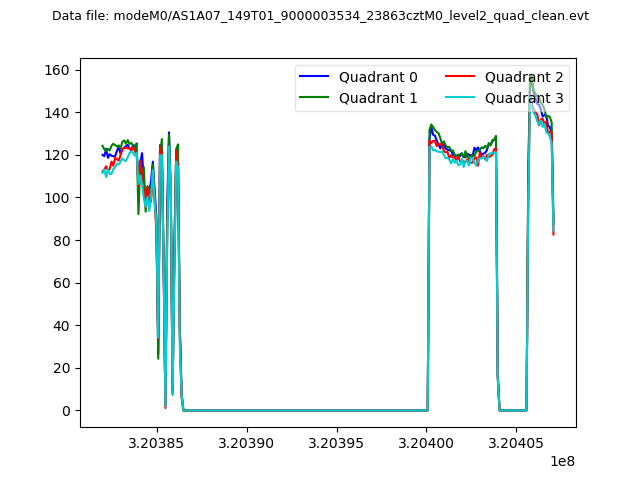 |
|
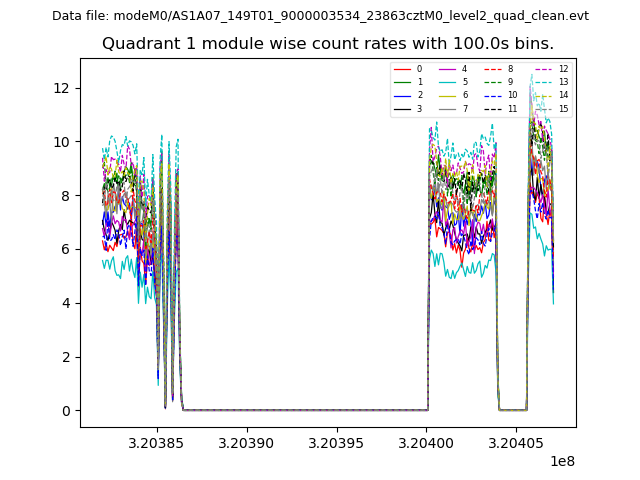
| Module-wise count rates for Quadrant A Data is divided into 100 sec bins |
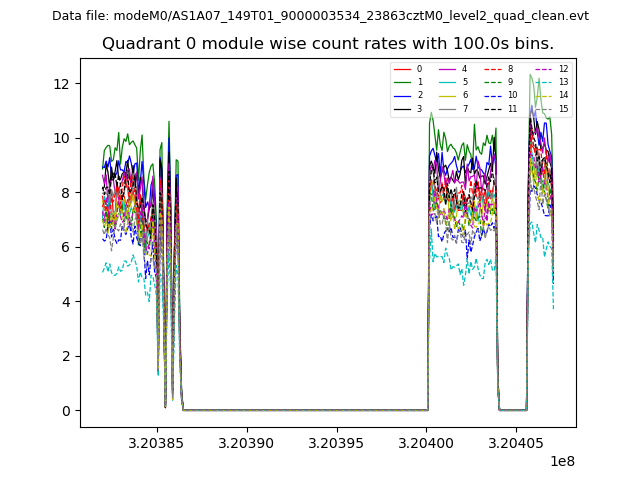 |
 |
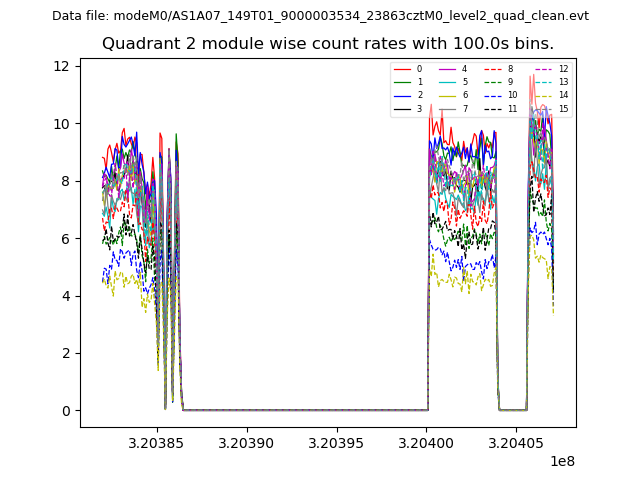
| Module-wise count rates for Quadrant B Data is divided into 100 sec bins |
 |
 |
| Module-wise count rates for Quadrant C Data is divided into 100 sec bins |
 |
 |
| Module-wise count rates for Quadrant D Data is divided into 100 sec bins |
 |
 |
| Parameter | Plot |
|---|---|
| CZT HV Monitor | 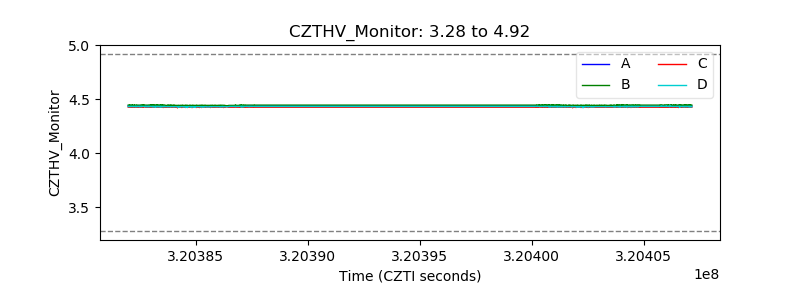 |
| D_VDD | 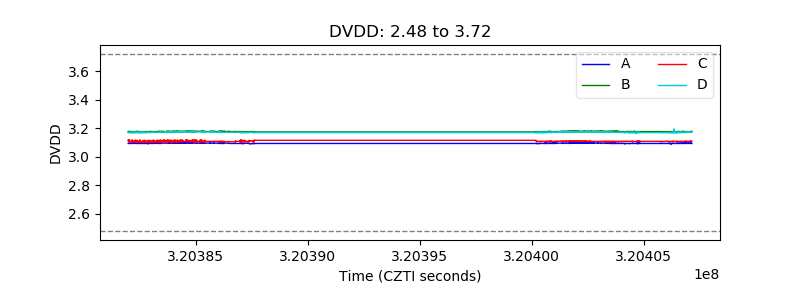 |
| Temperature 1 | 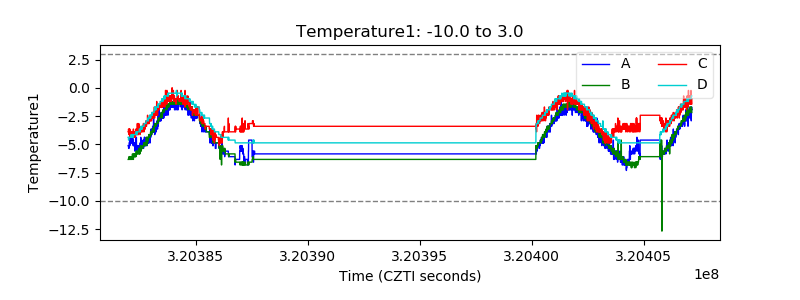 |
| Veto HV Monitor | 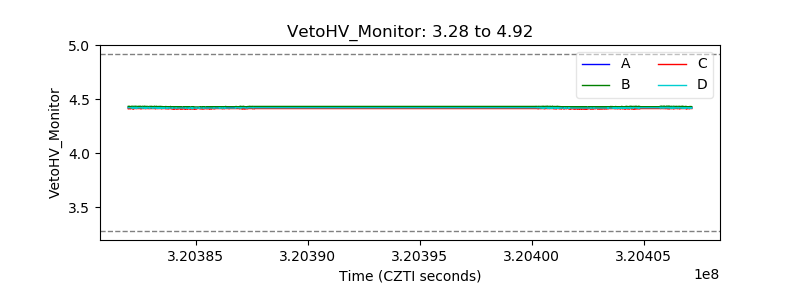 |
| Veto LLD | 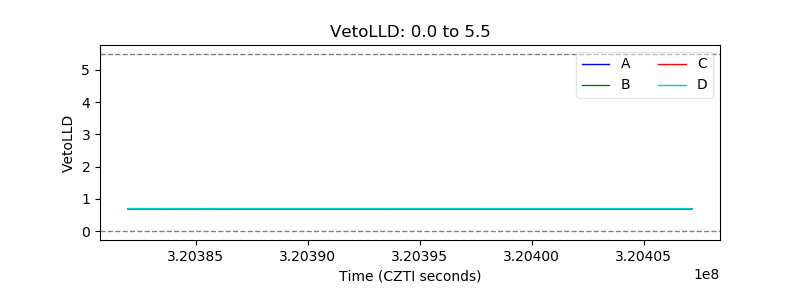 |
| Alpha Counter | 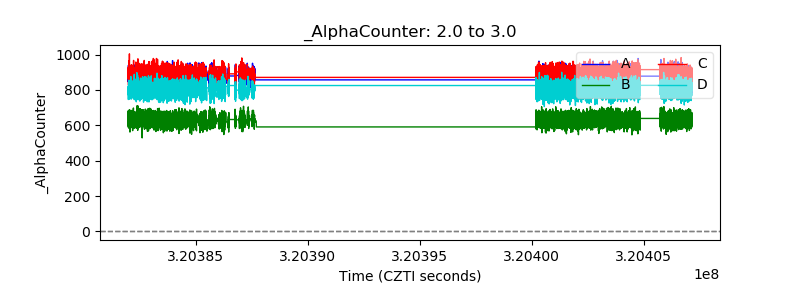 |
| _CPM_Rate | 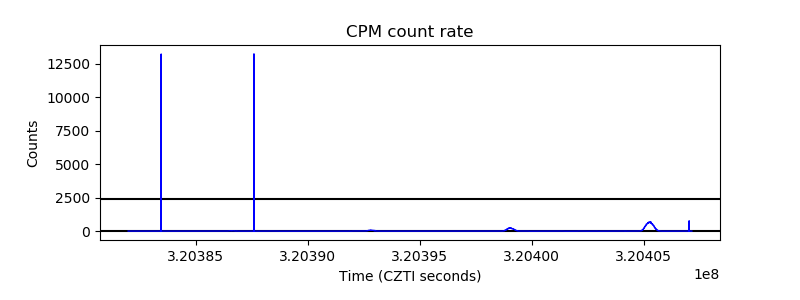 |
| CZT Counter | 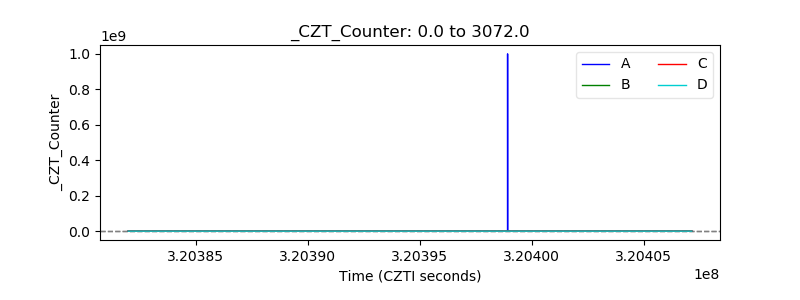 |
| +2.5 Volts monitor | 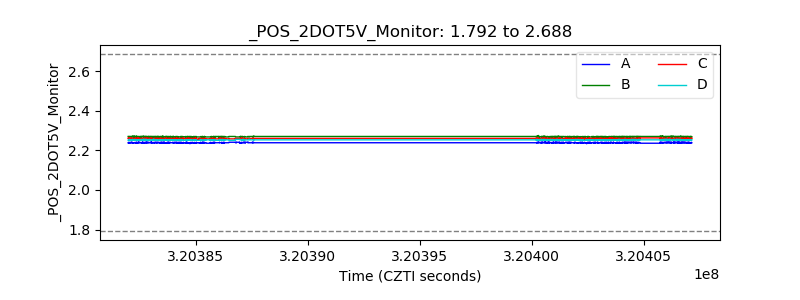 |
| +5 Volts monitor |  |
| _ROLL_ROT | 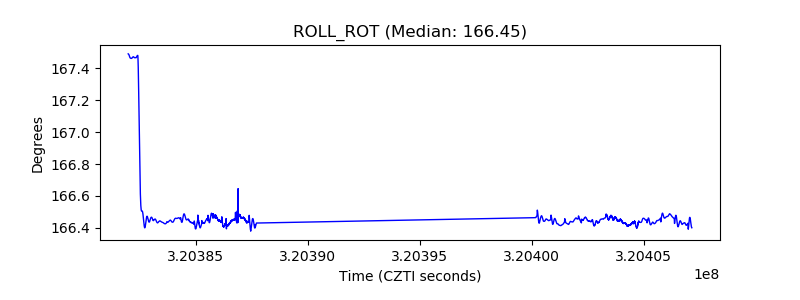 |
| _Roll_DEC | 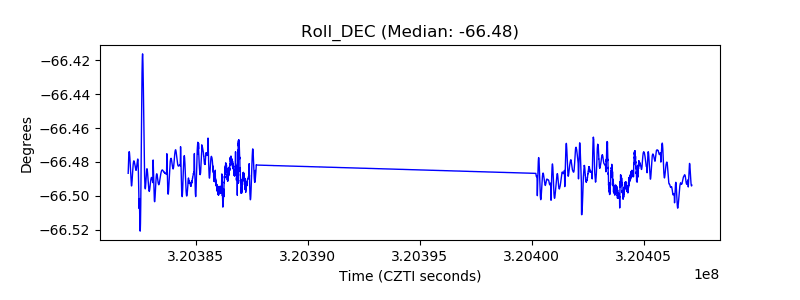 |
| _Roll_RA | 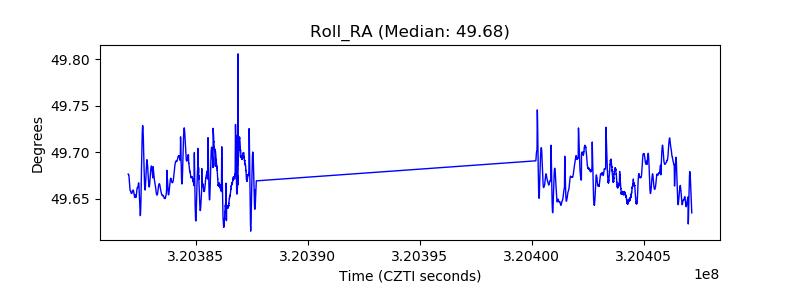 |
| Veto Counter | 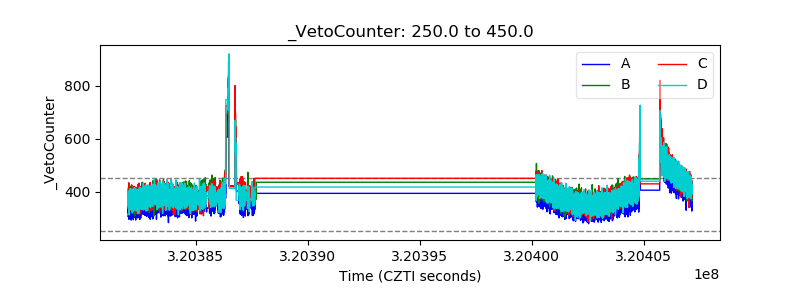 |