| Param | Original file | Final file |
|---|---|---|
| Filename | modeM0/AS1A07_149T01_9000003534_23867cztM0_level2.evt | modeM0/AS1A07_149T01_9000003534_23867cztM0_level2_quad_clean.evt |
| Size (bytes) | 863,789,760 | 181,252,800 |
| Size | 823.8 MB | 172.9 MB |
| Events in quadrant A | 5,347,078 | 1,227,665 |
| Events in quadrant B | 5,495,021 | 1,235,187 |
| Events in quadrant C | 5,635,656 | 1,150,075 |
| Events in quadrant D | 8,950,427 | 1,127,363 |
| Mode M0 | |||
|---|---|---|---|
| Quadrant | BADHDUFLAG | Total packets | Discarded packets |
| A | 0 | 23092 | 4 |
| B | 0 | 23481 | 2 |
| C | 0 | 23905 | 4 |
| D | 0 | 33985 | 2 |
| Mode SS | |||
|---|---|---|---|
| Quadrant | BADHDUFLAG | Total packets | Discarded packets |
| A | 0 | 220 | 0 |
| B | 0 | 220 | 0 |
| C | 0 | 220 | 0 |
| D | 0 | 220 | 0 |
| Mode M9 | |||
|---|---|---|---|
| Quadrant | BADHDUFLAG | Total packets | Discarded packets |
| A | 0 | 24 | 0 |
| B | 0 | 24 | 0 |
| C | 0 | 24 | 0 |
| D | 0 | 24 | 0 |
| Quadrant | Total seconds | Saturated seconds | Saturation percentage |
|---|---|---|---|
| A | 10827 | 117 | 1.080632% |
| B | 10828 | 113 | 1.043591% |
| C | 10827 | 191 | 1.764108% |
| D | 10828 | 485 | 4.479128% |
Noise dominated data is calculated using 1-second bins in cleaned event files. If a bin has >2000 counts, and if more than 50% of those come from <1% of pixels, then it is considered to be noise-dominated and hence unusable.
| Quadrant | # 1 sec bins | Bins with >0 counts | Bins with >2000 counts | High rate bins dominated by noise | Noise dominated (total time) | Noise dominated (detector-on time) | Marked lightcurve |
|---|---|---|---|---|---|---|---|
| A | 13252 | 10829 | 4 | 4 | 0.03% | 0.04% | 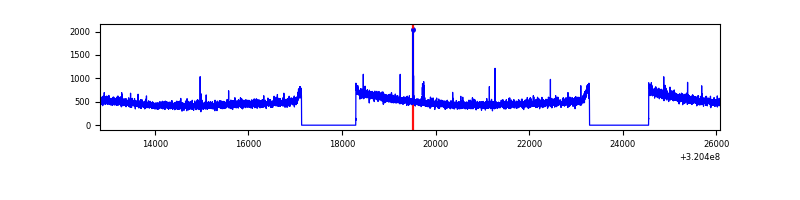 |
| B | 13253 | 10830 | 11 | 11 | 0.08% | 0.10% | 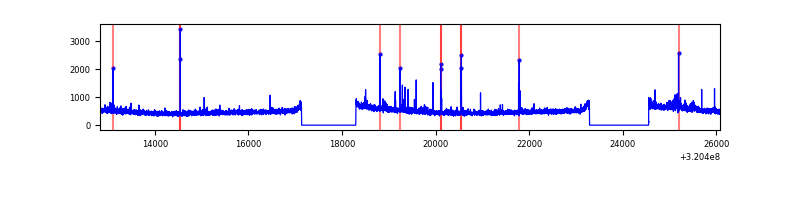 |
| C | 13253 | 10830 | 22 | 22 | 0.17% | 0.20% | 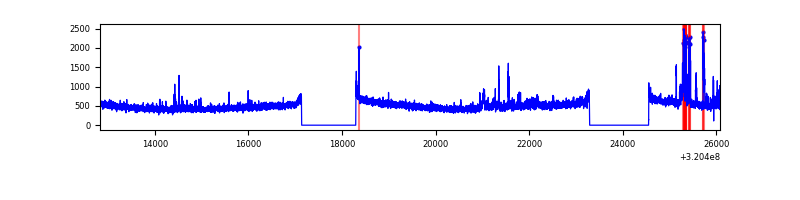 |
| D | 13253 | 10830 | 308 | 308 | 2.32% | 2.84% | 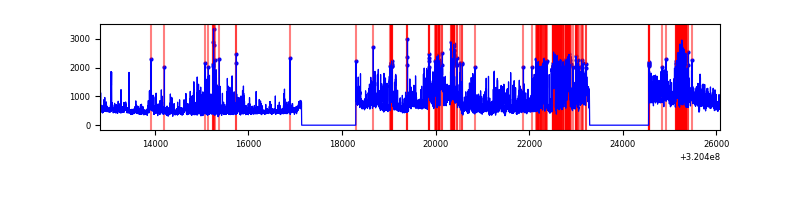 |
Top three noisy pixels from each quadrant. If the there are fewer than three noisy pixels in the level2.evt file, extra rows are filled as -1
| Pixel properties | Quadrant properties | ||||||
|---|---|---|---|---|---|---|---|
| Quadrant | DetID | PixID | Counts | Sigma | Mean | Median | Sigma |
| A | 4 | 2 | 20784 | 71.16 | 1377 | 1349 | 273.1 |
| A | 2 | 250 | 20497 | 70.11 | 1377 | 1349 | 273.1 |
| A | 13 | 254 | 18735 | 63.66 | 1377 | 1349 | 273.1 |
| B | 0 | 189 | 57639 | 222.98 | 1359 | 1331 | 252.5 |
| B | 0 | 190 | 30607 | 115.93 | 1359 | 1331 | 252.5 |
| B | 12 | 111 | 29588 | 111.9 | 1359 | 1331 | 252.5 |
| C | 7 | 247 | 327633 | 1113.93 | 1278 | 1286 | 293.0 |
| C | 14 | 238 | 210003 | 712.42 | 1278 | 1286 | 293.0 |
| C | 0 | 10 | 105658 | 356.26 | 1278 | 1286 | 293.0 |
| D | 8 | 195 | 1887021 | 5955.37 | 1307 | 1268 | 316.6 |
| D | 9 | 35 | 1443877 | 4555.88 | 1307 | 1268 | 316.6 |
| D | 1 | 52 | 460452 | 1450.14 | 1307 | 1268 | 316.6 |
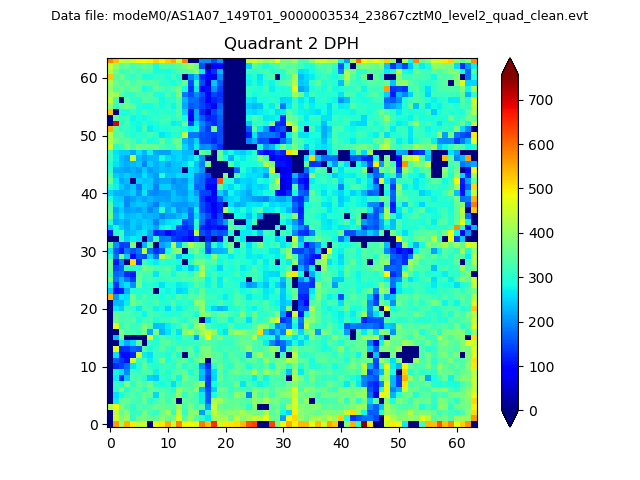
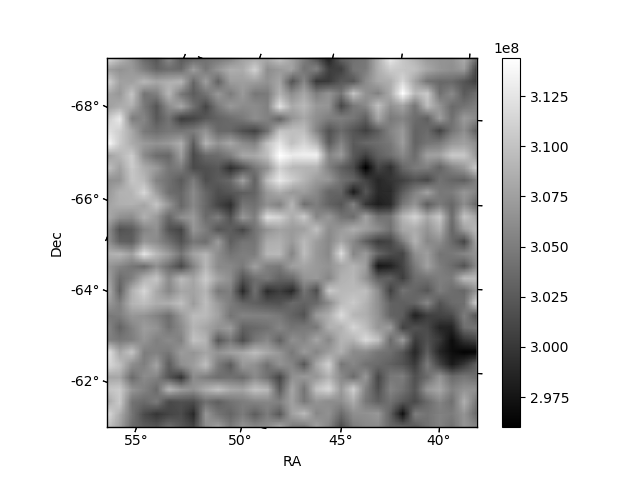
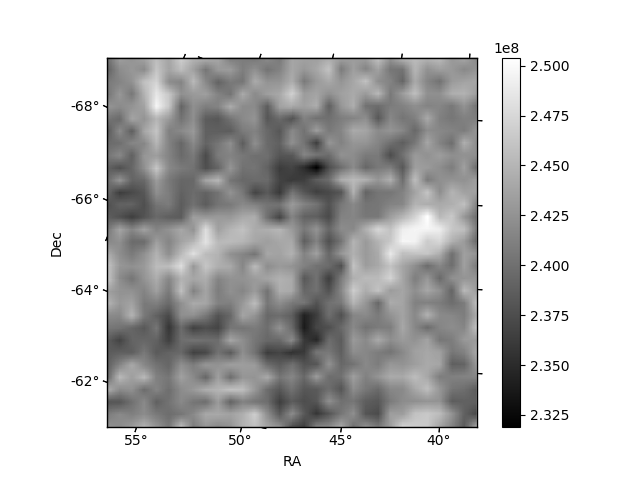
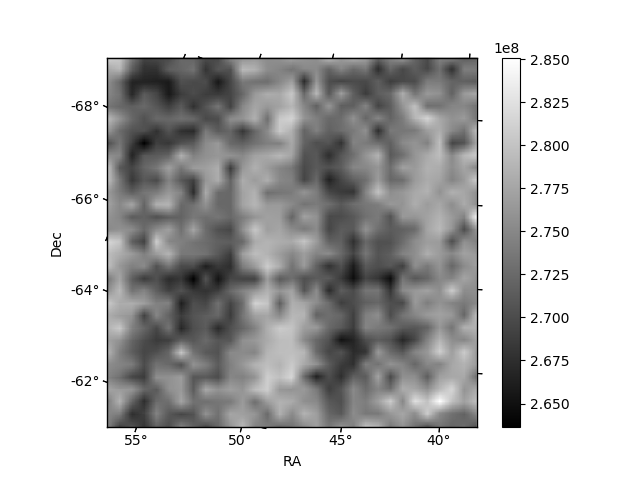
Histogram calculated using DETX and DETY for each event in the final _common_clean file
| Quadrant A | 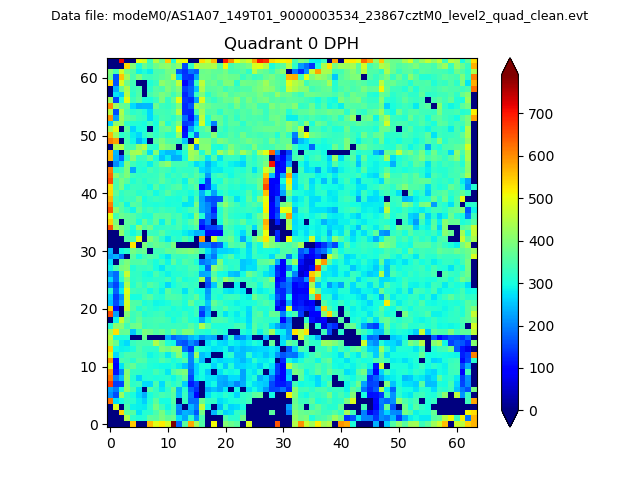 |
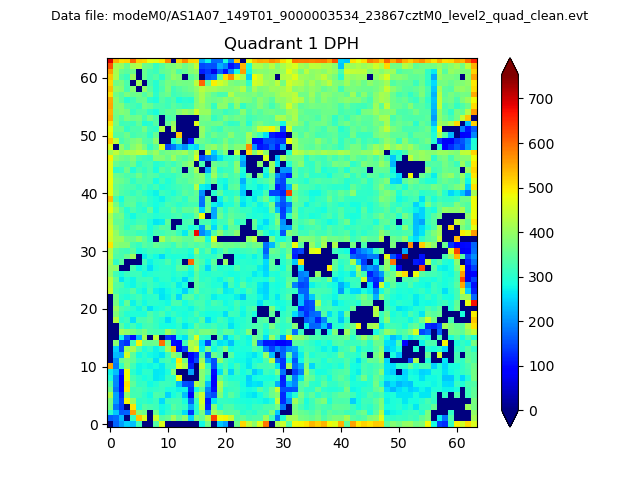 |
Quadrant B |
|---|---|---|---|
| Quadrant D | 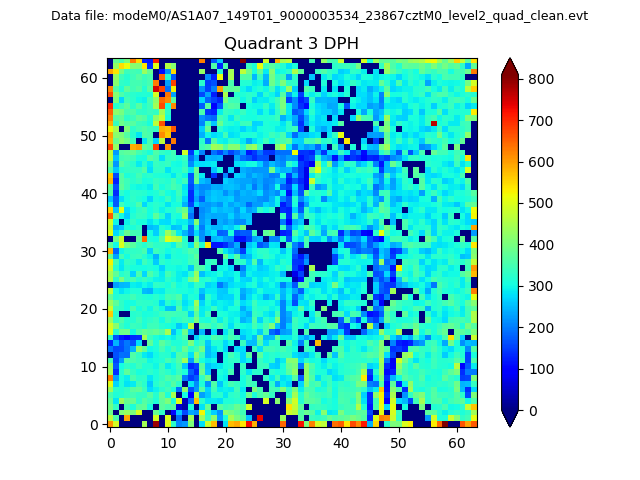 |
 |
Quadrant C |
| Plot type | Count rate plots | Images |
|---|---|---|
| Comparison with Poisson distribution Blue bars denote a histogram of data divided into 1 sec bins. Red curve is a Poisson curve with rate = median count rate of data. |
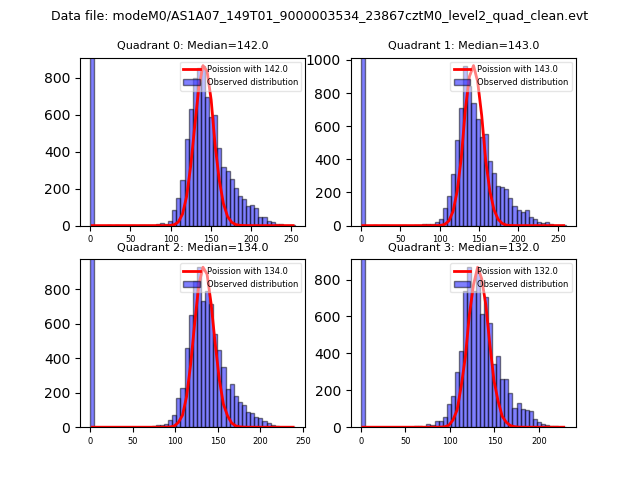 |
 |
| Quadrant-wise count rates Data is divided into 100 sec bins |
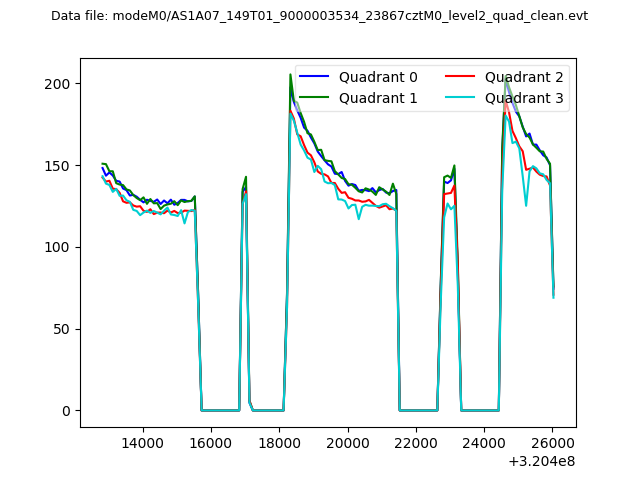 |
|
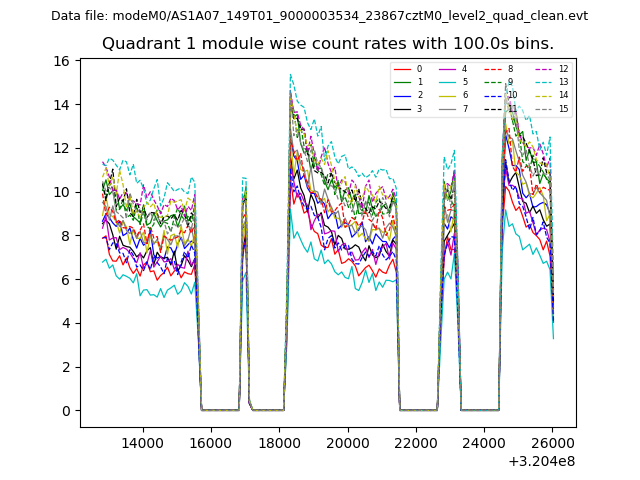
| Module-wise count rates for Quadrant A Data is divided into 100 sec bins |
 |
 |
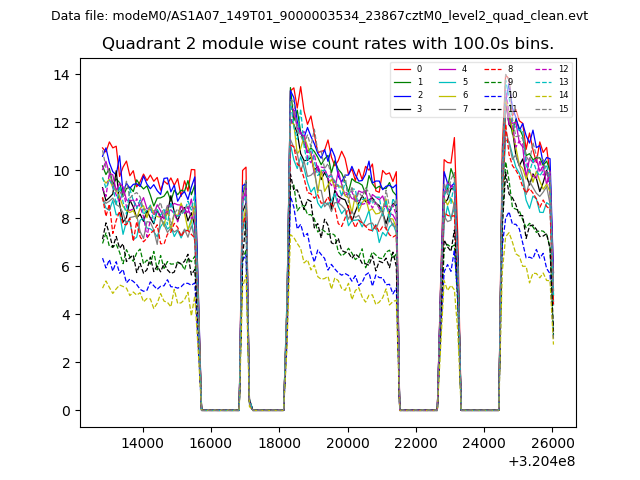
| Module-wise count rates for Quadrant B Data is divided into 100 sec bins |
 |
 |
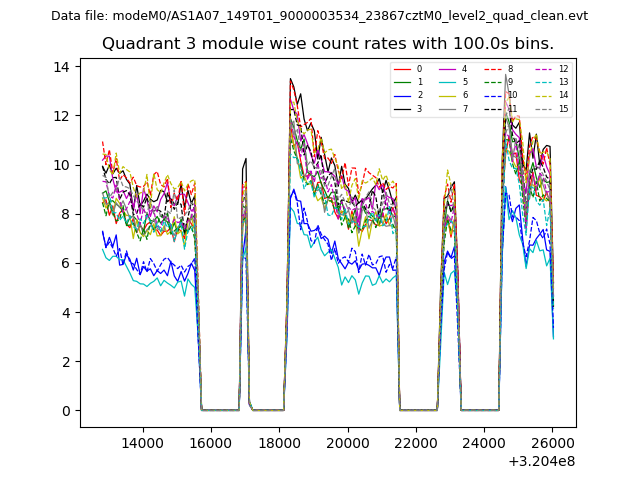
| Module-wise count rates for Quadrant C Data is divided into 100 sec bins |
 |
 |
| Module-wise count rates for Quadrant D Data is divided into 100 sec bins |
 |
 |
| Parameter | Plot |
|---|---|
| CZT HV Monitor | 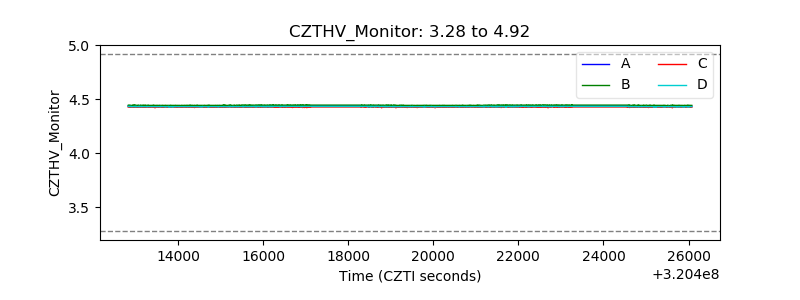 |
| D_VDD | 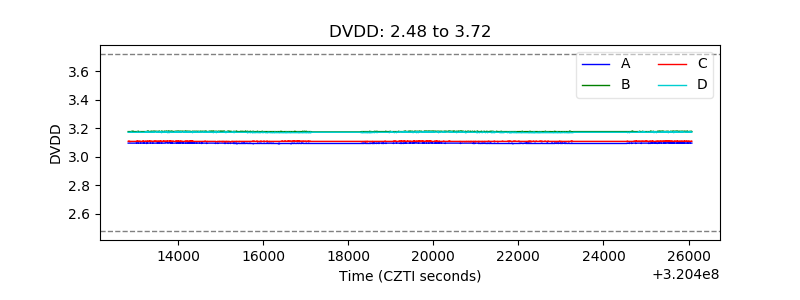 |
| Temperature 1 | 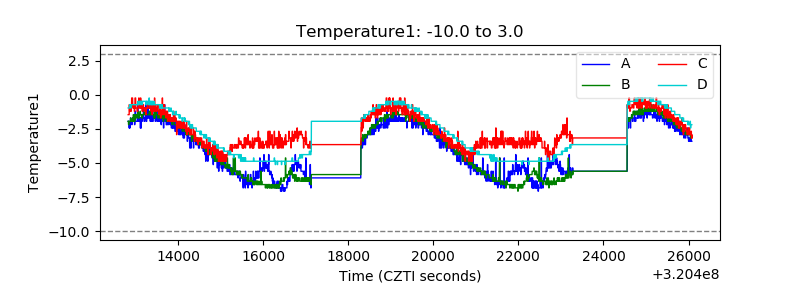 |
| Veto HV Monitor | 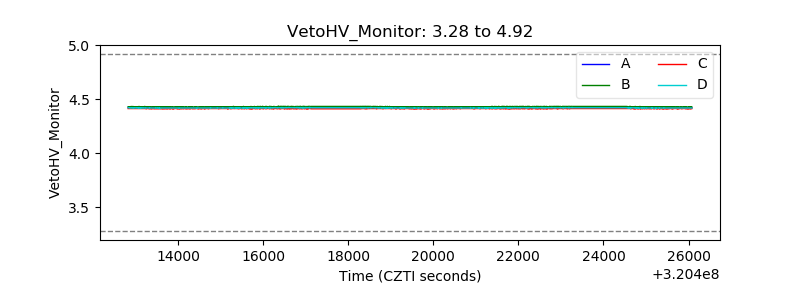 |
| Veto LLD | 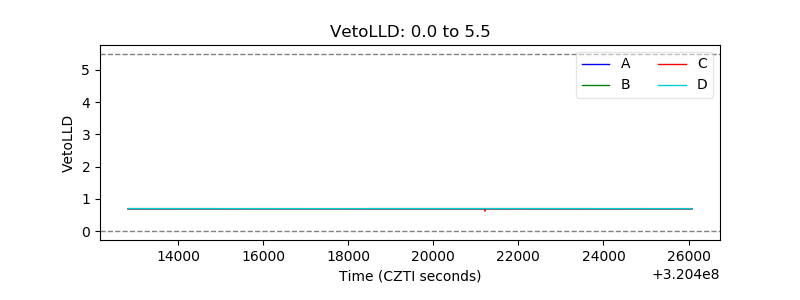 |
| Alpha Counter | 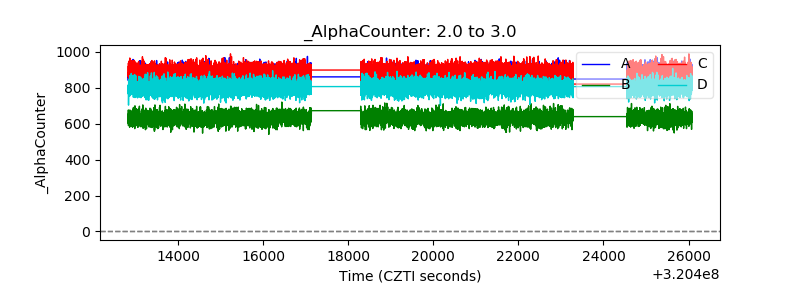 |
| _CPM_Rate | 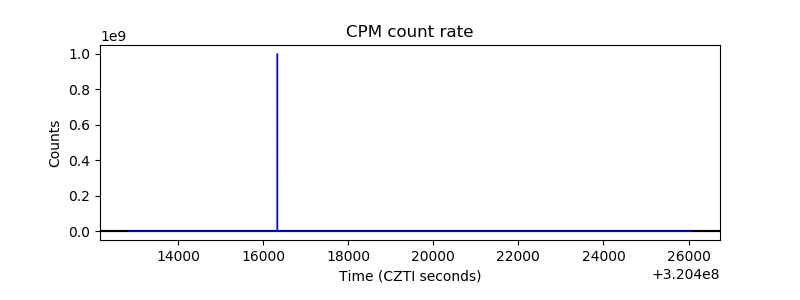 |
| CZT Counter | 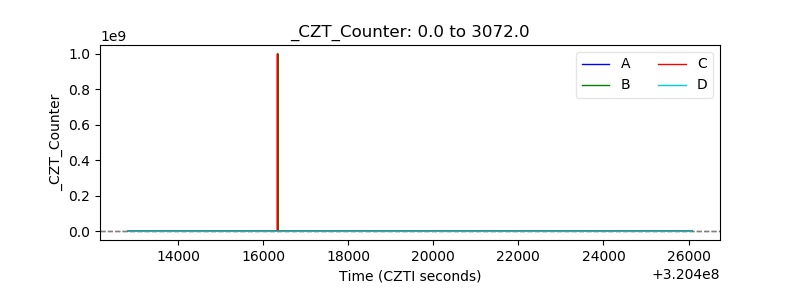 |
| +2.5 Volts monitor |  |
| +5 Volts monitor |  |
| _ROLL_ROT |  |
| _Roll_DEC | 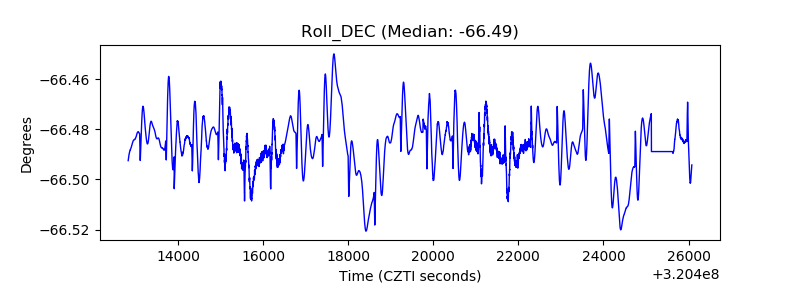 |
| _Roll_RA | 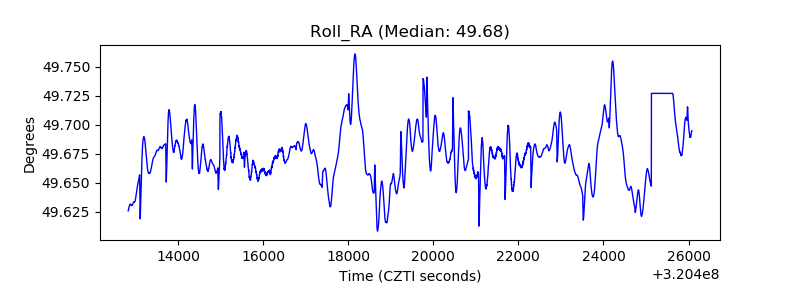 |
| Veto Counter | 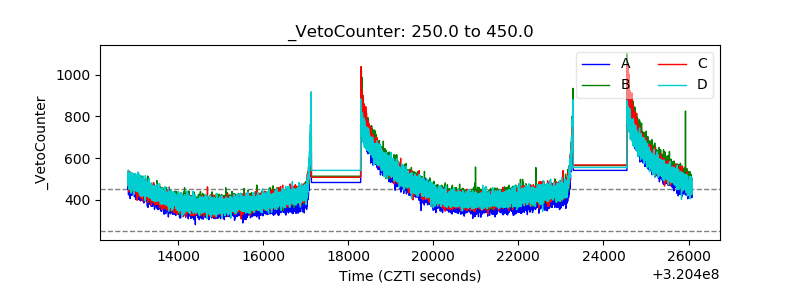 |