| Param | Original file | Final file |
|---|---|---|
| Filename | modeM0/AS1A07_149T01_9000003534_23868cztM0_level2.evt | modeM0/AS1A07_149T01_9000003534_23868cztM0_level2_quad_clean.evt |
| Size (bytes) | 200,292,480 | 45,584,640 |
| Size | 191.0 MB | 43.5 MB |
| Events in quadrant A | 1,061,720 | 324,848 |
| Events in quadrant B | 1,129,853 | 325,945 |
| Events in quadrant C | 1,428,864 | 296,025 |
| Events in quadrant D | 2,306,735 | 286,966 |
| Mode M0 | |||
|---|---|---|---|
| Quadrant | BADHDUFLAG | Total packets | Discarded packets |
| A | 0 | 4489 | 0 |
| B | 0 | 4744 | 0 |
| C | 0 | 5631 | 0 |
| D | 0 | 8280 | 0 |
| Mode SS | |||
|---|---|---|---|
| Quadrant | BADHDUFLAG | Total packets | Discarded packets |
| A | 0 | 40 | 0 |
| B | 0 | 40 | 0 |
| C | 0 | 40 | 0 |
| D | 0 | 40 | 0 |
| Quadrant | Total seconds | Saturated seconds | Saturation percentage |
|---|---|---|---|
| A | 2014 | 1 | 0.049652% |
| B | 2014 | 2 | 0.099305% |
| C | 2015 | 43 | 2.133995% |
| D | 2015 | 173 | 8.585608% |
Noise dominated data is calculated using 1-second bins in cleaned event files. If a bin has >2000 counts, and if more than 50% of those come from <1% of pixels, then it is considered to be noise-dominated and hence unusable.
| Quadrant | # 1 sec bins | Bins with >0 counts | Bins with >2000 counts | High rate bins dominated by noise | Noise dominated (total time) | Noise dominated (detector-on time) | Marked lightcurve |
|---|---|---|---|---|---|---|---|
| A | 2014 | 2014 | 0 | 0 | 0.00% | 0.00% | 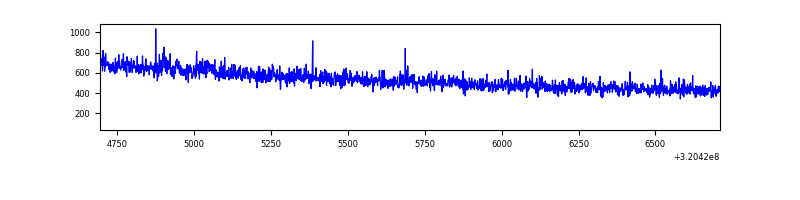 |
| B | 2014 | 2014 | 3 | 3 | 0.15% | 0.15% | 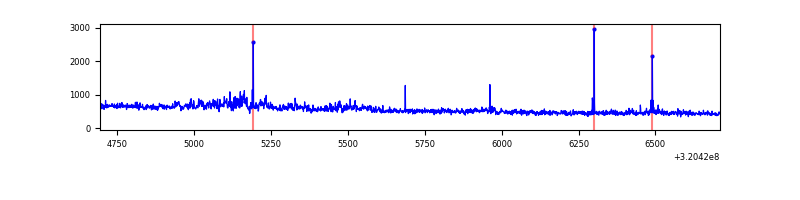 |
| C | 2015 | 2015 | 21 | 21 | 1.04% | 1.04% | 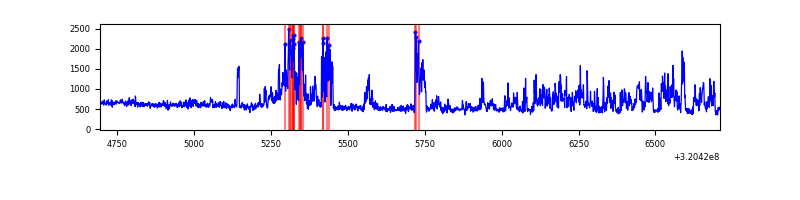 |
| D | 2015 | 2015 | 150 | 150 | 7.44% | 7.44% | 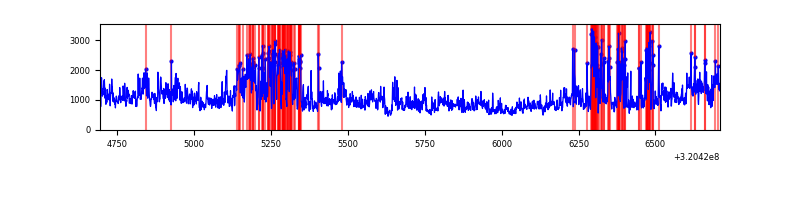 |
Top three noisy pixels from each quadrant. If the there are fewer than three noisy pixels in the level2.evt file, extra rows are filled as -1
| Pixel properties | Quadrant properties | ||||||
|---|---|---|---|---|---|---|---|
| Quadrant | DetID | PixID | Counts | Sigma | Mean | Median | Sigma |
| A | 2 | 250 | 7372 | 127.31 | 273 | 268 | 55.8 |
| A | 13 | 254 | 3588 | 59.5 | 273 | 268 | 55.8 |
| A | 0 | 226 | 2493 | 39.87 | 273 | 268 | 55.8 |
| B | 0 | 189 | 58573 | 1142.5 | 266 | 261 | 51.0 |
| B | 15 | 32 | 10103 | 192.83 | 266 | 261 | 51.0 |
| B | 0 | 219 | 6735 | 126.84 | 266 | 261 | 51.0 |
| C | 7 | 247 | 414520 | 7207.81 | 245 | 246 | 57.5 |
| C | 14 | 238 | 41262 | 713.62 | 245 | 246 | 57.5 |
| C | 0 | 207 | 9163 | 155.14 | 245 | 246 | 57.5 |
| D | 8 | 195 | 791793 | 12806.15 | 250 | 243 | 61.8 |
| D | 1 | 52 | 290727 | 4699.62 | 250 | 243 | 61.8 |
| D | 9 | 35 | 213589 | 3451.63 | 250 | 243 | 61.8 |
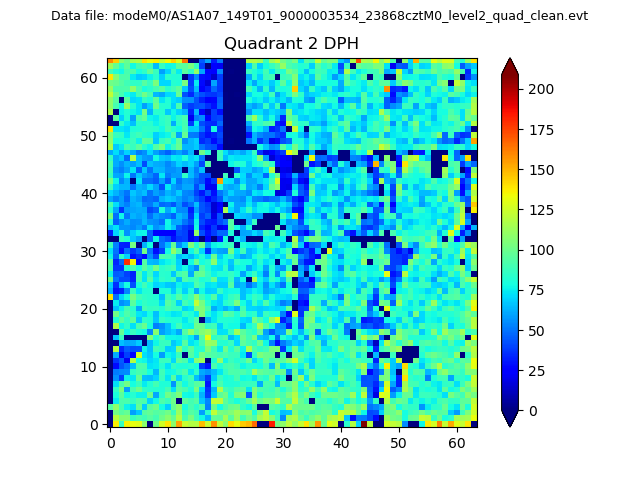
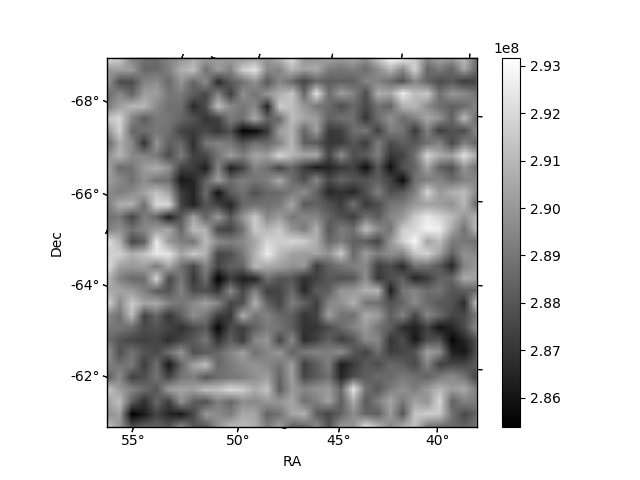
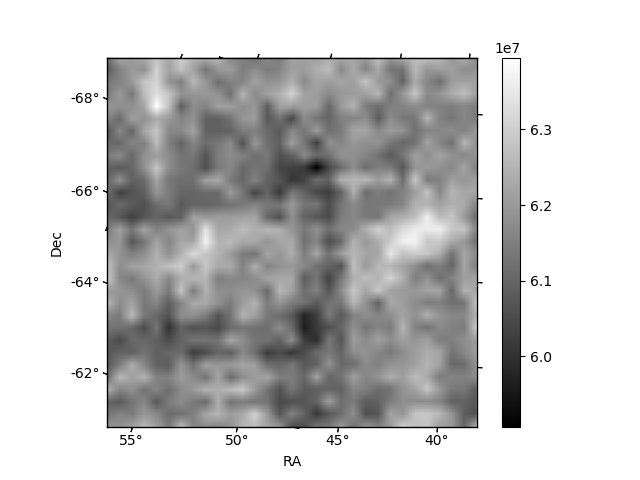
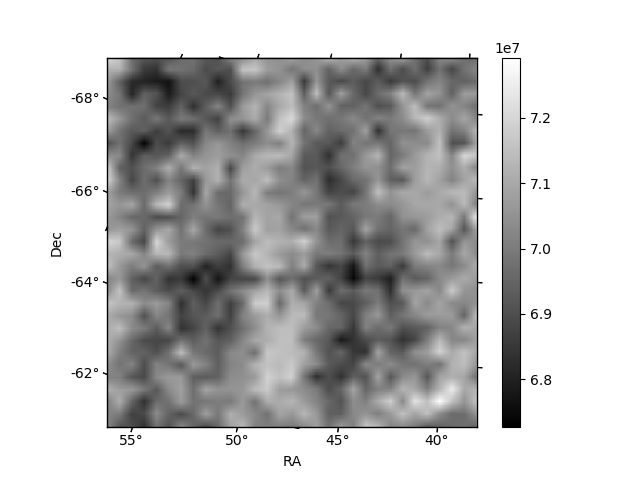
Histogram calculated using DETX and DETY for each event in the final _common_clean file
| Quadrant A | 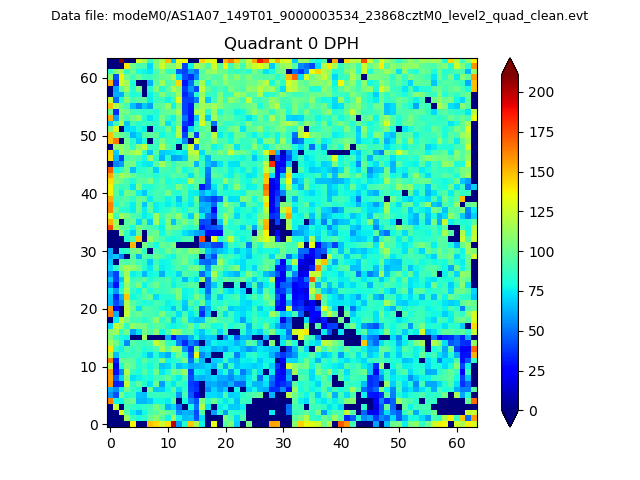 |
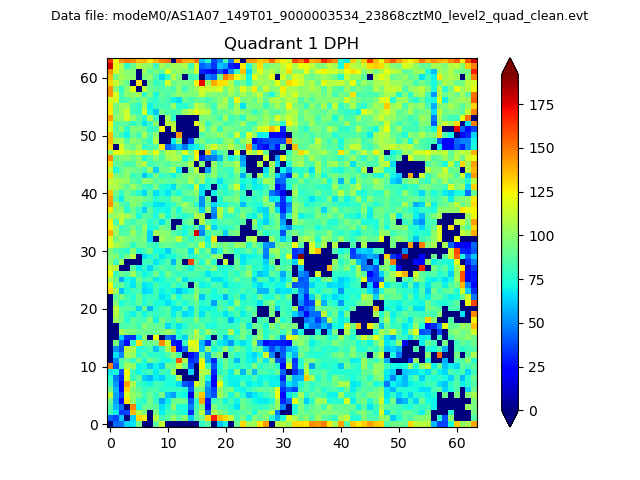 |
Quadrant B |
|---|---|---|---|
| Quadrant D | 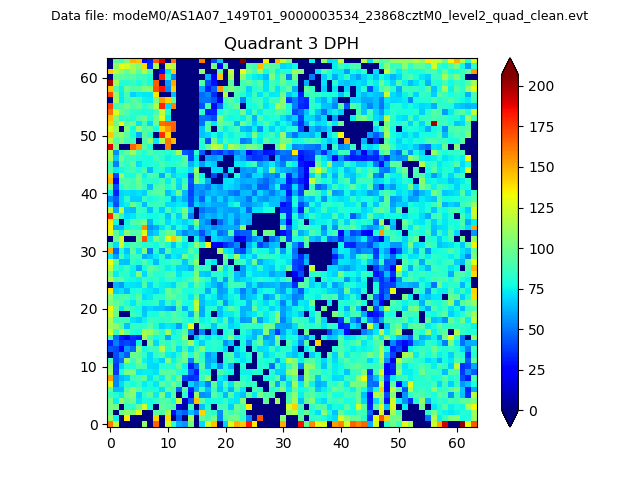 |
 |
Quadrant C |
| Plot type | Count rate plots | Images |
|---|---|---|
| Comparison with Poisson distribution Blue bars denote a histogram of data divided into 1 sec bins. Red curve is a Poisson curve with rate = median count rate of data. |
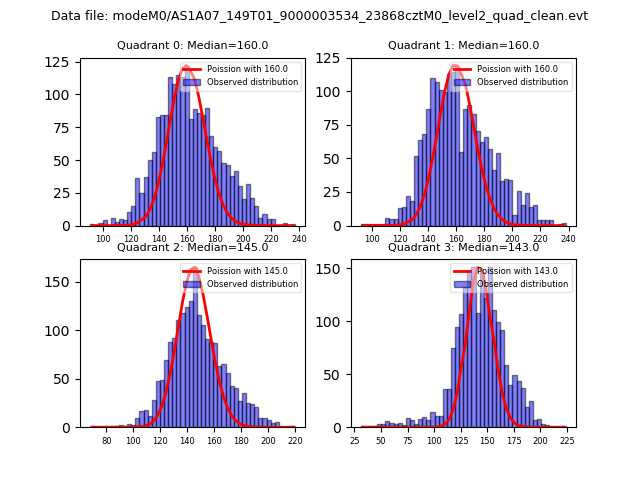 |
 |
| Quadrant-wise count rates Data is divided into 100 sec bins |
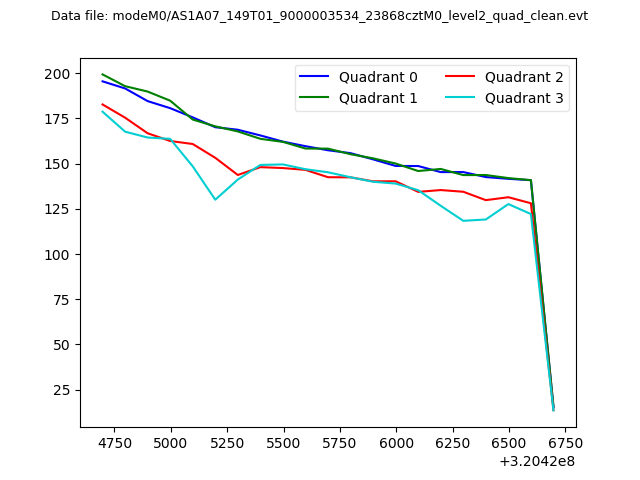 |
|
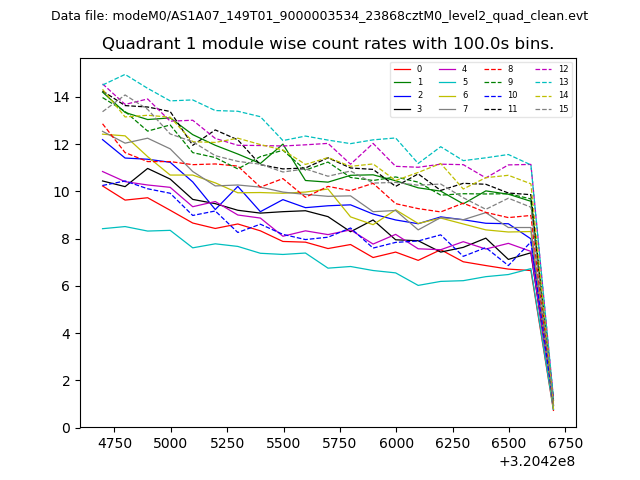
| Module-wise count rates for Quadrant A Data is divided into 100 sec bins |
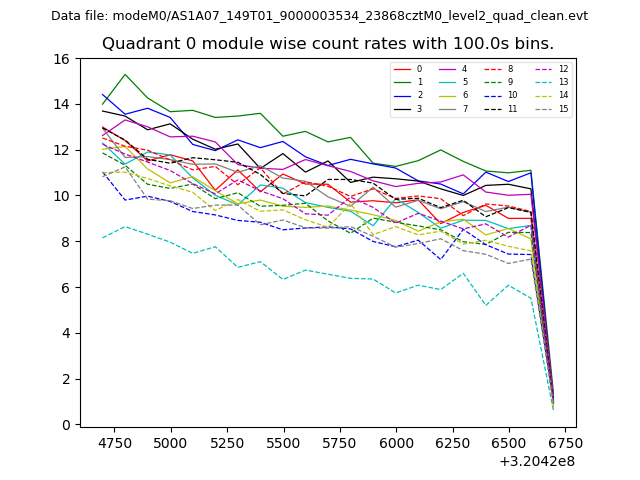 |
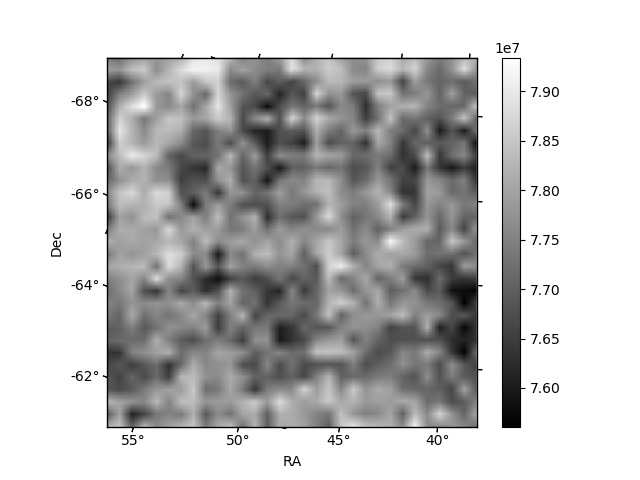 |
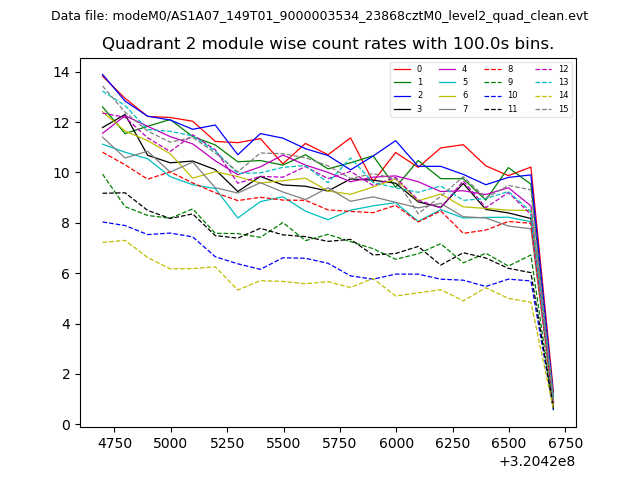
| Module-wise count rates for Quadrant B Data is divided into 100 sec bins |
 |
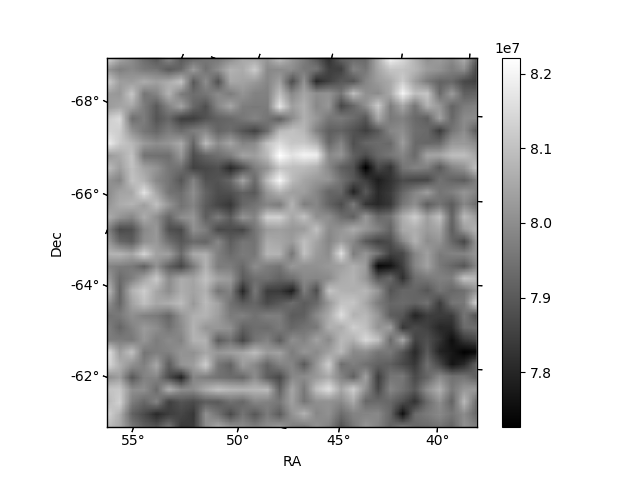 |
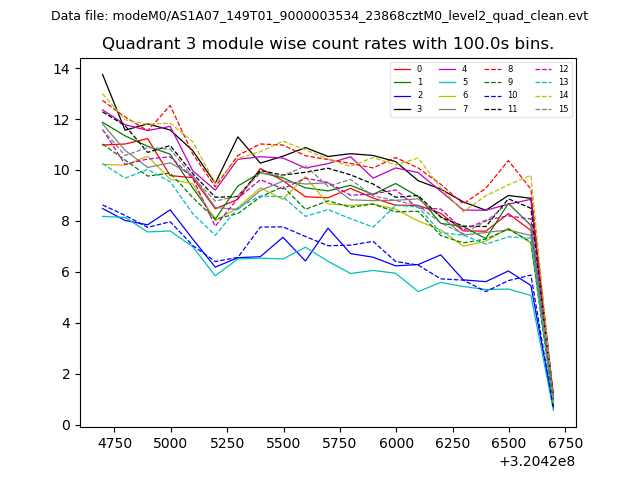
| Module-wise count rates for Quadrant C Data is divided into 100 sec bins |
 |
 |
| Module-wise count rates for Quadrant D Data is divided into 100 sec bins |
 |
 |
| Parameter | Plot |
|---|---|
| CZT HV Monitor | 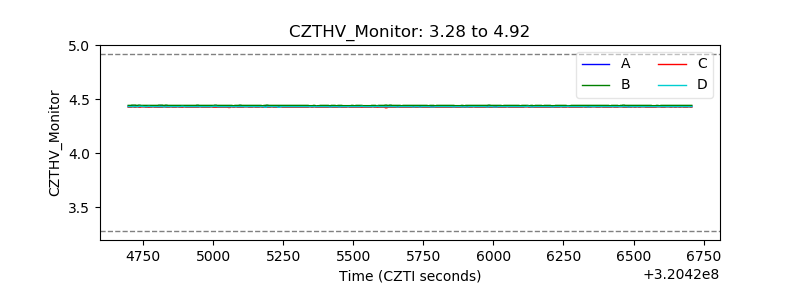 |
| D_VDD | 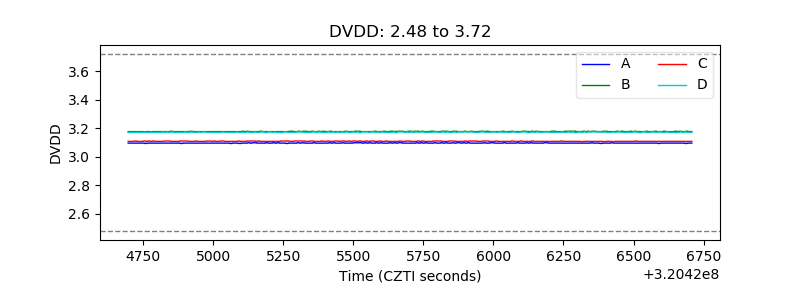 |
| Temperature 1 | 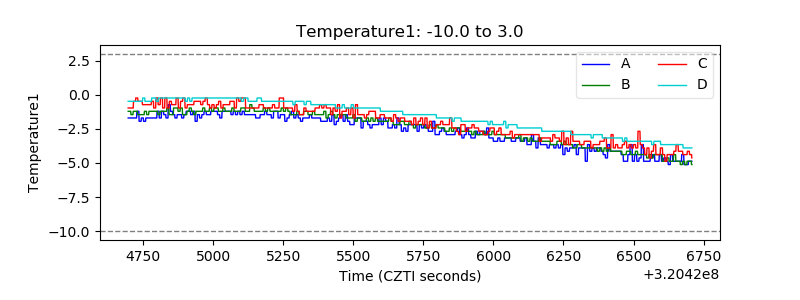 |
| Veto HV Monitor | 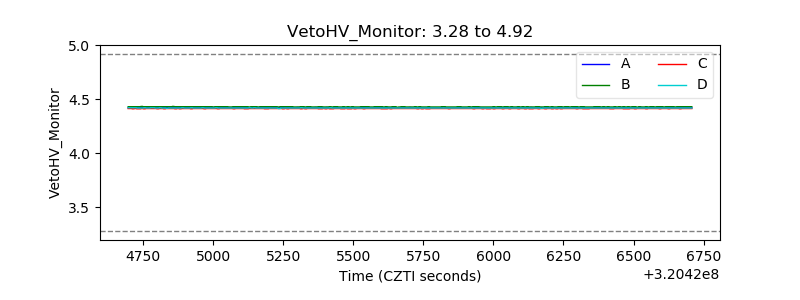 |
| Veto LLD | 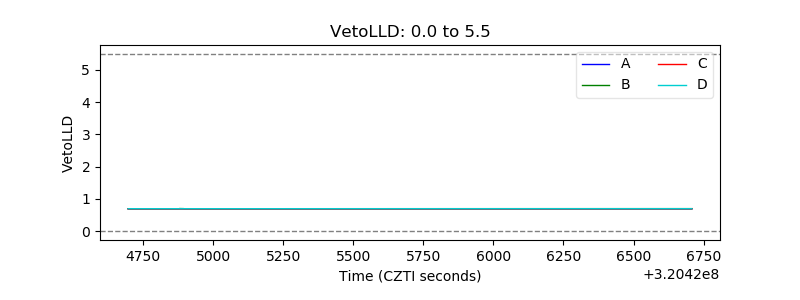 |
| Alpha Counter | 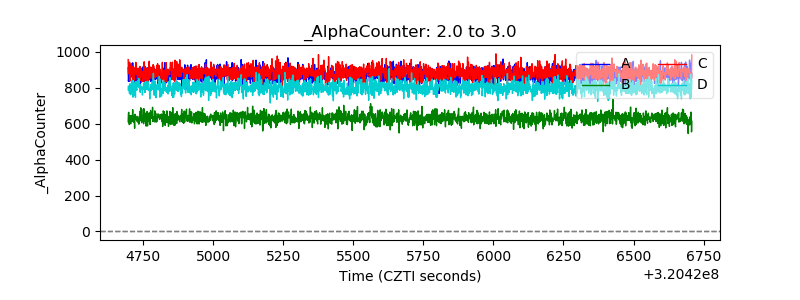 |
| _CPM_Rate | 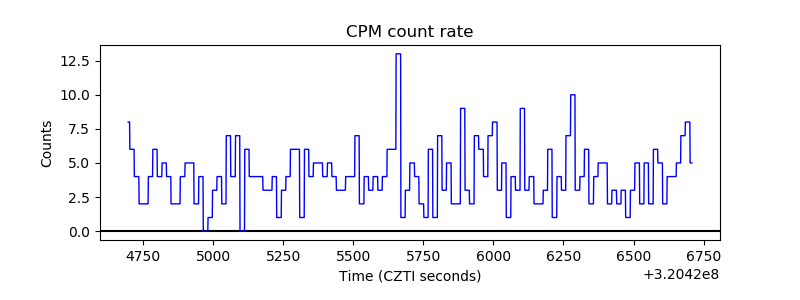 |
| CZT Counter | 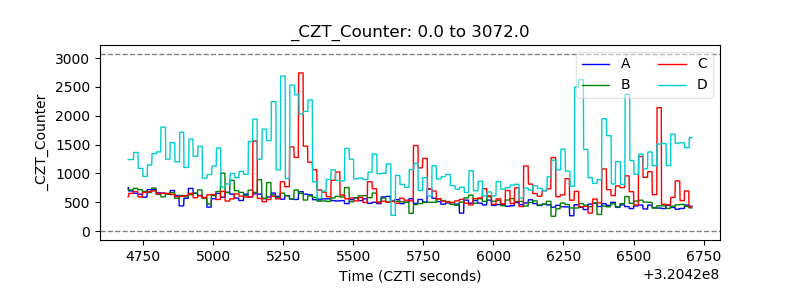 |
| +2.5 Volts monitor |  |
| +5 Volts monitor |  |
| _ROLL_ROT | 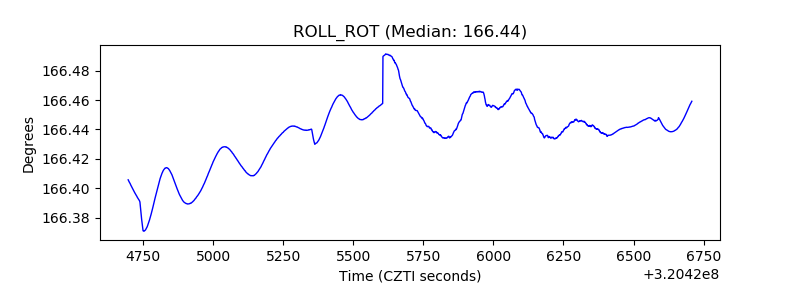 |
| _Roll_DEC |  |
| _Roll_RA | 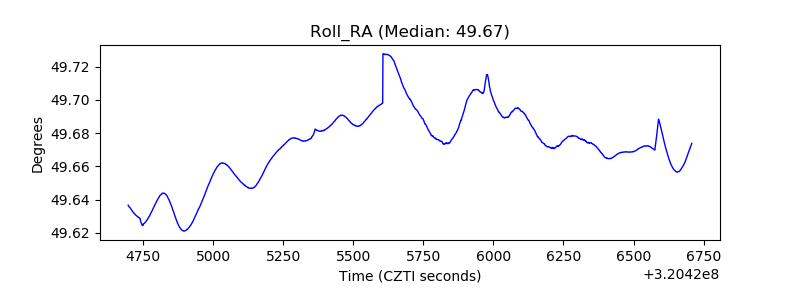 |
| Veto Counter | 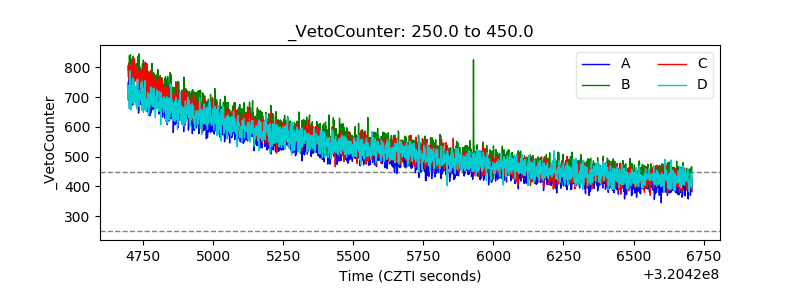 |