| Param | Original file | Final file |
|---|---|---|
| Filename | modeM0/AS1A07_001T01_9000003538cztM0_level2.fits | modeM0/AS1A07_001T01_9000003538cztM0_level2_quad_clean.evt |
| Size (bytes) | 263,312,640 | 348,776,640 |
| Size | 251.1 MB | 332.6 MB |
| Events in quadrant A | 1,611,684 | 2,275,183 |
| Events in quadrant B | 1,557,478 | 2,301,602 |
| Events in quadrant C | 1,582,042 | 2,158,210 |
| Events in quadrant D | 1,375,780 | 1,980,785 |
| Mode M9 | |||
|---|---|---|---|
| Quadrant | BADHDUFLAG | Total packets | Discarded packets |
| A | 0 | 32 | 0 |
| B | 0 | 32 | 0 |
| C | 0 | 32 | 0 |
| D | 0 | 32 | 0 |
| Mode M0 | |||
|---|---|---|---|
| Quadrant | BADHDUFLAG | Total packets | Discarded packets |
| A | 0 | 55848 | 0 |
| B | 0 | 55636 | 0 |
| C | 0 | 55916 | 0 |
| D | 0 | 63891 | 0 |
| Mode SS | |||
|---|---|---|---|
| Quadrant | BADHDUFLAG | Total packets | Discarded packets |
| A | 0 | 546 | 0 |
| B | 0 | 546 | 0 |
| C | 0 | 546 | 0 |
| D | 0 | 546 | 0 |
| Quadrant | Total seconds | Saturated seconds | Saturation percentage |
|---|---|---|---|
| A | 26868 | 164 | 0.610392% |
| B | 26868 | 166 | 0.617835% |
| C | 26868 | 315 | 1.172398% |
| D | 26868 | 339 | 1.261724% |
Noise dominated data is calculated using 1-second bins in cleaned event files. If a bin has >2000 counts, and if more than 50% of those come from <1% of pixels, then it is considered to be noise-dominated and hence unusable.
| Quadrant | # 1 sec bins | Bins with >0 counts | Bins with >2000 counts | High rate bins dominated by noise | Noise dominated (total time) | Noise dominated (detector-on time) | Marked lightcurve |
|---|---|---|---|---|---|---|---|
| A | 30128 | 26868 | 0 | 0 | 0.00% | 0.00% |  |
| B | 30128 | 26868 | 0 | 0 | 0.00% | 0.00% | 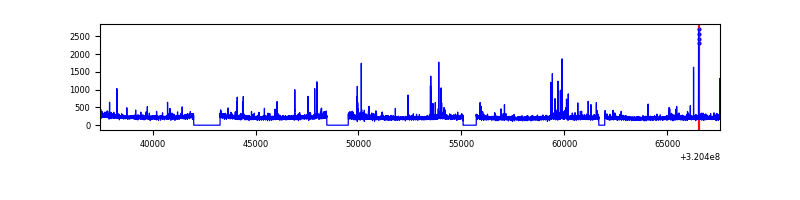 |
| C | 30128 | 26868 | 0 | 0 | 0.00% | 0.00% |  |
| D | 30128 | 26864 | 0 | 0 | 0.00% | 0.00% |  |
Top three noisy pixels from each quadrant. If the there are fewer than three noisy pixels in the level2.evt file, extra rows are filled as -1
| Pixel properties | Quadrant properties | ||||||
|---|---|---|---|---|---|---|---|
| Quadrant | DetID | PixID | Counts | Sigma | Mean | Median | Sigma |
| A | 0 | 29 | 1599 | 11.43 | 420 | 397 | 105.2 |
| A | 7 | 110 | 1304 | 8.63 | 420 | 397 | 105.2 |
| A | 0 | 30 | 1253 | 8.14 | 420 | 397 | 105.2 |
| B | 2 | 9 | 1237 | 10.29 | 412 | 396 | 81.8 |
| B | 5 | 128 | 1050 | 8.0 | 412 | 396 | 81.8 |
| B | 2 | 8 | 1048 | 7.97 | 412 | 396 | 81.8 |
| C | 1 | 81 | 1227 | 7.81 | 417 | 393 | 106.8 |
| C | 1 | 80 | 1211 | 7.66 | 417 | 393 | 106.8 |
| C | 12 | 241 | 1111 | 6.72 | 417 | 393 | 106.8 |
| D | 3 | 14 | 1037 | 6.38 | 392 | 358 | 106.4 |
| D | 15 | 46 | 992 | 5.96 | 392 | 358 | 106.4 |
| D | 6 | 38 | 980 | 5.85 | 392 | 358 | 106.4 |
Histogram calculated using DETX and DETY for each event in the final _common_clean file
| Quadrant A | 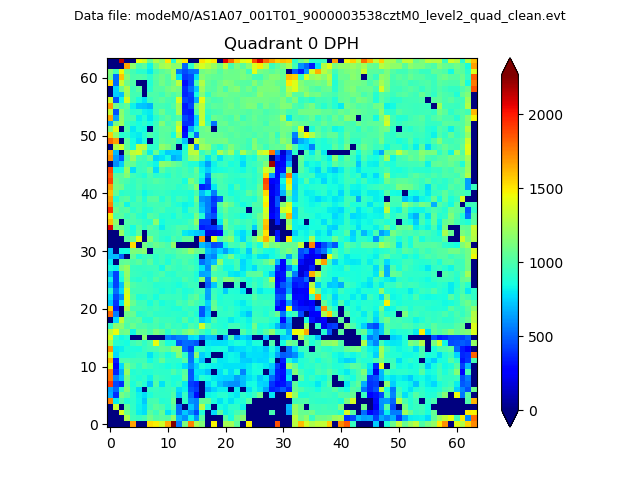 |
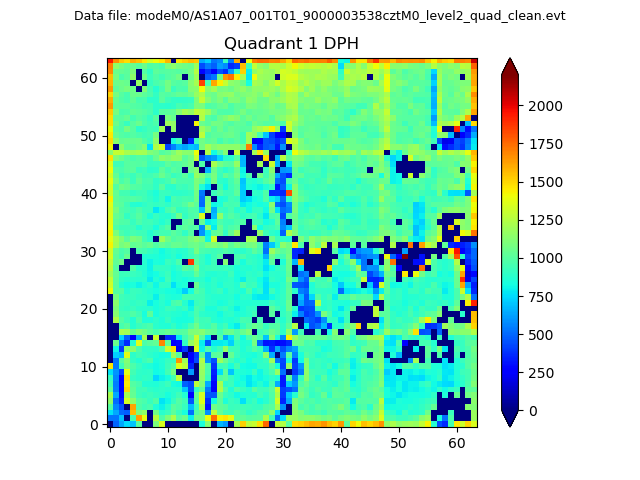 |
Quadrant B |
|---|---|---|---|
| Quadrant D | 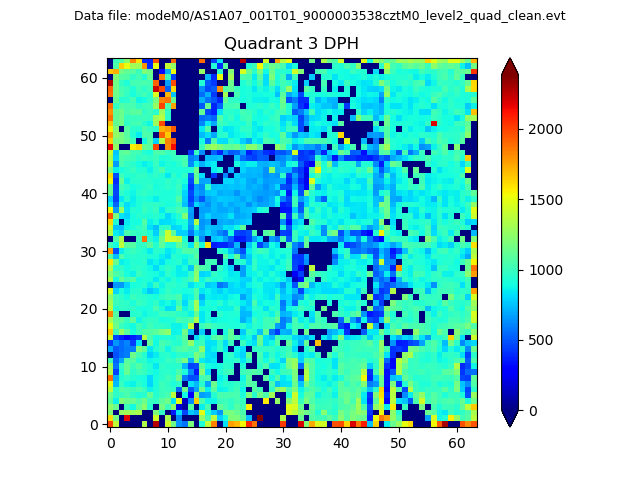 |
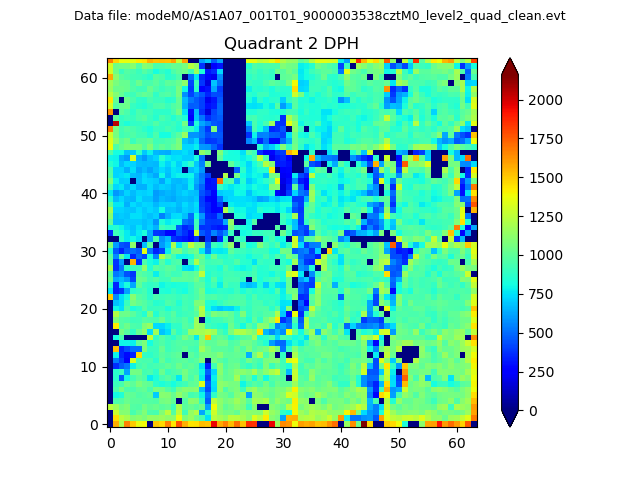 |
Quadrant C |
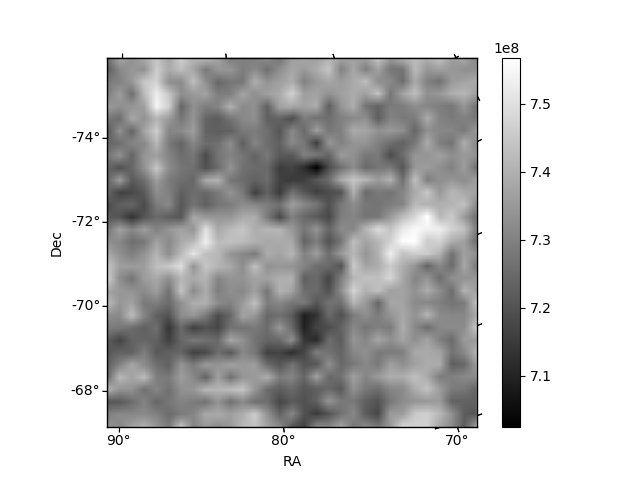
| Plot type | Count rate plots | Images |
|---|---|---|
| Comparison with Poisson distribution Blue bars denote a histogram of data divided into 1 sec bins. Red curve is a Poisson curve with rate = median count rate of data. |
 |
 |
| Quadrant-wise count rates Data is divided into 100 sec bins |
 |
|
| Module-wise count rates for Quadrant A Data is divided into 100 sec bins |
 |
 |
| Module-wise count rates for Quadrant B Data is divided into 100 sec bins |
 |
 |
| Module-wise count rates for Quadrant C Data is divided into 100 sec bins |
 |
 |
| Module-wise count rates for Quadrant D Data is divided into 100 sec bins |
 |
 |
| Parameter | Plot |
|---|---|
| CZT HV Monitor |  |
| D_VDD | 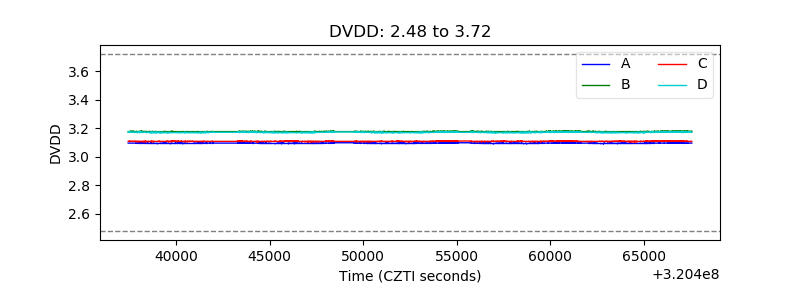 |
| Temperature 1 | 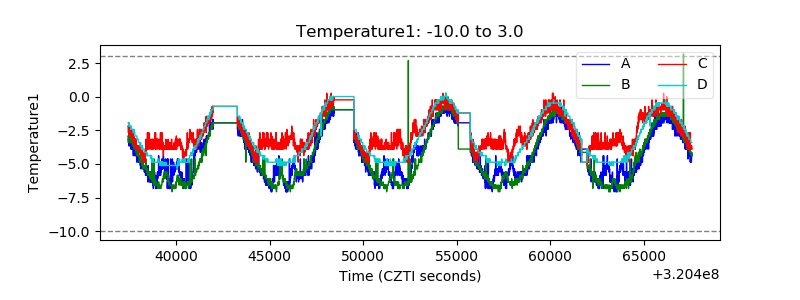 |
| Veto HV Monitor | 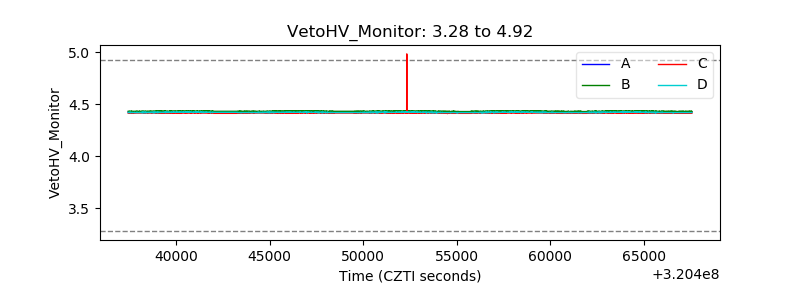 |
| Veto LLD | 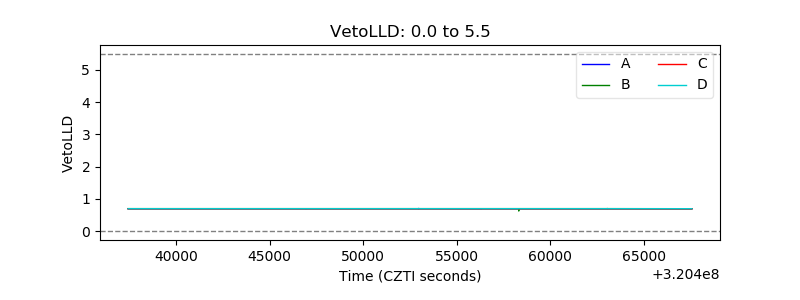 |
| Alpha Counter |  |
| _CPM_Rate | 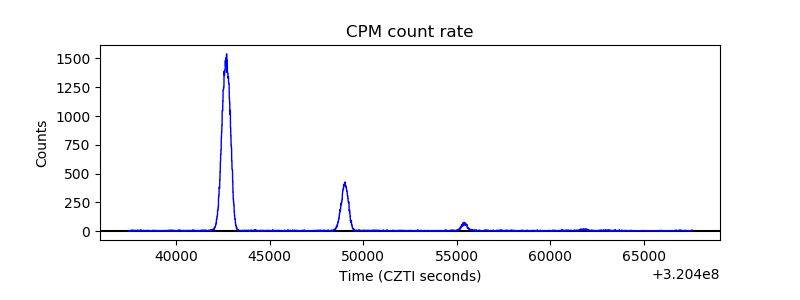 |
| CZT Counter | 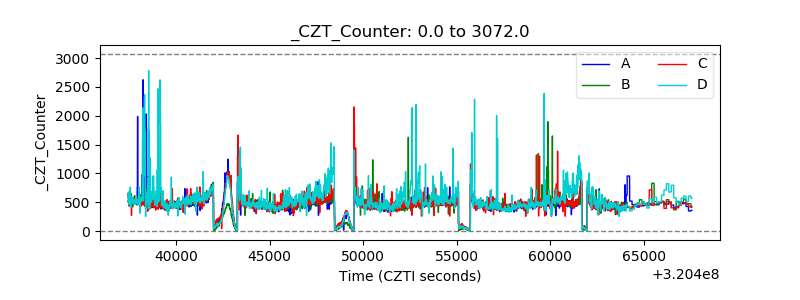 |
| +2.5 Volts monitor |  |
| +5 Volts monitor |  |
| _ROLL_ROT | 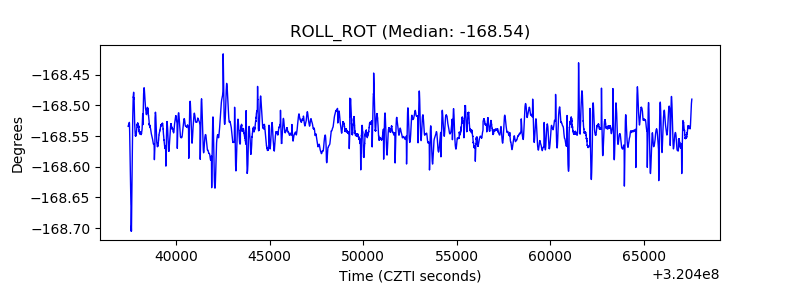 |
| _Roll_DEC |  |
| _Roll_RA | 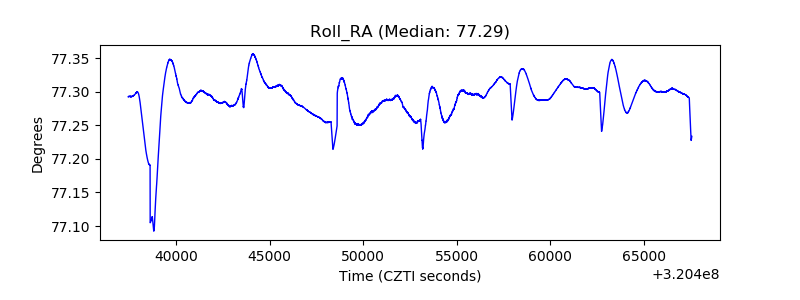 |
| Veto Counter | 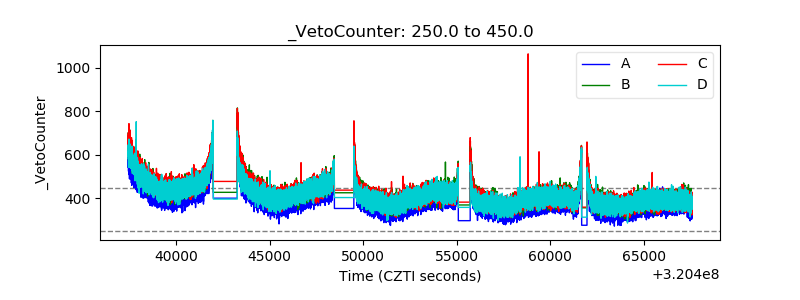 |