| Param | Original file | Final file |
|---|---|---|
| Filename | modeM0/AS1A07_001T01_9000003538_23869cztM0_level2.evt | modeM0/AS1A07_001T01_9000003538_23869cztM0_level2_quad_clean.evt |
| Size (bytes) | 69,552,000 | 20,534,400 |
| Size | 66.3 MB | 19.6 MB |
| Events in quadrant A | 547,477 | 136,385 |
| Events in quadrant B | 464,316 | 144,104 |
| Events in quadrant C | 449,310 | 138,888 |
| Events in quadrant D | 582,908 | 133,913 |
| Mode M0 | |||
|---|---|---|---|
| Quadrant | BADHDUFLAG | Total packets | Discarded packets |
| A | 0 | 2097 | 0 |
| B | 0 | 1835 | 0 |
| C | 0 | 1788 | 0 |
| D | 0 | 2244 | 4 |
| Mode SS | |||
|---|---|---|---|
| Quadrant | BADHDUFLAG | Total packets | Discarded packets |
| A | 0 | 18 | 0 |
| B | 0 | 18 | 0 |
| C | 0 | 18 | 0 |
| D | 0 | 18 | 0 |
| Quadrant | Total seconds | Saturated seconds | Saturation percentage |
|---|---|---|---|
| A | 866 | 30 | 3.464203% |
| B | 866 | 0 | 0.000000% |
| C | 866 | 1 | 0.115473% |
| D | 865 | 17 | 1.965318% |
Noise dominated data is calculated using 1-second bins in cleaned event files. If a bin has >2000 counts, and if more than 50% of those come from <1% of pixels, then it is considered to be noise-dominated and hence unusable.
| Quadrant | # 1 sec bins | Bins with >0 counts | Bins with >2000 counts | High rate bins dominated by noise | Noise dominated (total time) | Noise dominated (detector-on time) | Marked lightcurve |
|---|---|---|---|---|---|---|---|
| A | 866 | 866 | 24 | 24 | 2.77% | 2.77% | 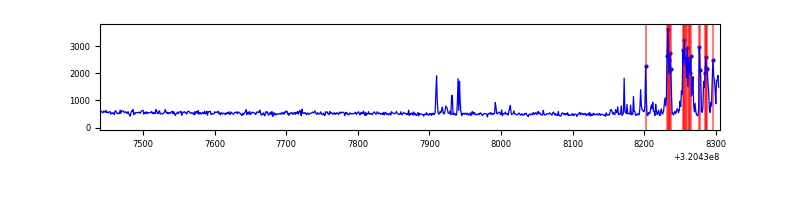 |
| B | 866 | 866 | 0 | 0 | 0.00% | 0.00% | 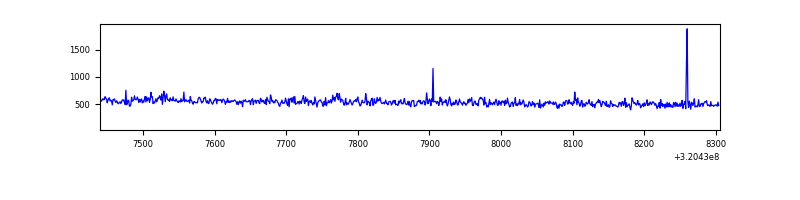 |
| C | 866 | 866 | 0 | 0 | 0.00% | 0.00% | 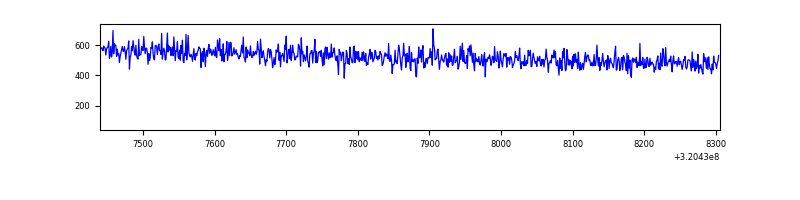 |
| D | 865 | 865 | 21 | 21 | 2.43% | 2.43% | 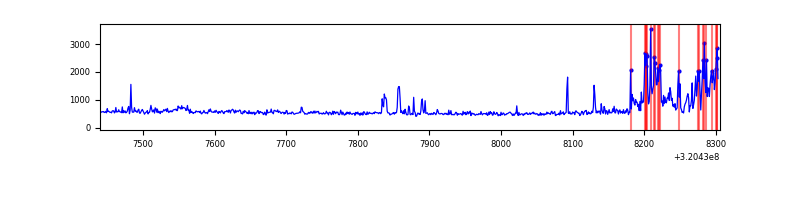 |
Top three noisy pixels from each quadrant. If the there are fewer than three noisy pixels in the level2.evt file, extra rows are filled as -1
| Pixel properties | Quadrant properties | ||||||
|---|---|---|---|---|---|---|---|
| Quadrant | DetID | PixID | Counts | Sigma | Mean | Median | Sigma |
| A | 4 | 2 | 105202 | 4194.55 | 114 | 112 | 25.1 |
| A | 13 | 254 | 1496 | 55.24 | 114 | 112 | 25.1 |
| A | 2 | 250 | 1388 | 50.93 | 114 | 112 | 25.1 |
| B | 0 | 245 | 5748 | 236.51 | 116 | 114 | 23.8 |
| B | 15 | 32 | 2366 | 94.54 | 116 | 114 | 23.8 |
| B | 12 | 111 | 2269 | 90.46 | 116 | 114 | 23.8 |
| C | 14 | 238 | 18265 | 671.64 | 110 | 111 | 27.0 |
| C | 13 | 61 | 752 | 23.72 | 110 | 111 | 27.0 |
| C | 2 | 16 | 367 | 9.47 | 110 | 111 | 27.0 |
| D | 1 | 52 | 67979 | 2383.37 | 110 | 107 | 28.5 |
| D | 7 | 238 | 52977 | 1856.56 | 110 | 107 | 28.5 |
| D | 8 | 195 | 41300 | 1446.52 | 110 | 107 | 28.5 |
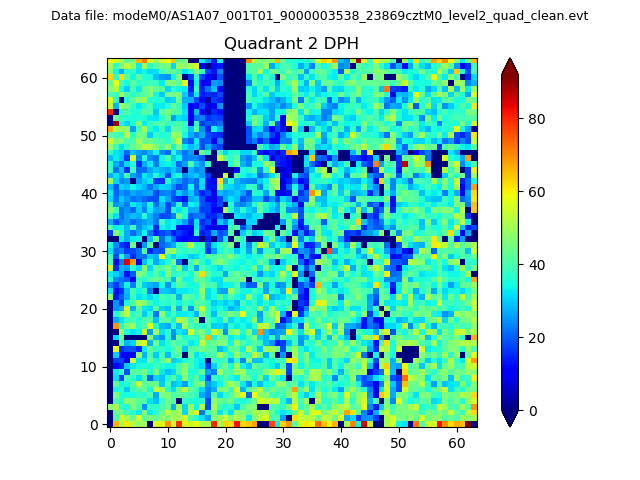
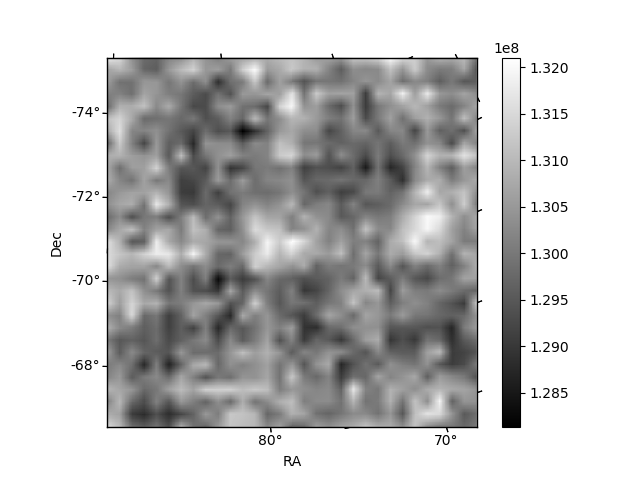
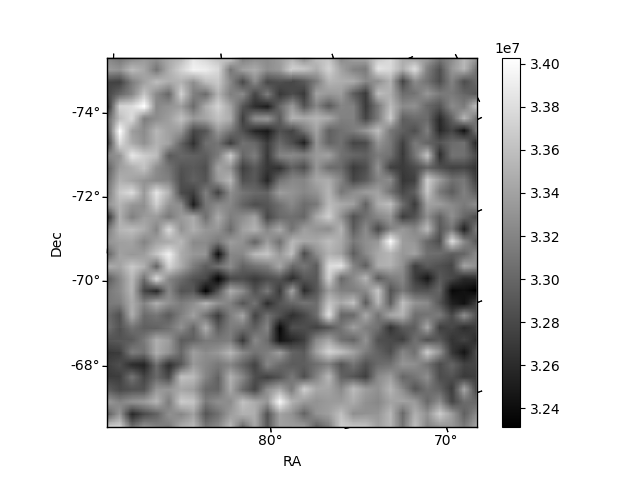
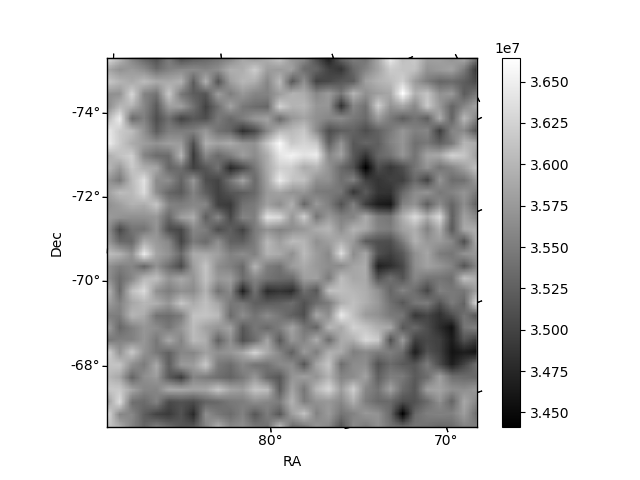
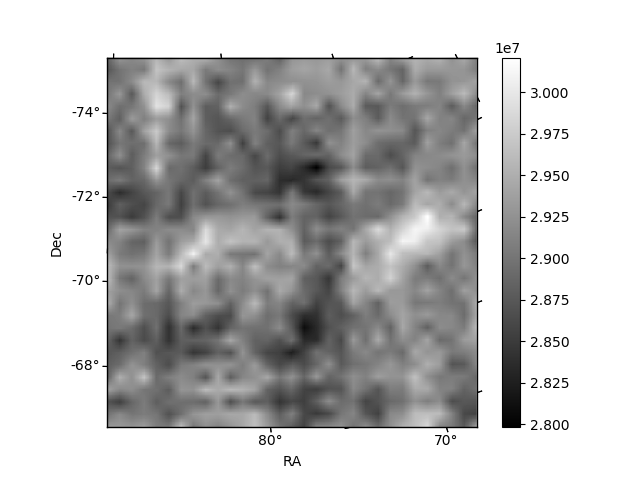
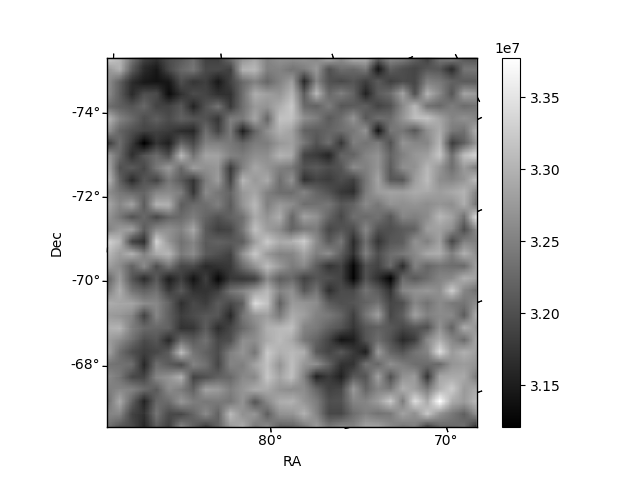
Histogram calculated using DETX and DETY for each event in the final _common_clean file
| Quadrant A | 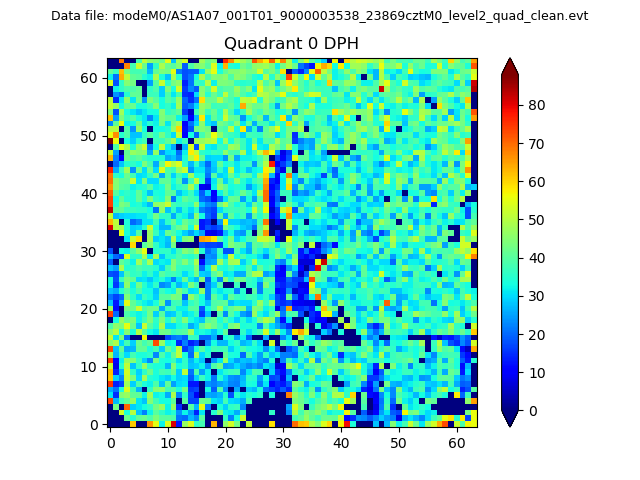 |
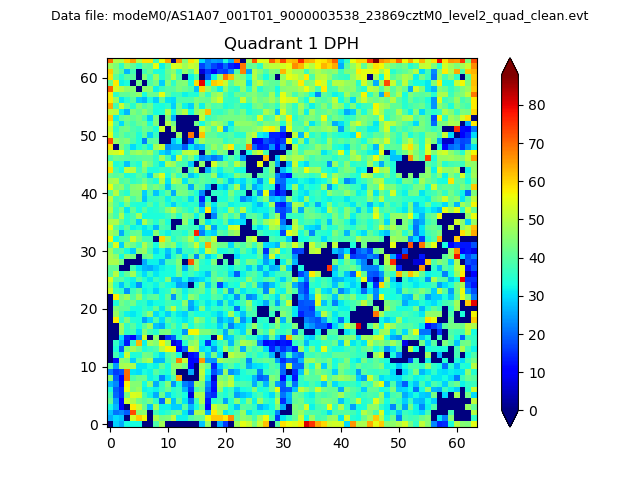 |
Quadrant B |
|---|---|---|---|
| Quadrant D | 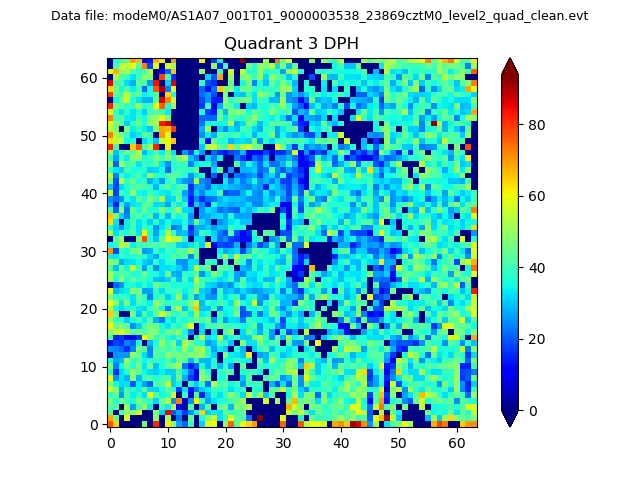 |
 |
Quadrant C |
| Plot type | Count rate plots | Images |
|---|---|---|
| Comparison with Poisson distribution Blue bars denote a histogram of data divided into 1 sec bins. Red curve is a Poisson curve with rate = median count rate of data. |
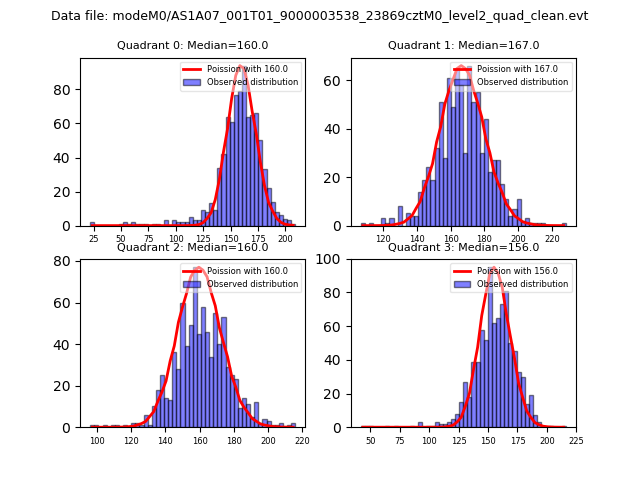 |
 |
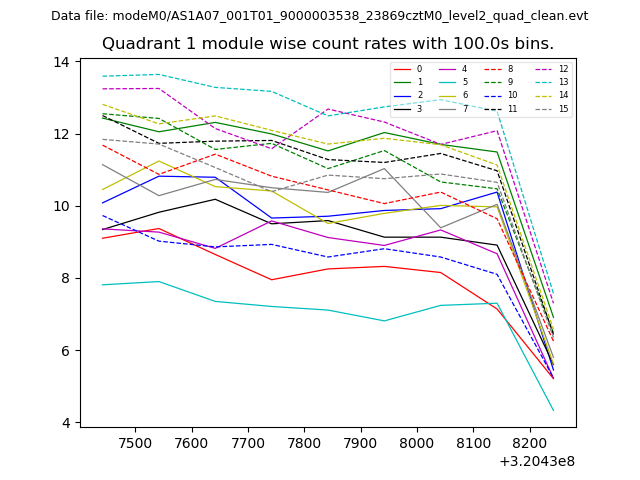
| Quadrant-wise count rates Data is divided into 100 sec bins |
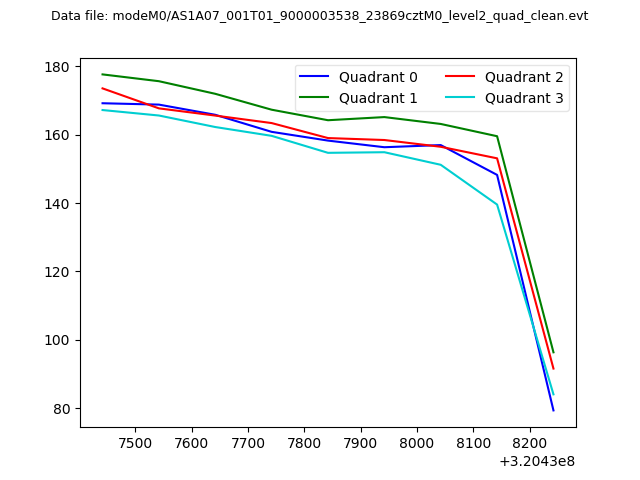 |
|
| Module-wise count rates for Quadrant A Data is divided into 100 sec bins |
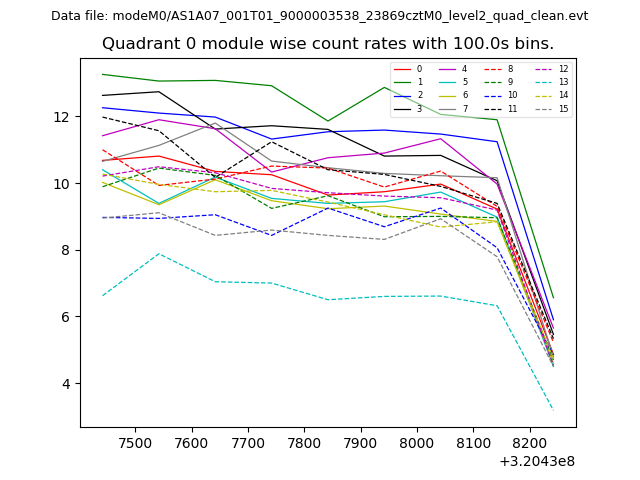 |
 |
| Module-wise count rates for Quadrant B Data is divided into 100 sec bins |
 |
 |
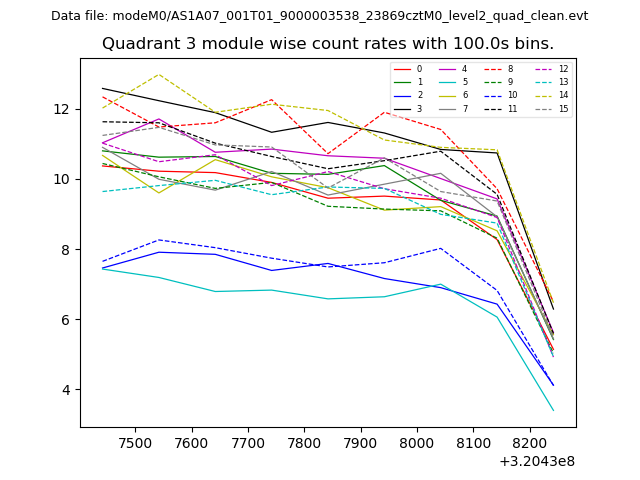
| Module-wise count rates for Quadrant C Data is divided into 100 sec bins |
 |
 |
| Module-wise count rates for Quadrant D Data is divided into 100 sec bins |
 |
 |
| Parameter | Plot |
|---|---|
| CZT HV Monitor | 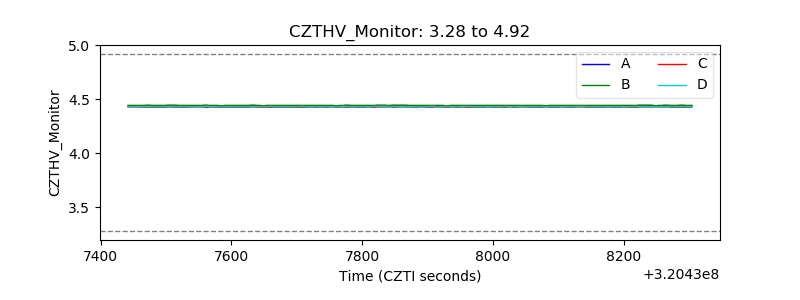 |
| D_VDD | 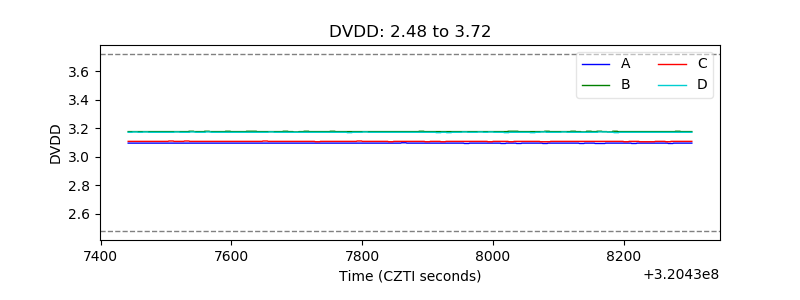 |
| Temperature 1 | 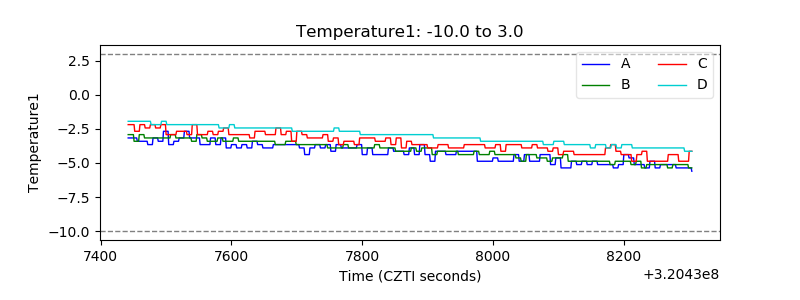 |
| Veto HV Monitor | 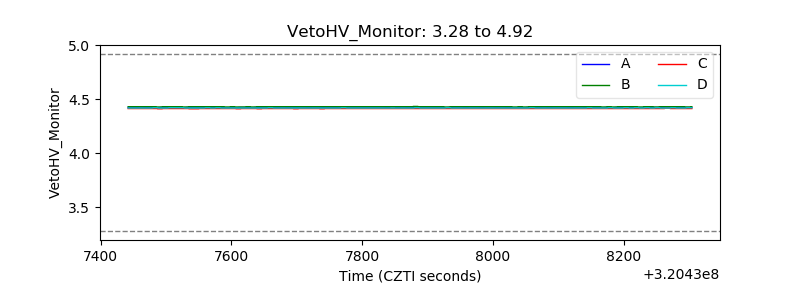 |
| Veto LLD | 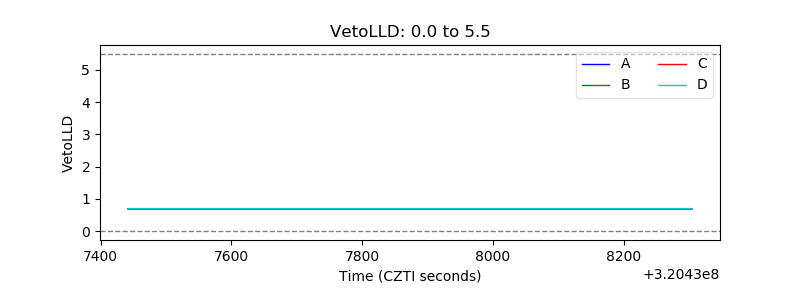 |
| Alpha Counter | 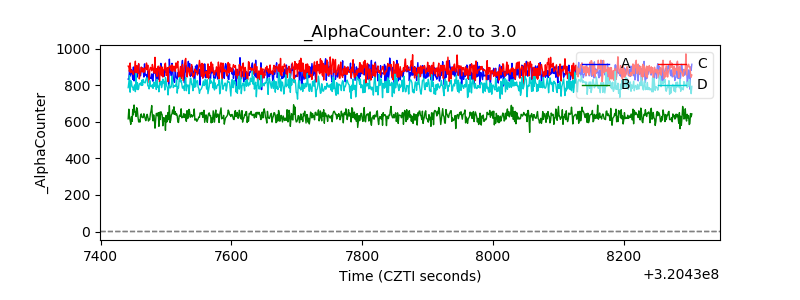 |
| _CPM_Rate | 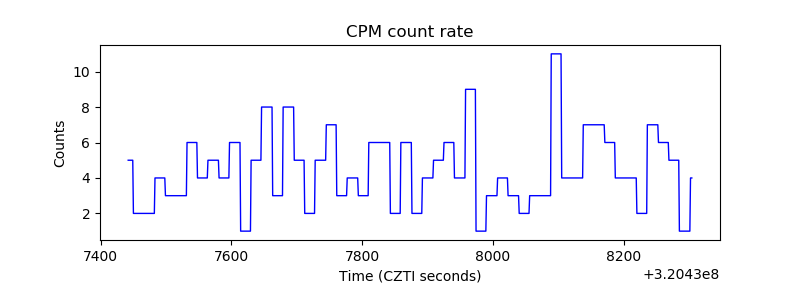 |
| CZT Counter | 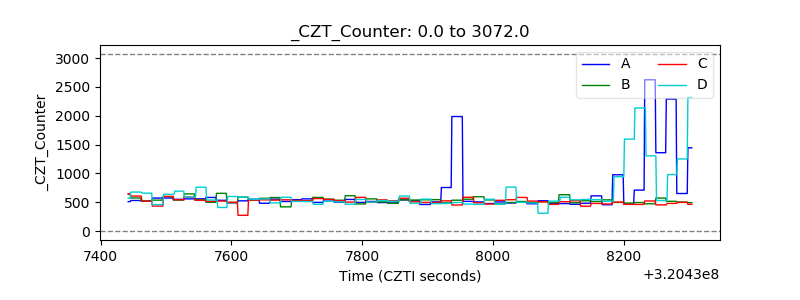 |
| +2.5 Volts monitor | 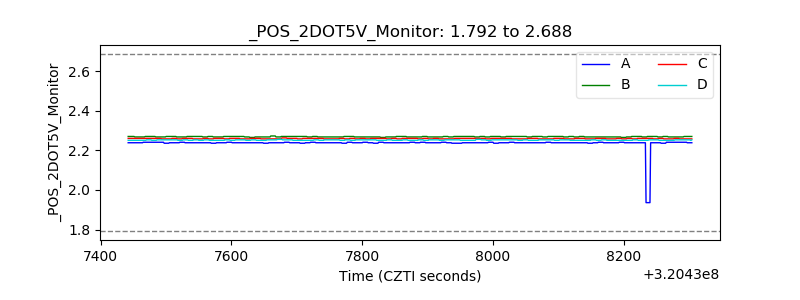 |
| +5 Volts monitor |  |
| _ROLL_ROT | 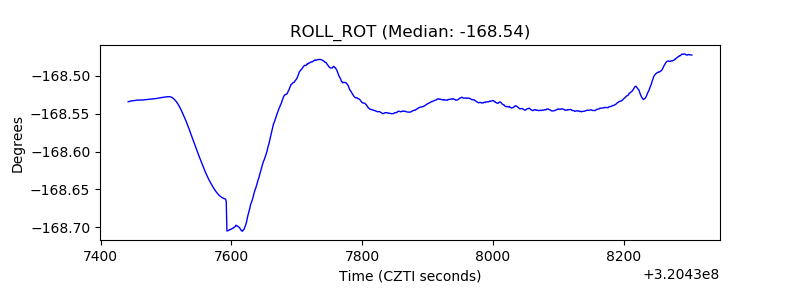 |
| _Roll_DEC | 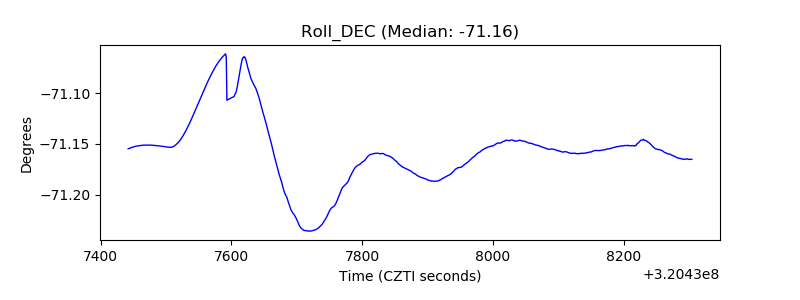 |
| _Roll_RA | 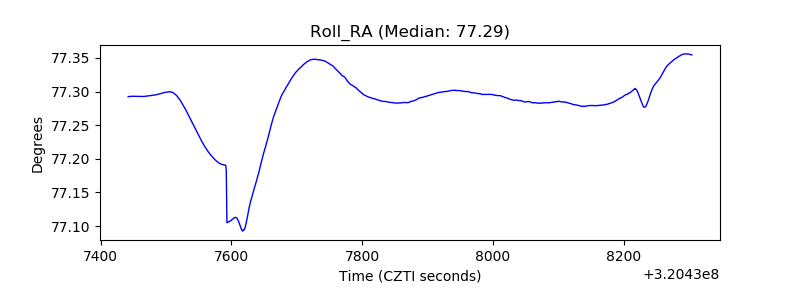 |
| Veto Counter | 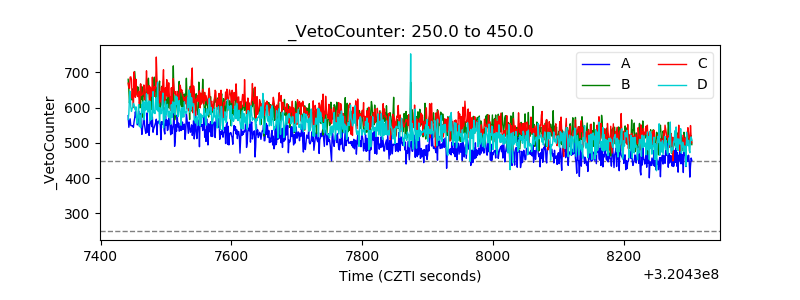 |