| Param | Original file | Final file |
|---|---|---|
| Filename | modeM0/AS1A07_001T01_9000003538_23870cztM0_level2.evt | modeM0/AS1A07_001T01_9000003538_23870cztM0_level2_quad_clean.evt |
| Size (bytes) | 434,626,560 | 127,097,280 |
| Size | 414.5 MB | 121.2 MB |
| Events in quadrant A | 3,140,890 | 865,254 |
| Events in quadrant B | 2,979,346 | 898,336 |
| Events in quadrant C | 2,984,030 | 849,327 |
| Events in quadrant D | 3,654,870 | 821,848 |
| Mode M9 | |||
|---|---|---|---|
| Quadrant | BADHDUFLAG | Total packets | Discarded packets |
| A | 0 | 12 | 0 |
| B | 0 | 12 | 0 |
| C | 0 | 12 | 0 |
| D | 0 | 12 | 0 |
| Mode M0 | |||
|---|---|---|---|
| Quadrant | BADHDUFLAG | Total packets | Discarded packets |
| A | 0 | 13075 | 1 |
| B | 0 | 12457 | 2 |
| C | 0 | 12497 | 1 |
| D | 0 | 14695 | 1 |
| Mode SS | |||
|---|---|---|---|
| Quadrant | BADHDUFLAG | Total packets | Discarded packets |
| A | 0 | 122 | 0 |
| B | 0 | 122 | 0 |
| C | 0 | 122 | 0 |
| D | 0 | 122 | 0 |
| Quadrant | Total seconds | Saturated seconds | Saturation percentage |
|---|---|---|---|
| A | 5936 | 99 | 1.667790% |
| B | 5935 | 47 | 0.791912% |
| C | 5935 | 91 | 1.533277% |
| D | 5935 | 104 | 1.752317% |
Noise dominated data is calculated using 1-second bins in cleaned event files. If a bin has >2000 counts, and if more than 50% of those come from <1% of pixels, then it is considered to be noise-dominated and hence unusable.
| Quadrant | # 1 sec bins | Bins with >0 counts | Bins with >2000 counts | High rate bins dominated by noise | Noise dominated (total time) | Noise dominated (detector-on time) | Marked lightcurve |
|---|---|---|---|---|---|---|---|
| A | 7221 | 5937 | 60 | 60 | 0.83% | 1.01% | 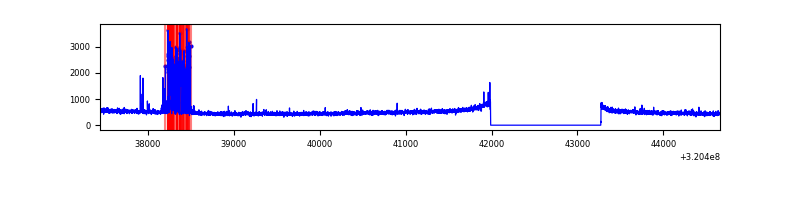 |
| B | 7220 | 5936 | 1 | 1 | 0.01% | 0.02% | 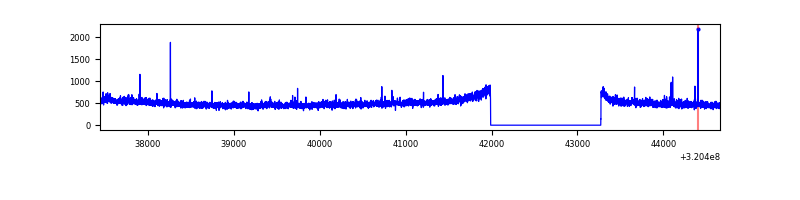 |
| C | 7220 | 5936 | 9 | 9 | 0.12% | 0.15% | 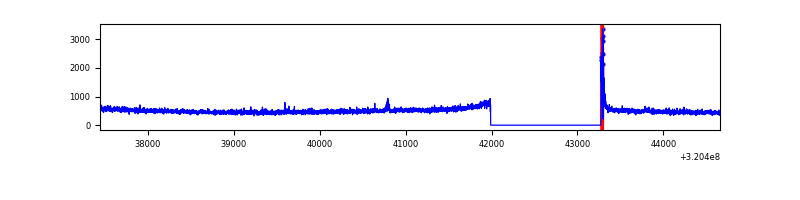 |
| D | 7220 | 5936 | 98 | 98 | 1.36% | 1.65% | 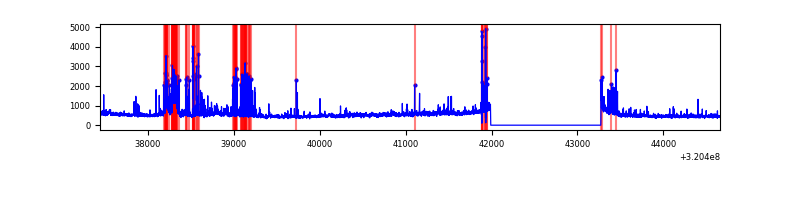 |
Top three noisy pixels from each quadrant. If the there are fewer than three noisy pixels in the level2.evt file, extra rows are filled as -1
| Pixel properties | Quadrant properties | ||||||
|---|---|---|---|---|---|---|---|
| Quadrant | DetID | PixID | Counts | Sigma | Mean | Median | Sigma |
| A | 4 | 2 | 251432 | 1685.99 | 748 | 734 | 148.7 |
| A | 13 | 254 | 10022 | 62.46 | 748 | 734 | 148.7 |
| A | 2 | 250 | 6861 | 41.21 | 748 | 734 | 148.7 |
| B | 12 | 111 | 15990 | 108.83 | 755 | 738 | 140.1 |
| B | 11 | 111 | 14128 | 95.55 | 755 | 738 | 140.1 |
| B | 14 | 111 | 12481 | 83.79 | 755 | 738 | 140.1 |
| C | 14 | 238 | 117385 | 705.77 | 720 | 726 | 165.3 |
| C | 0 | 10 | 47812 | 284.86 | 720 | 726 | 165.3 |
| C | 7 | 247 | 14009 | 80.36 | 720 | 726 | 165.3 |
| D | 1 | 52 | 457301 | 2641.44 | 722 | 702 | 172.9 |
| D | 8 | 195 | 338259 | 1952.78 | 722 | 702 | 172.9 |
| D | 7 | 238 | 105269 | 604.92 | 722 | 702 | 172.9 |
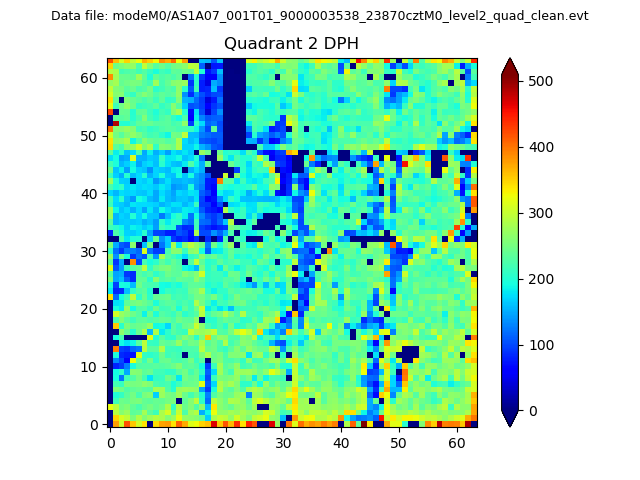
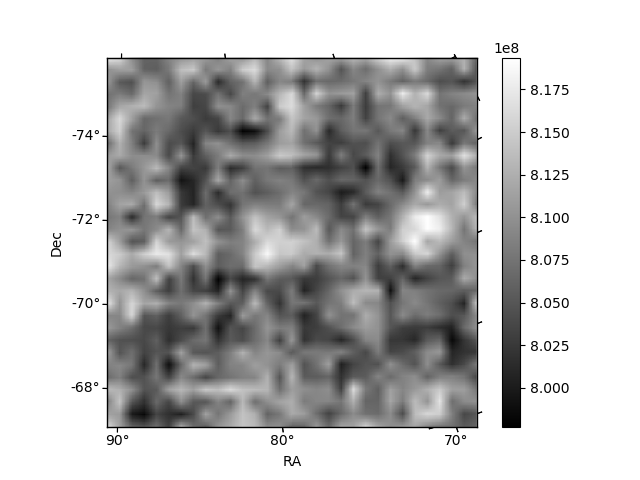
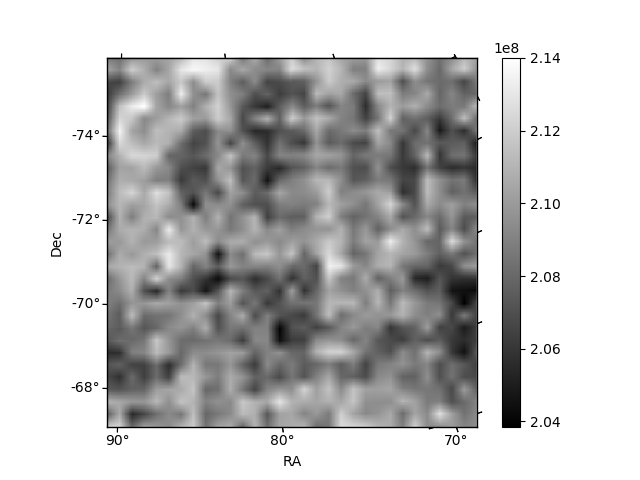
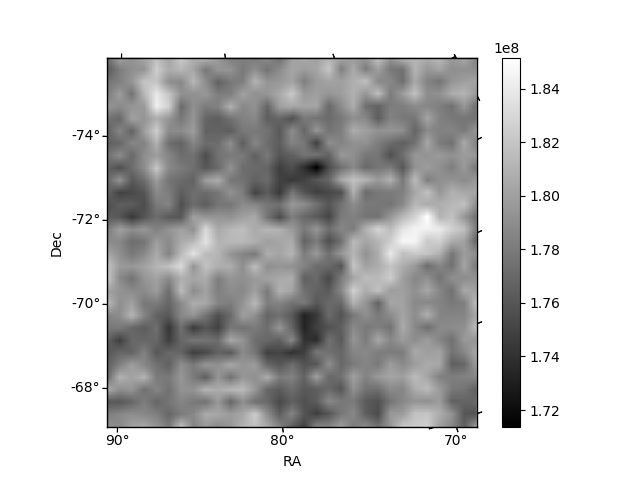
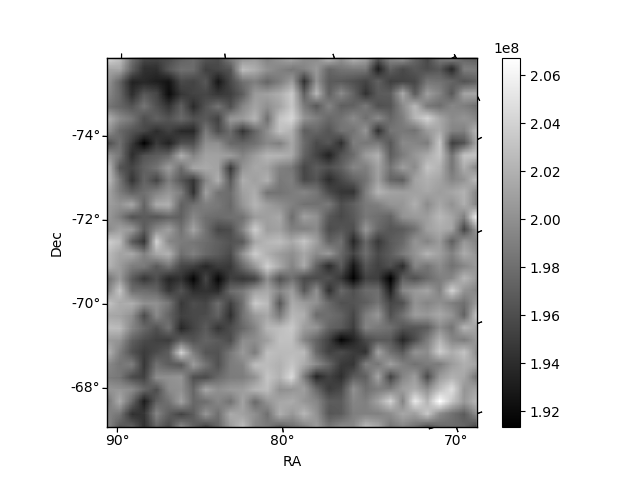
Histogram calculated using DETX and DETY for each event in the final _common_clean file
| Quadrant A | 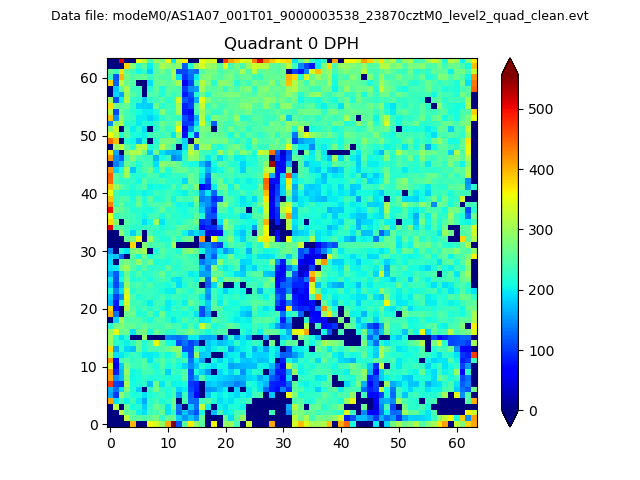 |
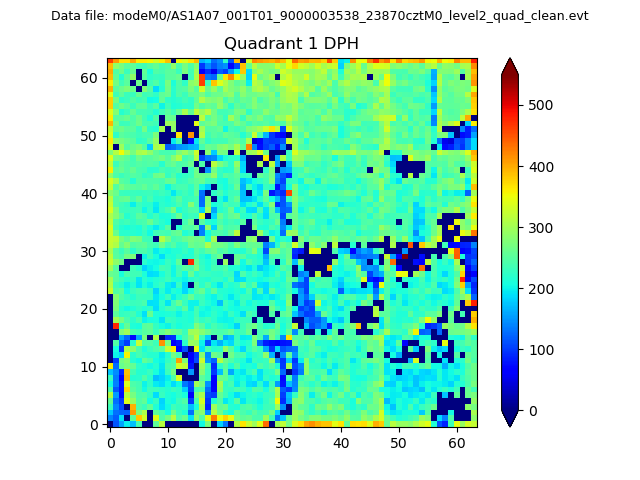 |
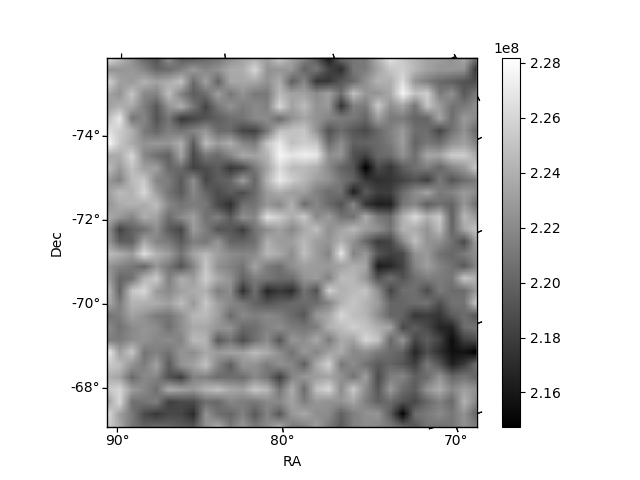
Quadrant B |
|---|---|---|---|
| Quadrant D | 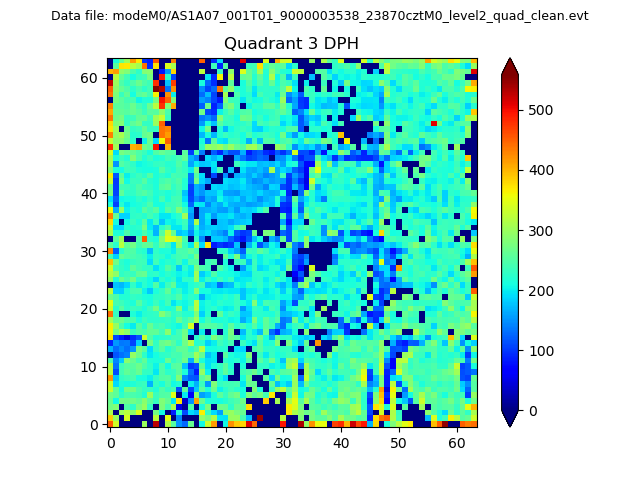 |
 |
Quadrant C |
| Plot type | Count rate plots | Images |
|---|---|---|
| Comparison with Poisson distribution Blue bars denote a histogram of data divided into 1 sec bins. Red curve is a Poisson curve with rate = median count rate of data. |
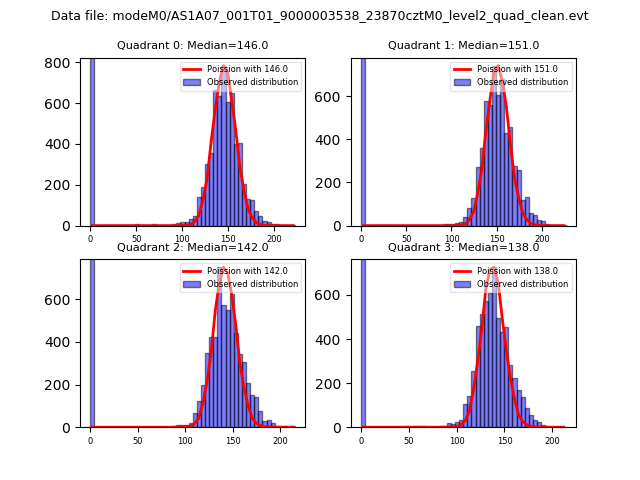 |
 |
| Quadrant-wise count rates Data is divided into 100 sec bins |
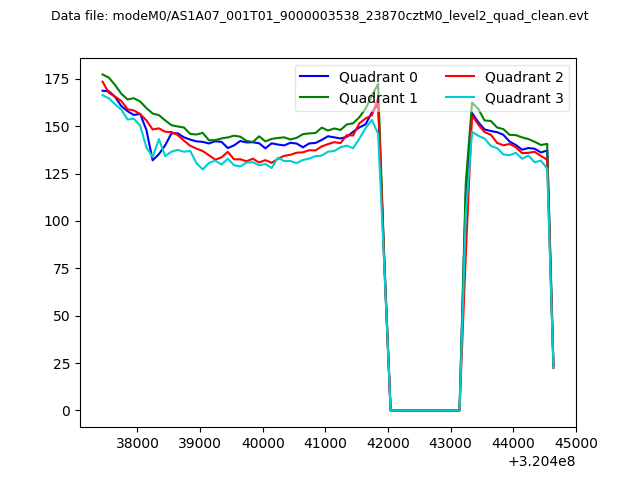 |
|
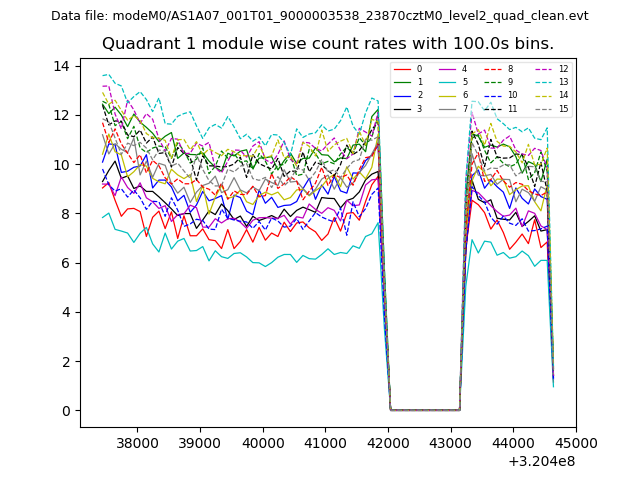
| Module-wise count rates for Quadrant A Data is divided into 100 sec bins |
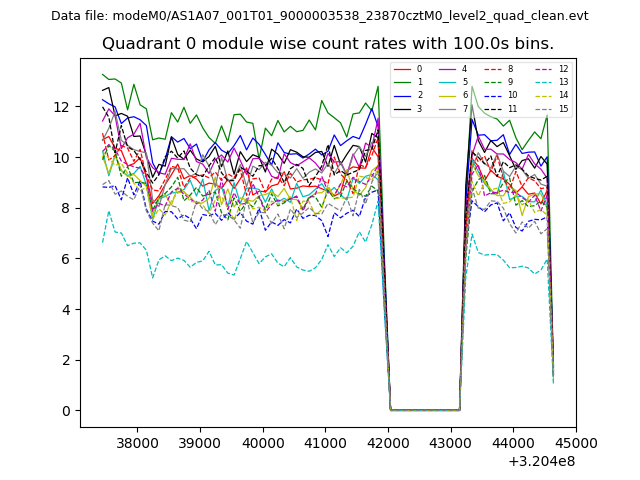 |
 |
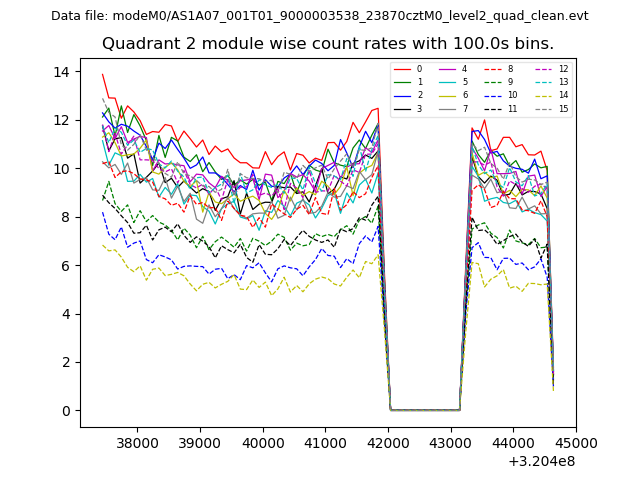
| Module-wise count rates for Quadrant B Data is divided into 100 sec bins |
 |
 |
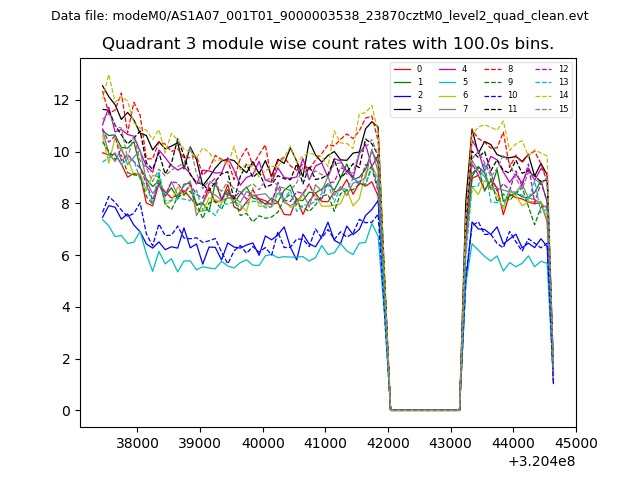
| Module-wise count rates for Quadrant C Data is divided into 100 sec bins |
 |
 |
| Module-wise count rates for Quadrant D Data is divided into 100 sec bins |
 |
 |
| Parameter | Plot |
|---|---|
| CZT HV Monitor | 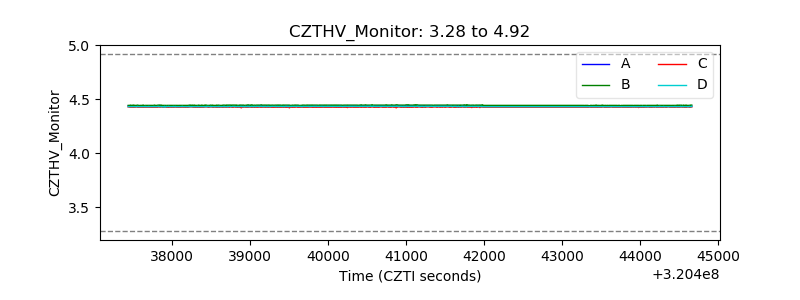 |
| D_VDD | 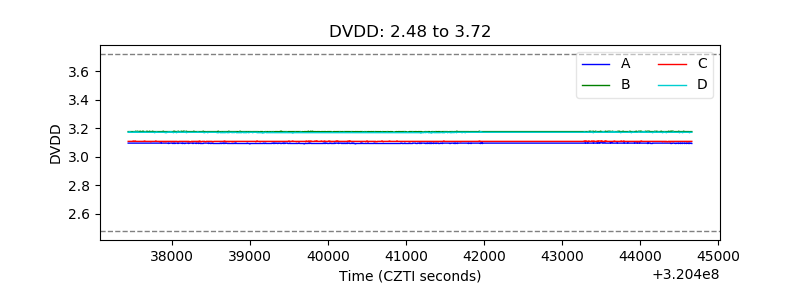 |
| Temperature 1 | 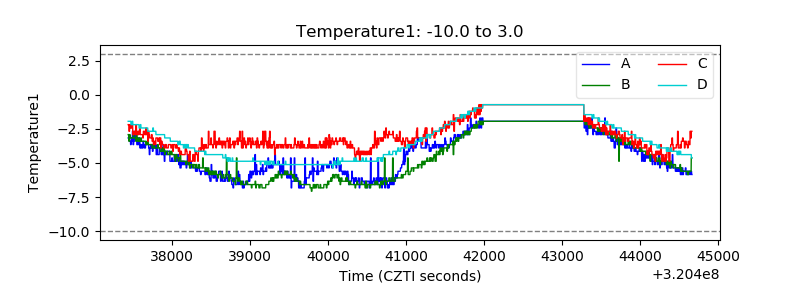 |
| Veto HV Monitor | 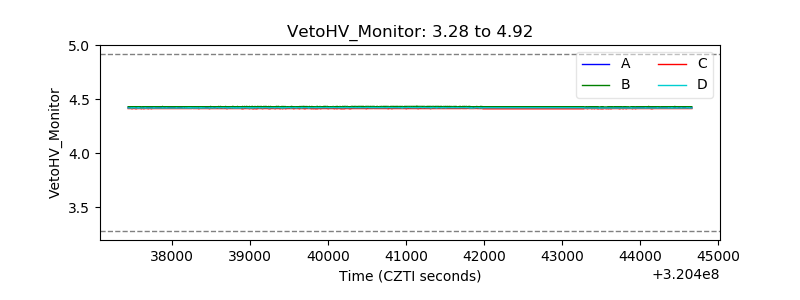 |
| Veto LLD | 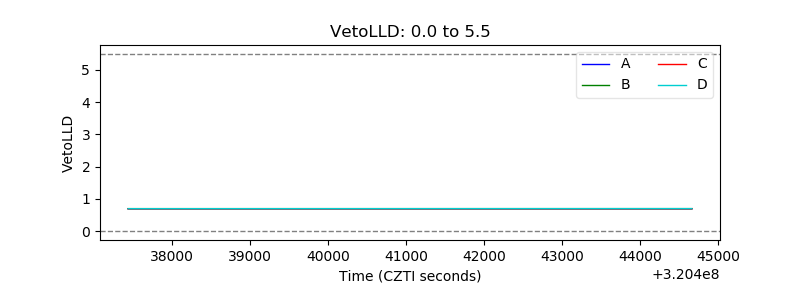 |
| Alpha Counter | 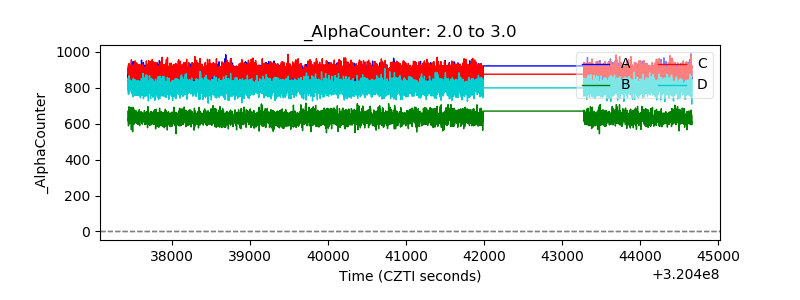 |
| _CPM_Rate | 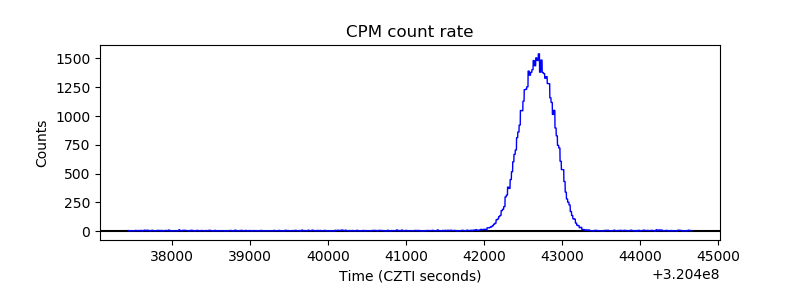 |
| CZT Counter | 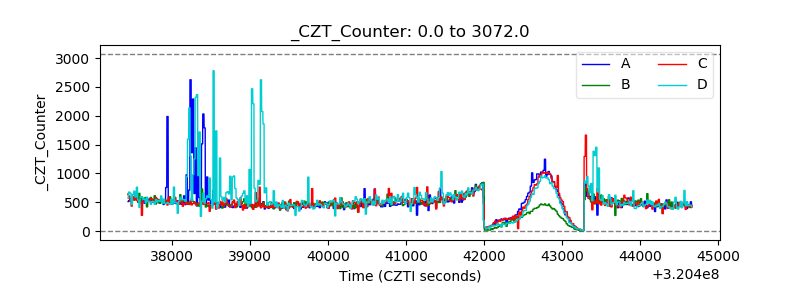 |
| +2.5 Volts monitor | 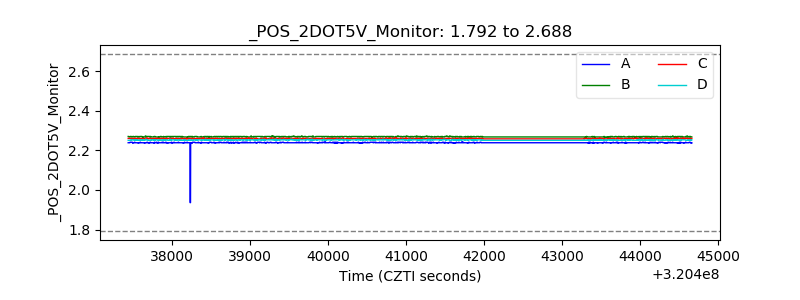 |
| +5 Volts monitor |  |
| _ROLL_ROT | 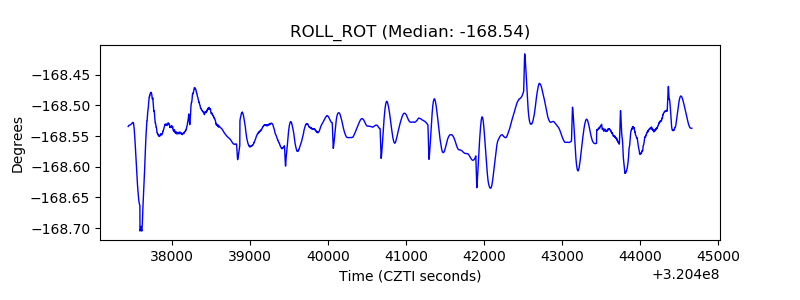 |
| _Roll_DEC | 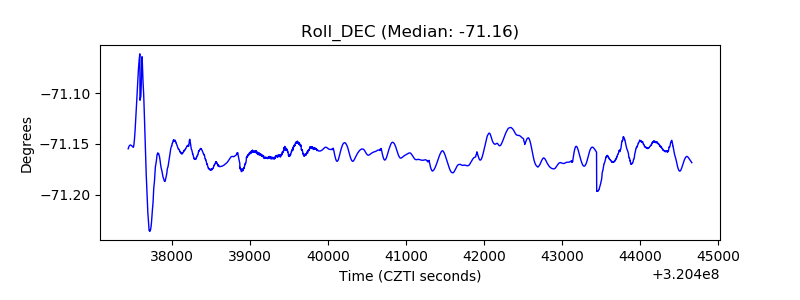 |
| _Roll_RA | 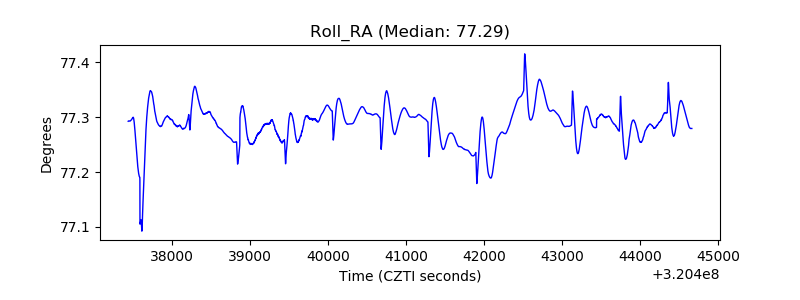 |
| Veto Counter | 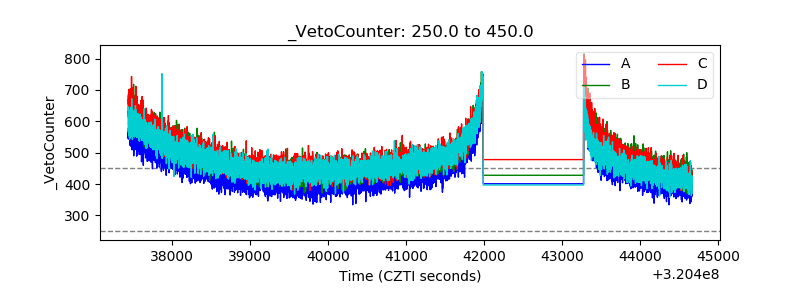 |