| Param | Original file | Final file |
|---|---|---|
| Filename | modeM0/AS1A07_001T01_9000003538_23871cztM0_level2.evt | modeM0/AS1A07_001T01_9000003538_23871cztM0_level2_quad_clean.evt |
| Size (bytes) | 457,332,480 | 133,009,920 |
| Size | 436.1 MB | 126.8 MB |
| Events in quadrant A | 3,100,884 | 906,781 |
| Events in quadrant B | 3,242,828 | 928,134 |
| Events in quadrant C | 3,359,910 | 875,409 |
| Events in quadrant D | 3,696,788 | 856,784 |
| Mode M9 | |||
|---|---|---|---|
| Quadrant | BADHDUFLAG | Total packets | Discarded packets |
| A | 0 | 14 | 0 |
| B | 0 | 15 | 0 |
| C | 0 | 15 | 0 |
| D | 0 | 15 | 0 |
| Mode M0 | |||
|---|---|---|---|
| Quadrant | BADHDUFLAG | Total packets | Discarded packets |
| A | 0 | 13559 | 2 |
| B | 0 | 13812 | 2 |
| C | 0 | 14185 | 2 |
| D | 0 | 15462 | 2 |
| Mode SS | |||
|---|---|---|---|
| Quadrant | BADHDUFLAG | Total packets | Discarded packets |
| A | 0 | 134 | 0 |
| B | 0 | 134 | 0 |
| C | 0 | 134 | 0 |
| D | 0 | 134 | 0 |
| Quadrant | Total seconds | Saturated seconds | Saturation percentage |
|---|---|---|---|
| A | 6623 | 12 | 0.181187% |
| B | 6623 | 29 | 0.437868% |
| C | 6623 | 109 | 1.645780% |
| D | 6623 | 41 | 0.619055% |
Noise dominated data is calculated using 1-second bins in cleaned event files. If a bin has >2000 counts, and if more than 50% of those come from <1% of pixels, then it is considered to be noise-dominated and hence unusable.
| Quadrant | # 1 sec bins | Bins with >0 counts | Bins with >2000 counts | High rate bins dominated by noise | Noise dominated (total time) | Noise dominated (detector-on time) | Marked lightcurve |
|---|---|---|---|---|---|---|---|
| A | 7668 | 6624 | 0 | 0 | 0.00% | 0.00% | 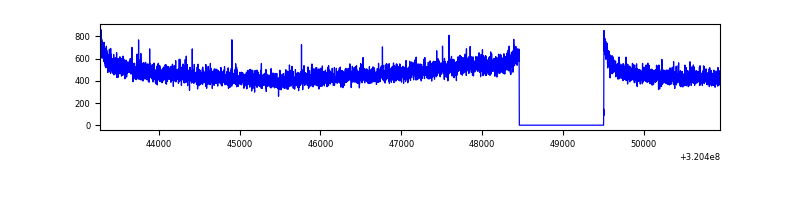 |
| B | 7668 | 6624 | 3 | 3 | 0.04% | 0.05% | 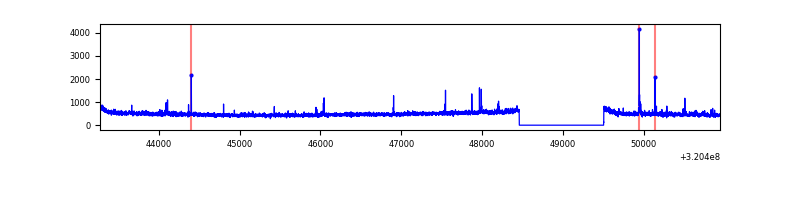 |
| C | 7668 | 6624 | 16 | 16 | 0.21% | 0.24% | 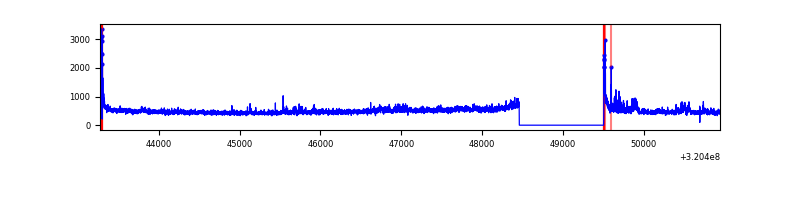 |
| D | 7668 | 6624 | 5 | 5 | 0.07% | 0.08% | 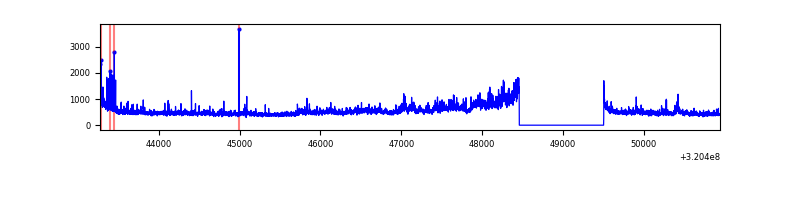 |
Top three noisy pixels from each quadrant. If the there are fewer than three noisy pixels in the level2.evt file, extra rows are filled as -1
| Pixel properties | Quadrant properties | ||||||
|---|---|---|---|---|---|---|---|
| Quadrant | DetID | PixID | Counts | Sigma | Mean | Median | Sigma |
| A | 13 | 254 | 11915 | 69.65 | 801 | 785 | 159.8 |
| A | 2 | 250 | 9587 | 55.09 | 801 | 785 | 159.8 |
| A | 0 | 226 | 7007 | 38.94 | 801 | 785 | 159.8 |
| B | 0 | 189 | 32389 | 211.0 | 806 | 786 | 149.8 |
| B | 12 | 111 | 17789 | 113.52 | 806 | 786 | 149.8 |
| B | 15 | 36 | 17476 | 111.43 | 806 | 786 | 149.8 |
| C | 7 | 247 | 173065 | 974.5 | 764 | 768 | 176.8 |
| C | 14 | 238 | 123763 | 695.65 | 764 | 768 | 176.8 |
| C | 0 | 10 | 85464 | 479.04 | 764 | 768 | 176.8 |
| D | 8 | 195 | 679585 | 3641.01 | 773 | 751 | 186.4 |
| D | 1 | 52 | 30323 | 158.61 | 773 | 751 | 186.4 |
| D | 2 | 234 | 29691 | 155.22 | 773 | 751 | 186.4 |
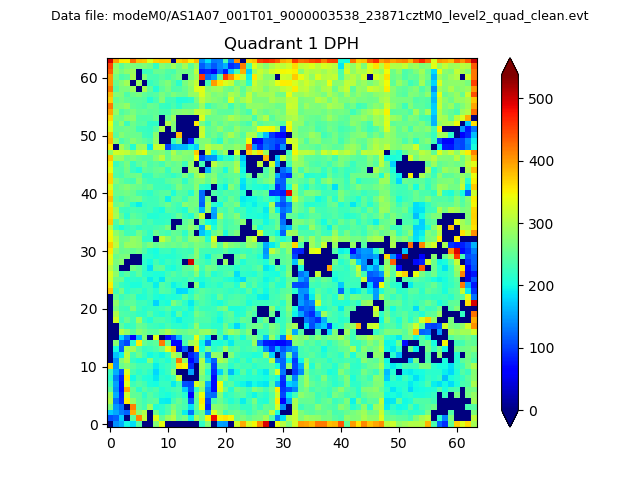
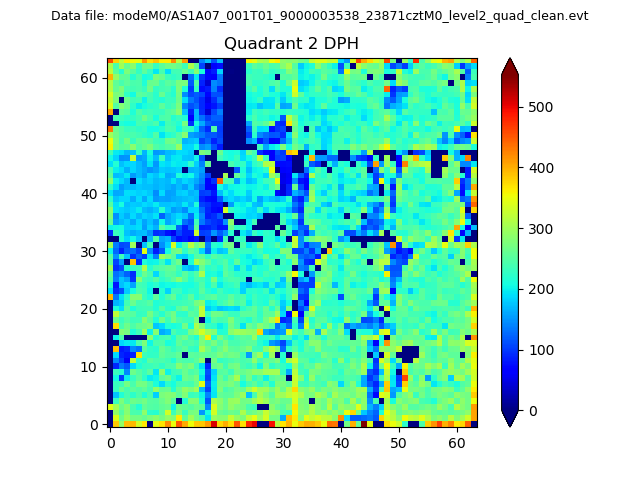
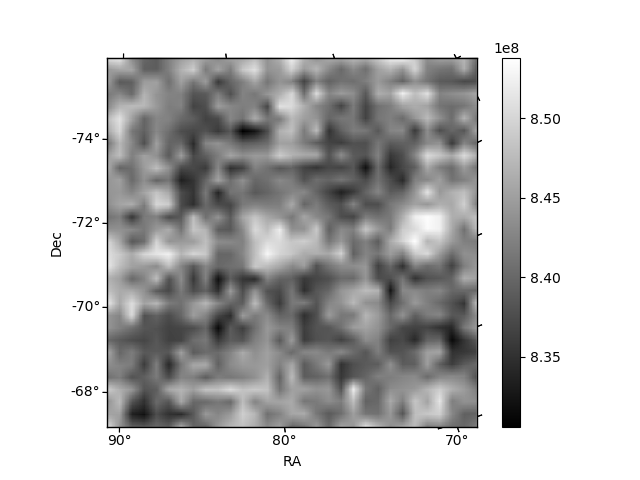
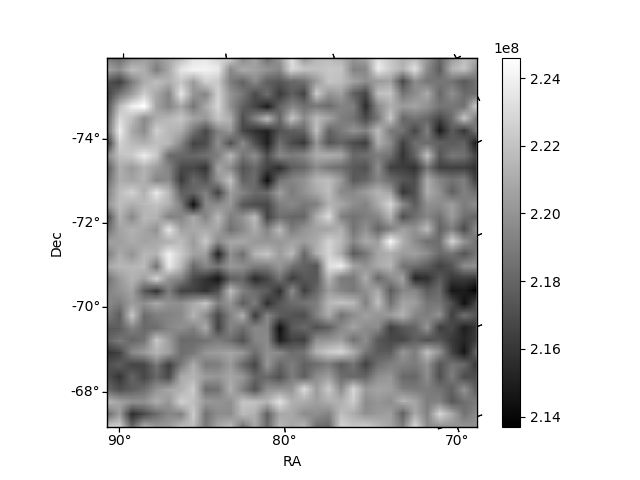
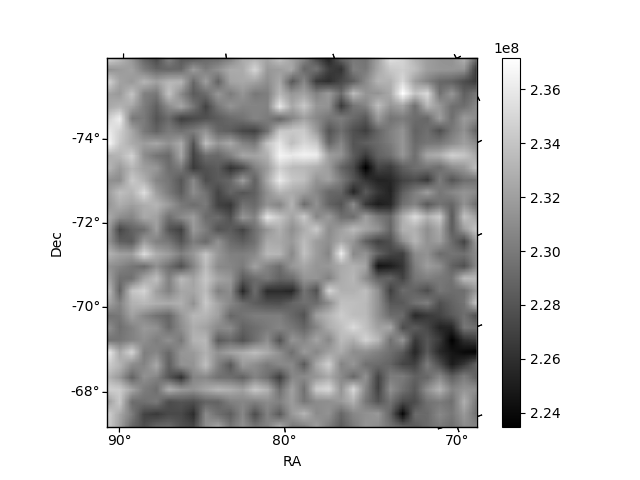
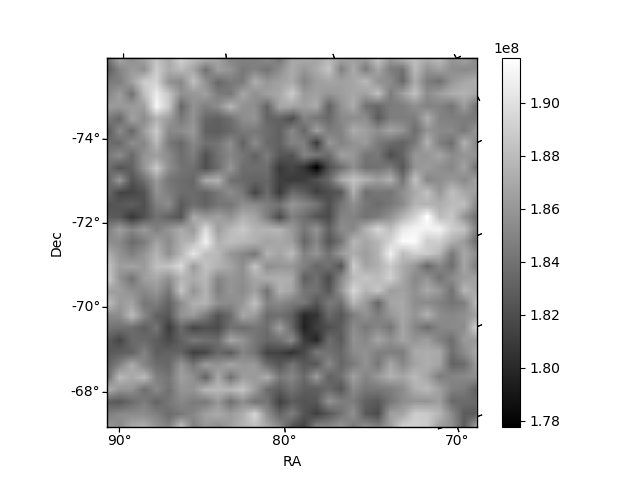
Histogram calculated using DETX and DETY for each event in the final _common_clean file
| Quadrant A |  |
 |
Quadrant B |
|---|---|---|---|
| Quadrant D | 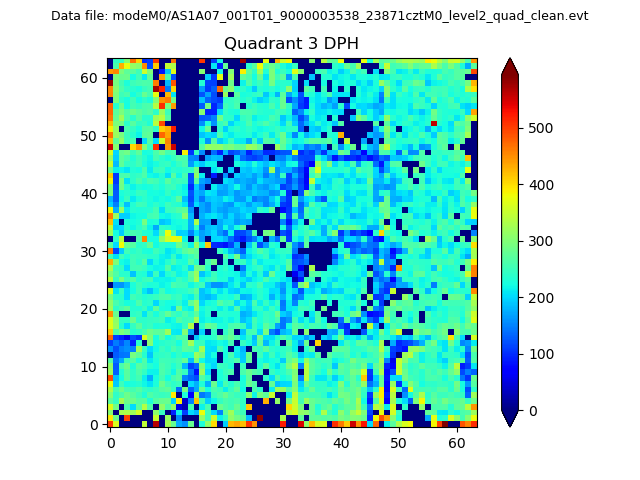 |
 |
Quadrant C |
| Plot type | Count rate plots | Images |
|---|---|---|
| Comparison with Poisson distribution Blue bars denote a histogram of data divided into 1 sec bins. Red curve is a Poisson curve with rate = median count rate of data. |
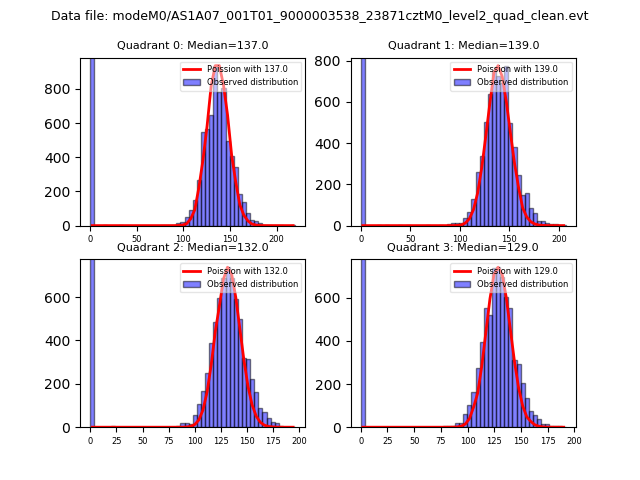 |
 |
| Quadrant-wise count rates Data is divided into 100 sec bins |
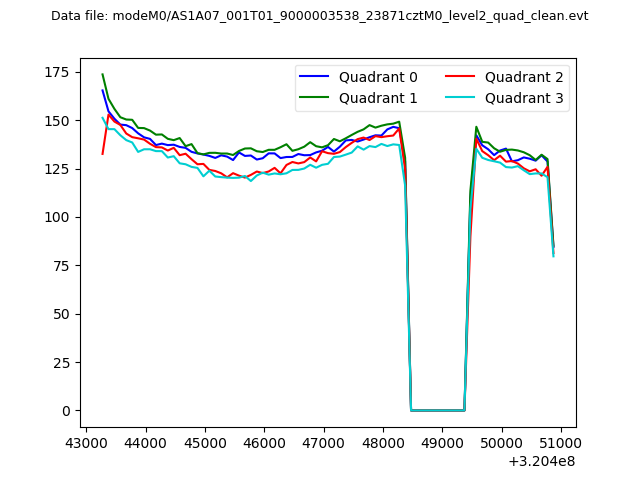 |
|
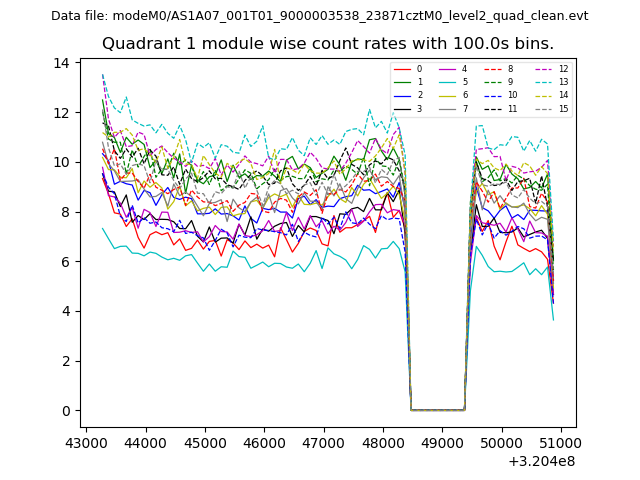
| Module-wise count rates for Quadrant A Data is divided into 100 sec bins |
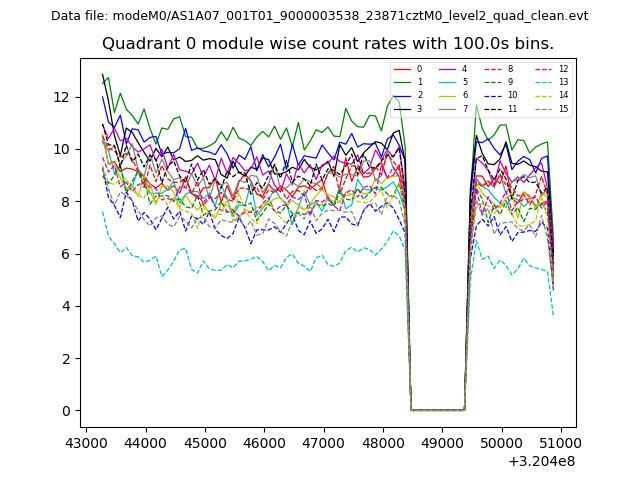 |
 |
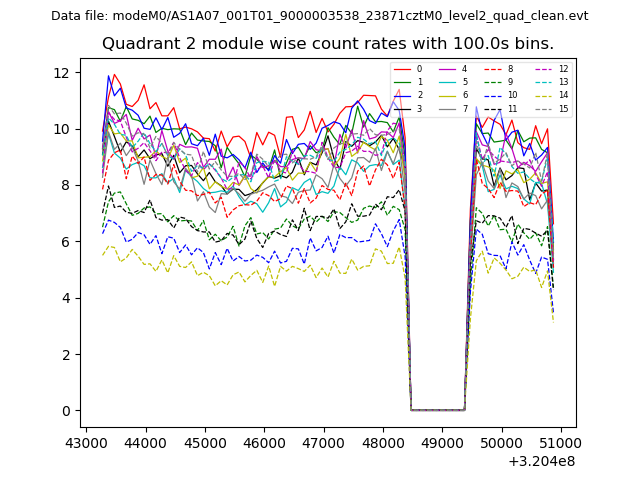
| Module-wise count rates for Quadrant B Data is divided into 100 sec bins |
 |
 |
| Module-wise count rates for Quadrant C Data is divided into 100 sec bins |
 |
 |
| Module-wise count rates for Quadrant D Data is divided into 100 sec bins |
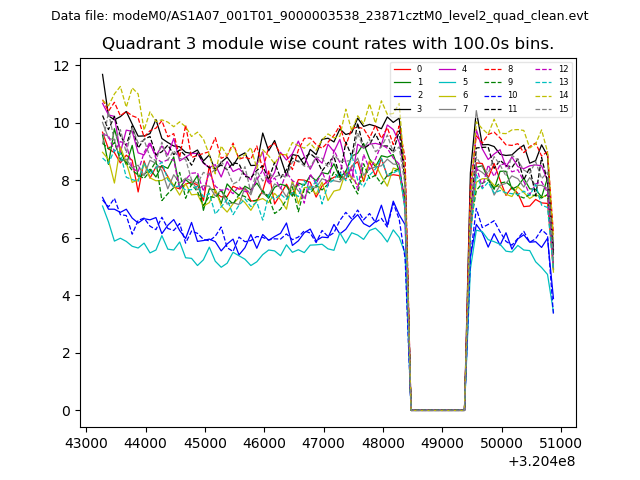 |
 |
| Parameter | Plot |
|---|---|
| CZT HV Monitor | 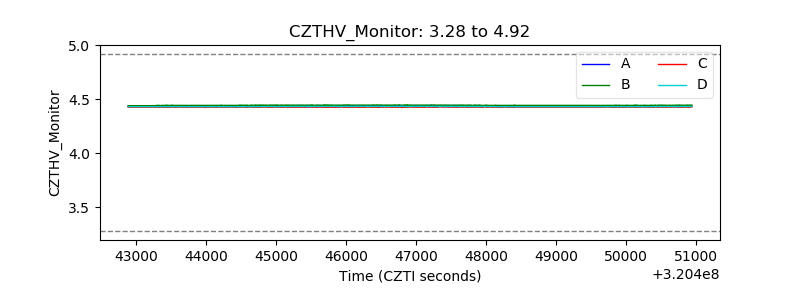 |
| D_VDD | 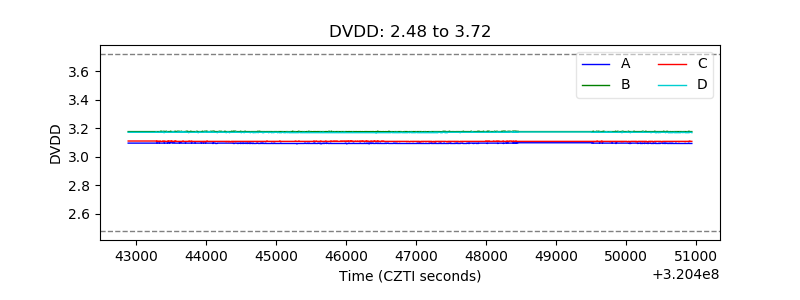 |
| Temperature 1 | 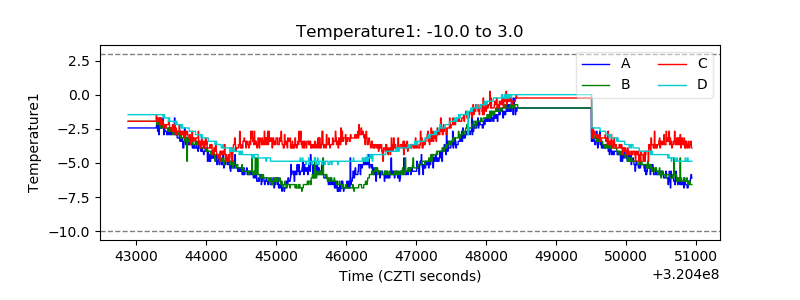 |
| Veto HV Monitor | 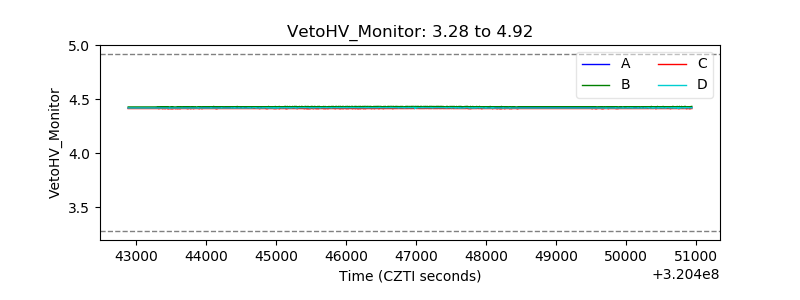 |
| Veto LLD | 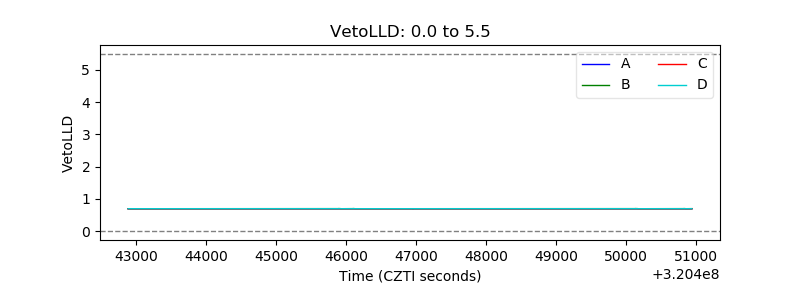 |
| Alpha Counter | 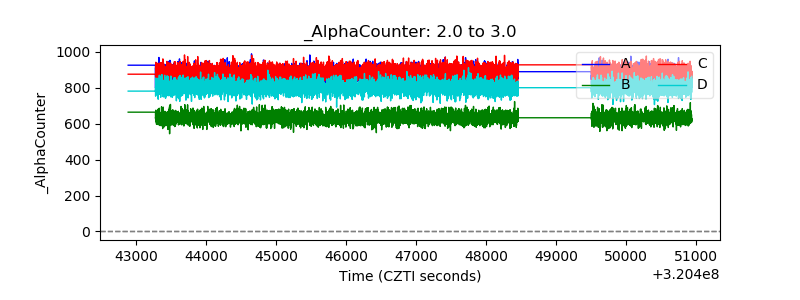 |
| _CPM_Rate | 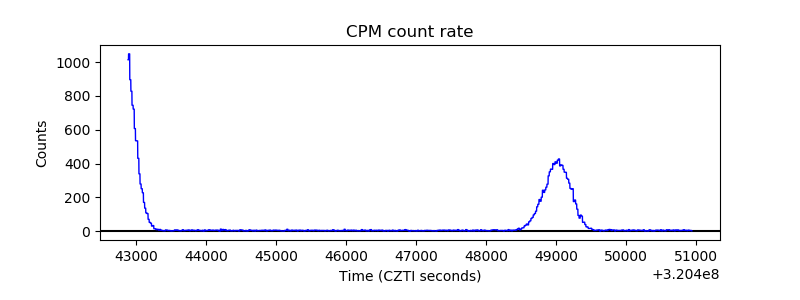 |
| CZT Counter | 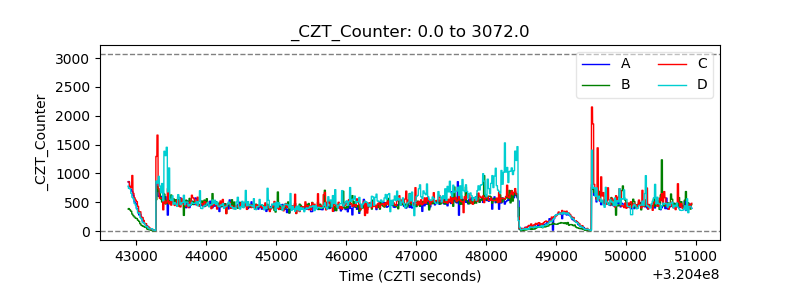 |
| +2.5 Volts monitor |  |
| +5 Volts monitor |  |
| _ROLL_ROT | 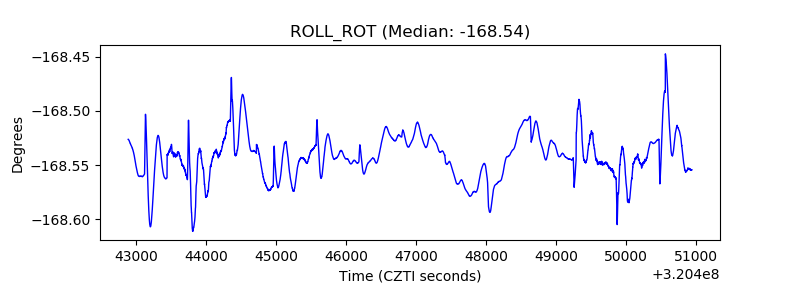 |
| _Roll_DEC | 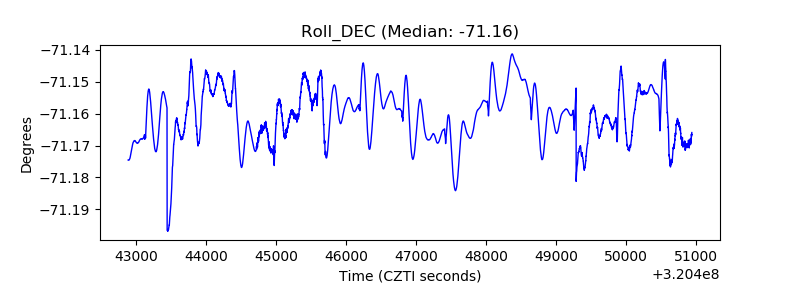 |
| _Roll_RA | 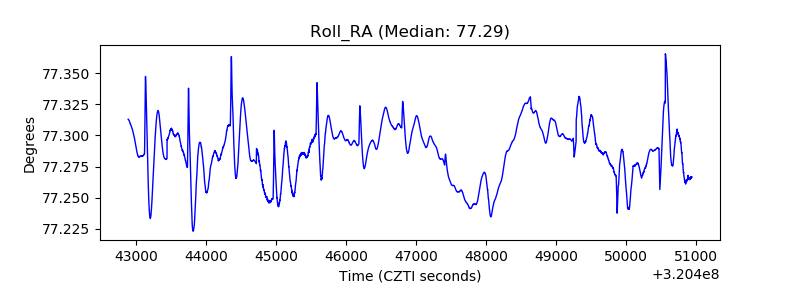 |
| Veto Counter | 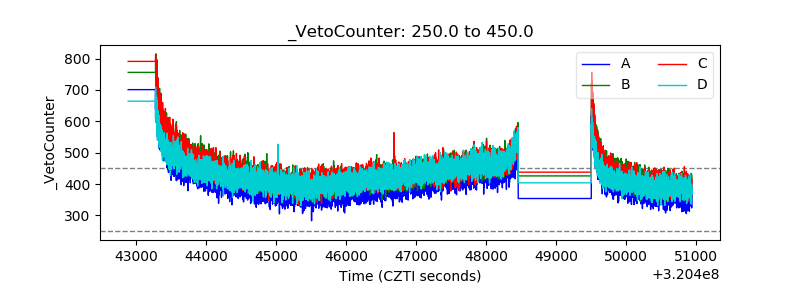 |