| Param | Original file | Final file |
|---|---|---|
| Filename | modeM0/AS1A07_001T01_9000003538_23872cztM0_level2.evt | modeM0/AS1A07_001T01_9000003538_23872cztM0_level2_quad_clean.evt |
| Size (bytes) | 475,390,080 | 135,472,320 |
| Size | 453.4 MB | 129.2 MB |
| Events in quadrant A | 3,219,482 | 920,655 |
| Events in quadrant B | 3,356,367 | 936,498 |
| Events in quadrant C | 3,476,188 | 884,904 |
| Events in quadrant D | 3,866,519 | 870,595 |
| Mode M9 | |||
|---|---|---|---|
| Quadrant | BADHDUFLAG | Total packets | Discarded packets |
| A | 0 | 12 | 0 |
| B | 0 | 13 | 0 |
| C | 0 | 13 | 0 |
| D | 0 | 13 | 0 |
| Mode M0 | |||
|---|---|---|---|
| Quadrant | BADHDUFLAG | Total packets | Discarded packets |
| A | 0 | 14302 | 2 |
| B | 0 | 14546 | 2 |
| C | 0 | 14748 | 2 |
| D | 0 | 16167 | 2 |
| Mode SS | |||
|---|---|---|---|
| Quadrant | BADHDUFLAG | Total packets | Discarded packets |
| A | 0 | 144 | 0 |
| B | 0 | 144 | 0 |
| C | 0 | 144 | 0 |
| D | 0 | 144 | 0 |
| Quadrant | Total seconds | Saturated seconds | Saturation percentage |
|---|---|---|---|
| A | 7043 | 17 | 0.241374% |
| B | 7043 | 36 | 0.511146% |
| C | 7043 | 89 | 1.263666% |
| D | 7043 | 42 | 0.596337% |
Noise dominated data is calculated using 1-second bins in cleaned event files. If a bin has >2000 counts, and if more than 50% of those come from <1% of pixels, then it is considered to be noise-dominated and hence unusable.
| Quadrant | # 1 sec bins | Bins with >0 counts | Bins with >2000 counts | High rate bins dominated by noise | Noise dominated (total time) | Noise dominated (detector-on time) | Marked lightcurve |
|---|---|---|---|---|---|---|---|
| A | 7683 | 7044 | 0 | 0 | 0.00% | 0.00% | 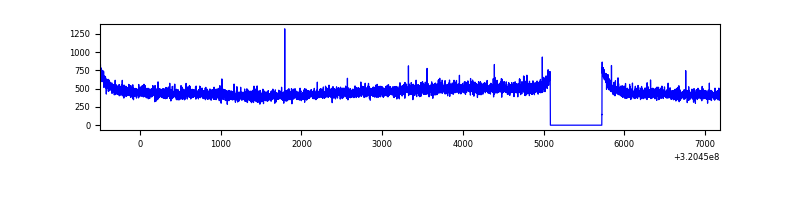 |
| B | 7683 | 7044 | 3 | 3 | 0.04% | 0.04% | 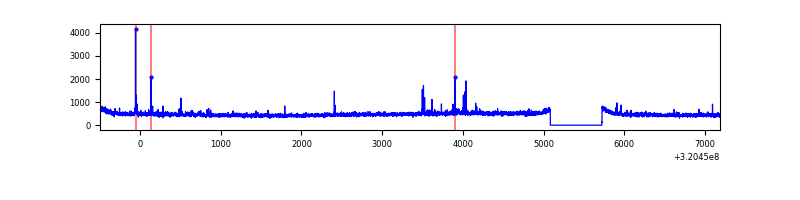 |
| C | 7683 | 7044 | 9 | 9 | 0.12% | 0.13% | 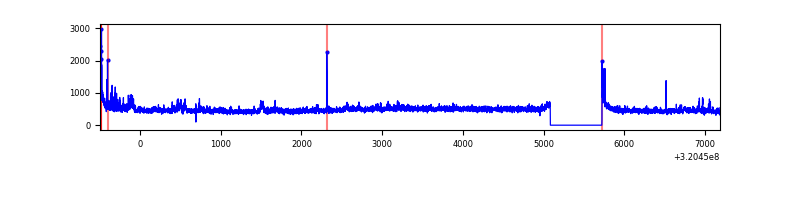 |
| D | 7683 | 7044 | 45 | 45 | 0.59% | 0.64% | 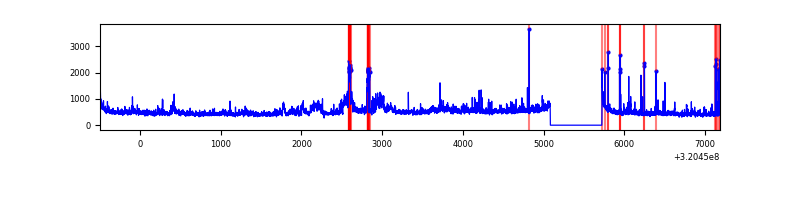 |
Top three noisy pixels from each quadrant. If the there are fewer than three noisy pixels in the level2.evt file, extra rows are filled as -1
| Pixel properties | Quadrant properties | ||||||
|---|---|---|---|---|---|---|---|
| Quadrant | DetID | PixID | Counts | Sigma | Mean | Median | Sigma |
| A | 13 | 254 | 13180 | 74.09 | 833 | 816 | 166.9 |
| A | 3 | 137 | 7133 | 37.86 | 833 | 816 | 166.9 |
| A | 0 | 226 | 7117 | 37.76 | 833 | 816 | 166.9 |
| B | 0 | 189 | 28719 | 176.54 | 836 | 816 | 158.1 |
| B | 4 | 216 | 19045 | 115.33 | 836 | 816 | 158.1 |
| B | 12 | 111 | 18830 | 113.97 | 836 | 816 | 158.1 |
| C | 7 | 247 | 150288 | 809.55 | 795 | 797 | 184.7 |
| C | 14 | 238 | 127823 | 687.9 | 795 | 797 | 184.7 |
| C | 0 | 10 | 96697 | 519.34 | 795 | 797 | 184.7 |
| D | 13 | 174 | 327052 | 1673.05 | 803 | 777 | 195.0 |
| D | 8 | 195 | 317600 | 1624.58 | 803 | 777 | 195.0 |
| D | 1 | 52 | 142210 | 725.23 | 803 | 777 | 195.0 |
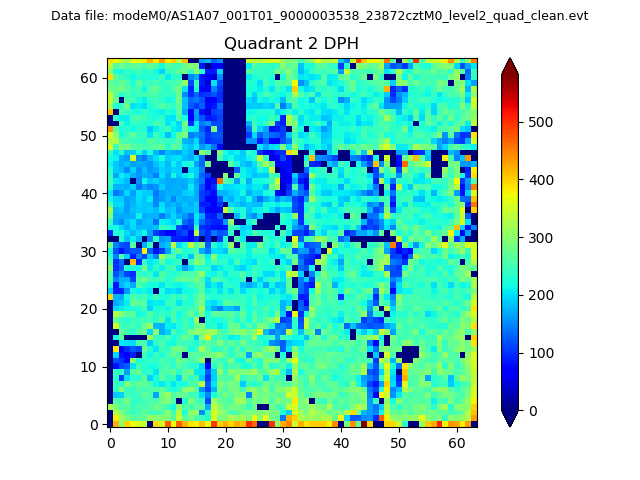
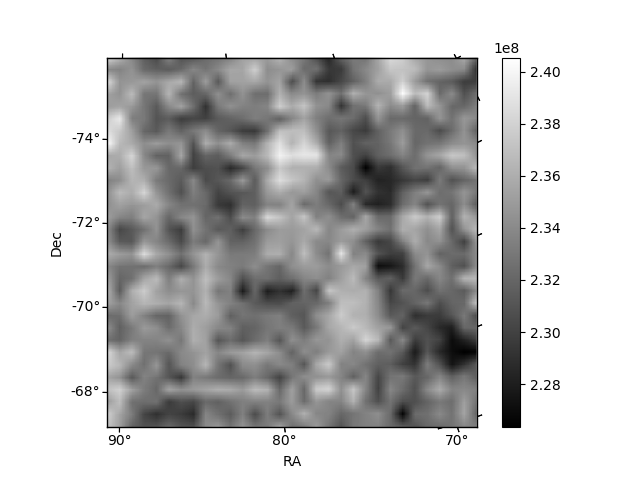
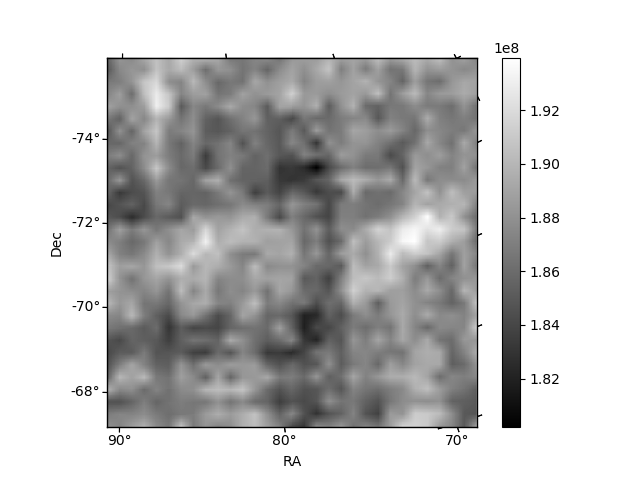
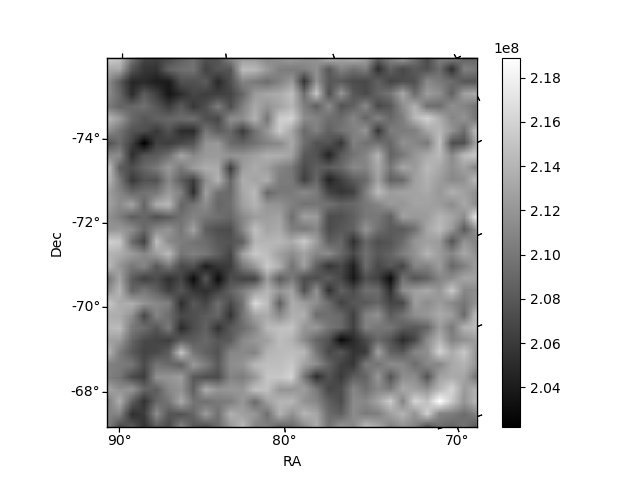
Histogram calculated using DETX and DETY for each event in the final _common_clean file
| Quadrant A | 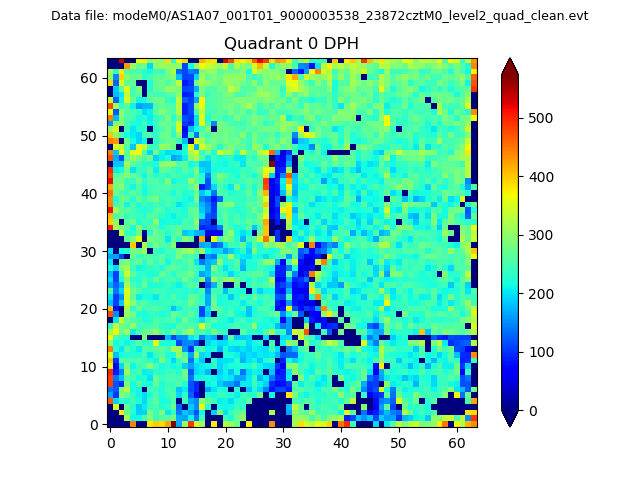 |
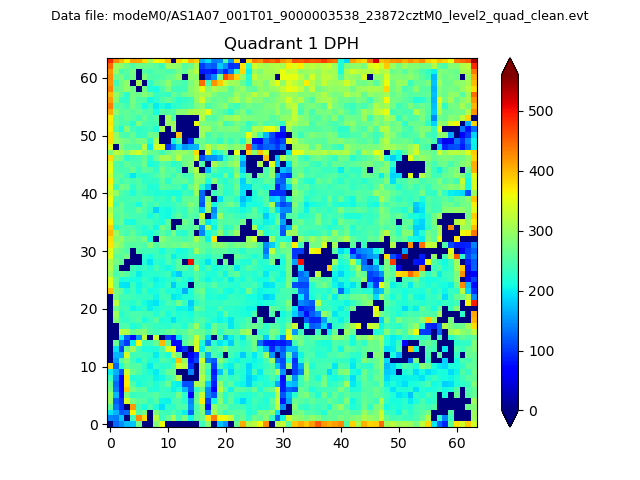 |
Quadrant B |
|---|---|---|---|
| Quadrant D | 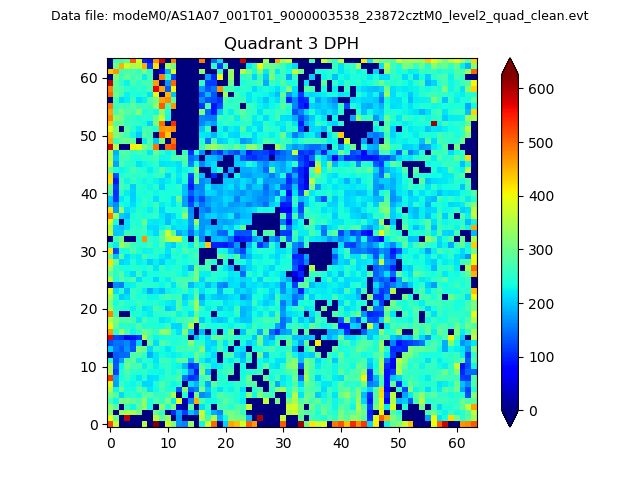 |
 |
Quadrant C |
| Plot type | Count rate plots | Images |
|---|---|---|
| Comparison with Poisson distribution Blue bars denote a histogram of data divided into 1 sec bins. Red curve is a Poisson curve with rate = median count rate of data. |
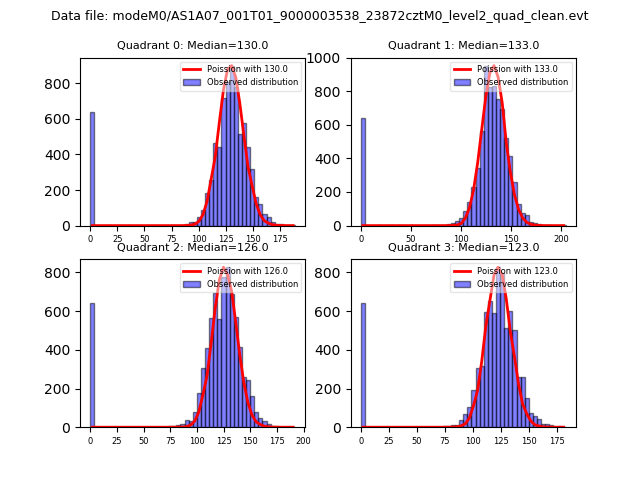 |
 |
| Quadrant-wise count rates Data is divided into 100 sec bins |
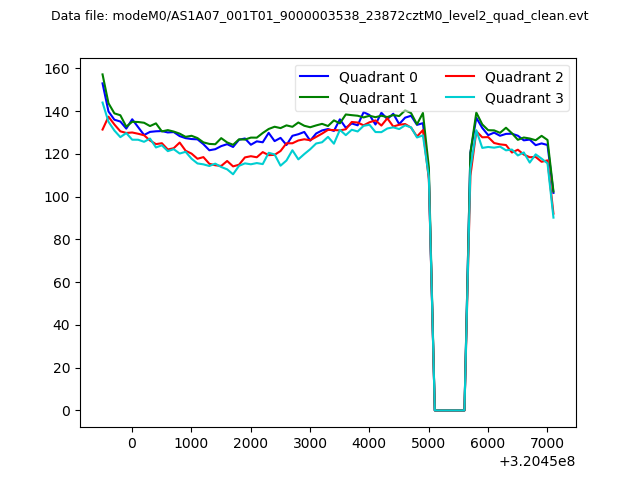 |
|
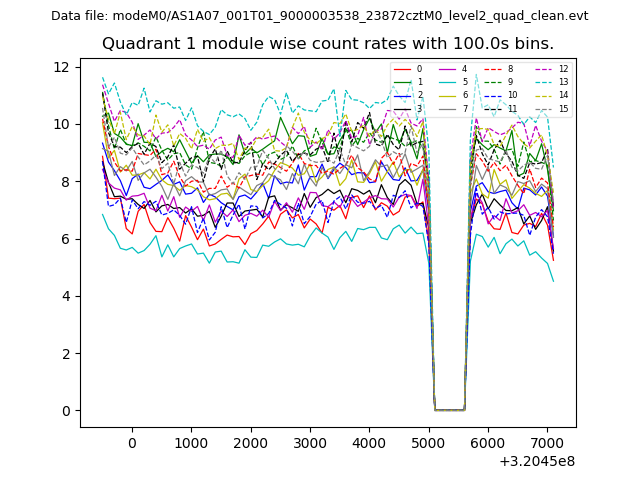
| Module-wise count rates for Quadrant A Data is divided into 100 sec bins |
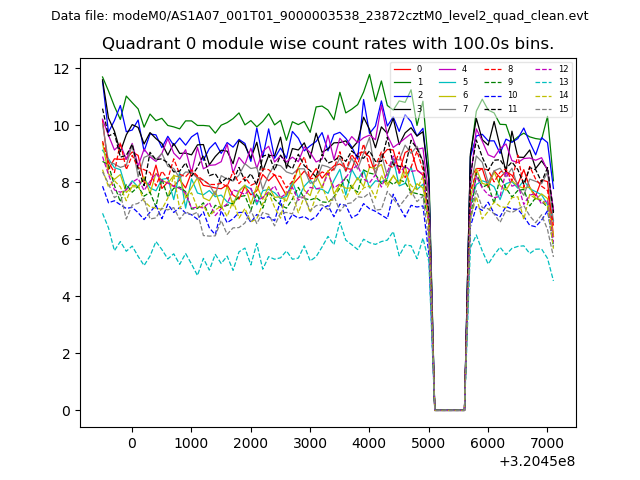 |
 |
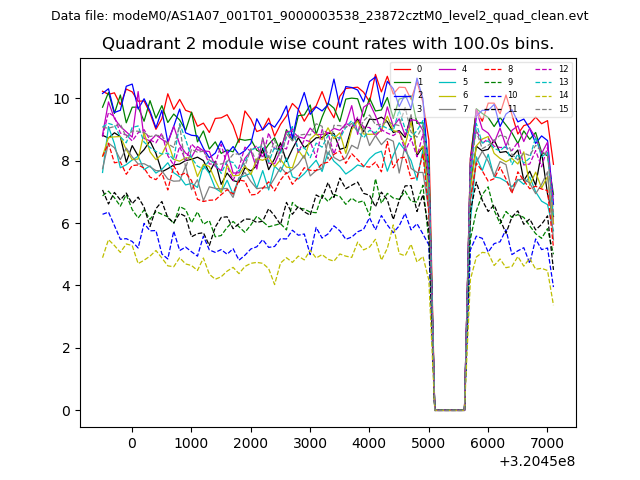
| Module-wise count rates for Quadrant B Data is divided into 100 sec bins |
 |
 |
| Module-wise count rates for Quadrant C Data is divided into 100 sec bins |
 |
 |
| Module-wise count rates for Quadrant D Data is divided into 100 sec bins |
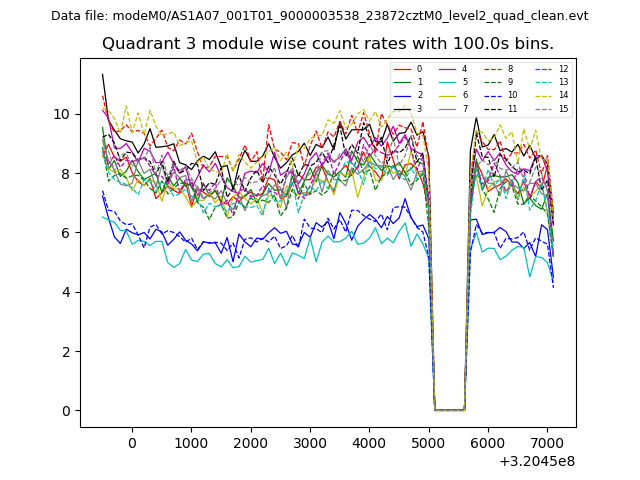 |
 |
| Parameter | Plot |
|---|---|
| CZT HV Monitor | 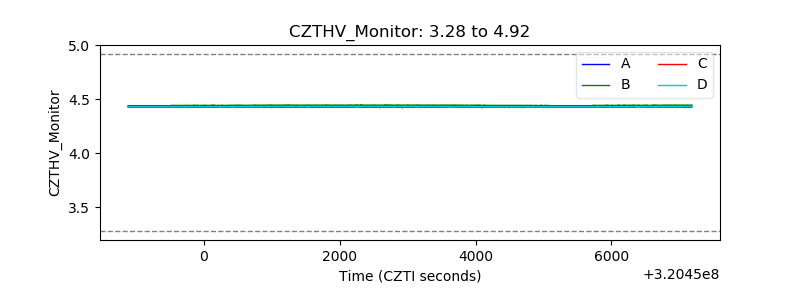 |
| D_VDD | 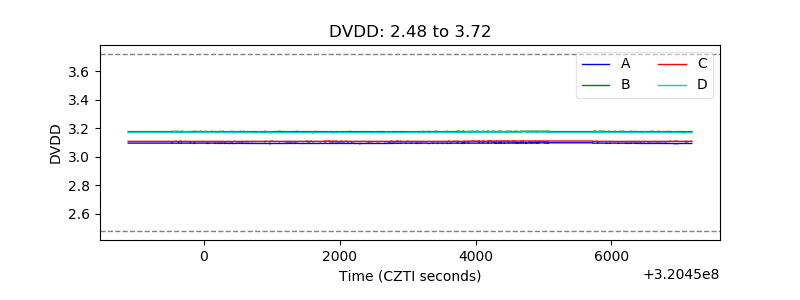 |
| Temperature 1 | 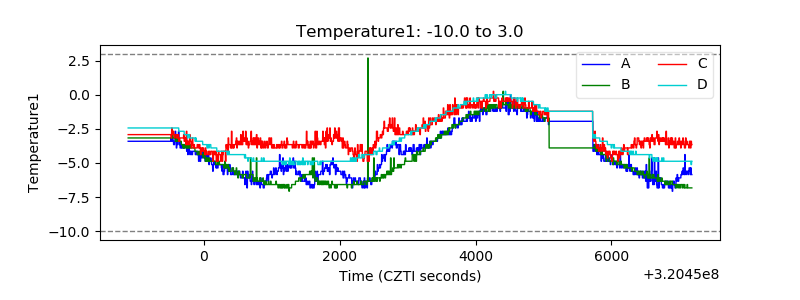 |
| Veto HV Monitor | 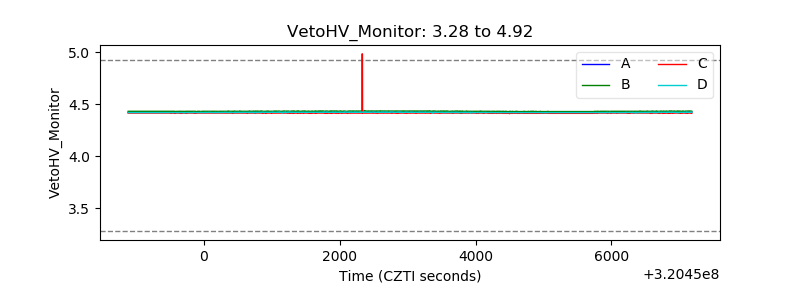 |
| Veto LLD | 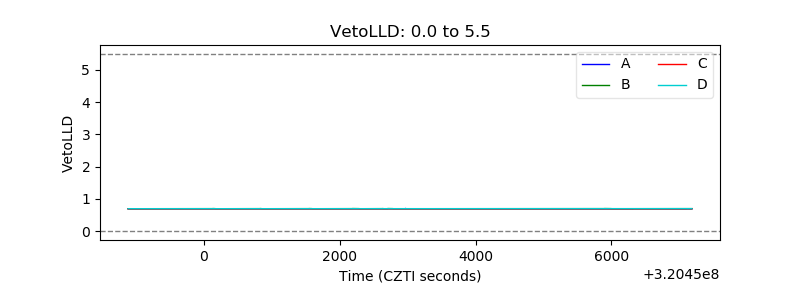 |
| Alpha Counter | 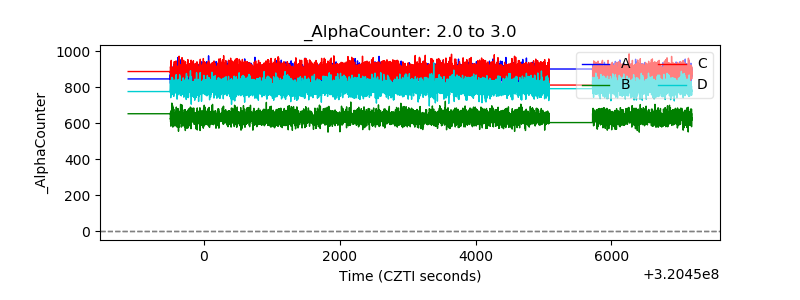 |
| _CPM_Rate | 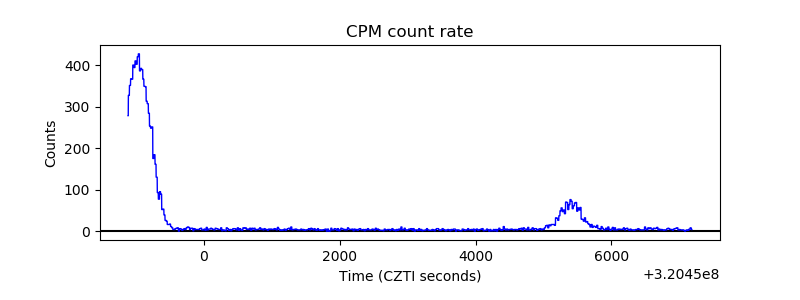 |
| CZT Counter | 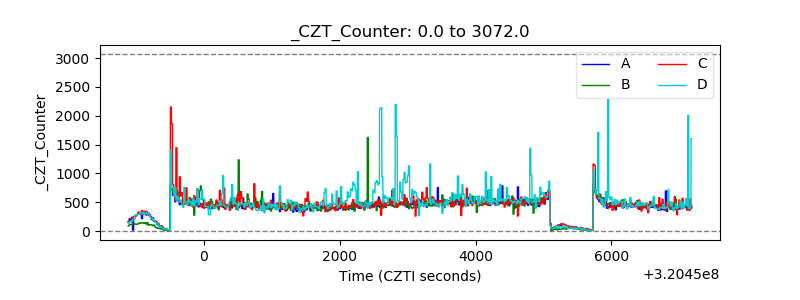 |
| +2.5 Volts monitor |  |
| +5 Volts monitor | 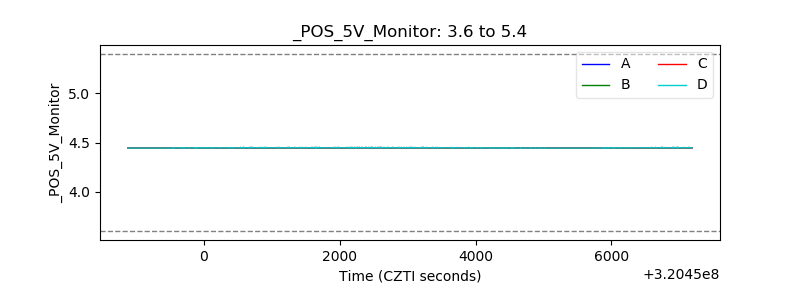 |
| _ROLL_ROT | 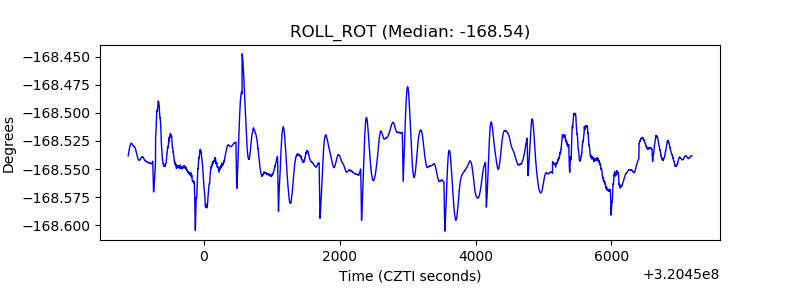 |
| _Roll_DEC | 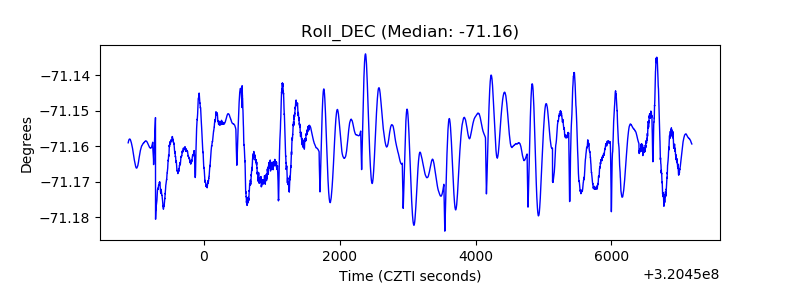 |
| _Roll_RA |  |
| Veto Counter | 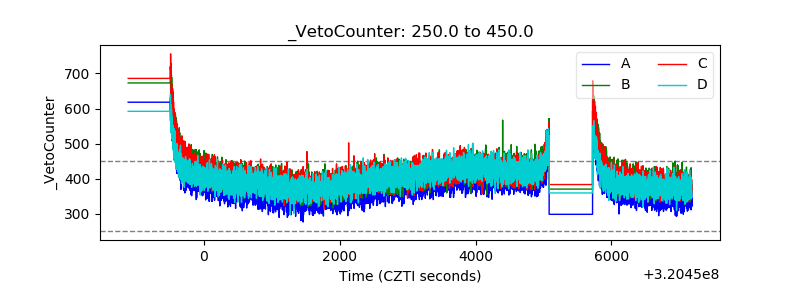 |