| Param | Original file | Final file |
|---|---|---|
| Filename | modeM0/AS1A07_001T01_9000003538_23873cztM0_level2.evt | modeM0/AS1A07_001T01_9000003538_23873cztM0_level2_quad_clean.evt |
| Size (bytes) | 534,251,520 | 150,431,040 |
| Size | 509.5 MB | 143.5 MB |
| Events in quadrant A | 3,657,841 | 1,021,974 |
| Events in quadrant B | 3,806,582 | 1,035,640 |
| Events in quadrant C | 3,838,012 | 981,373 |
| Events in quadrant D | 4,334,419 | 961,736 |
| Mode M9 | |||
|---|---|---|---|
| Quadrant | BADHDUFLAG | Total packets | Discarded packets |
| A | 0 | 9 | 0 |
| B | 0 | 9 | 0 |
| C | 0 | 9 | 0 |
| D | 0 | 9 | 0 |
| Mode M0 | |||
|---|---|---|---|
| Quadrant | BADHDUFLAG | Total packets | Discarded packets |
| A | 0 | 16328 | 2 |
| B | 0 | 16583 | 3 |
| C | 0 | 16613 | 2 |
| D | 0 | 18482 | 2 |
| Mode SS | |||
|---|---|---|---|
| Quadrant | BADHDUFLAG | Total packets | Discarded packets |
| A | 0 | 166 | 0 |
| B | 0 | 166 | 0 |
| C | 0 | 166 | 0 |
| D | 0 | 166 | 0 |
| Quadrant | Total seconds | Saturated seconds | Saturation percentage |
|---|---|---|---|
| A | 7989 | 50 | 0.625861% |
| B | 7989 | 79 | 0.988860% |
| C | 7989 | 115 | 1.439479% |
| D | 7989 | 96 | 1.201652% |
Noise dominated data is calculated using 1-second bins in cleaned event files. If a bin has >2000 counts, and if more than 50% of those come from <1% of pixels, then it is considered to be noise-dominated and hence unusable.
| Quadrant | # 1 sec bins | Bins with >0 counts | Bins with >2000 counts | High rate bins dominated by noise | Noise dominated (total time) | Noise dominated (detector-on time) | Marked lightcurve |
|---|---|---|---|---|---|---|---|
| A | 8919 | 7991 | 0 | 0 | 0.00% | 0.00% | 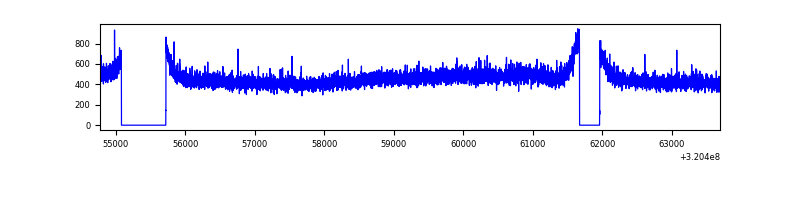 |
| B | 8919 | 7991 | 6 | 6 | 0.07% | 0.08% | 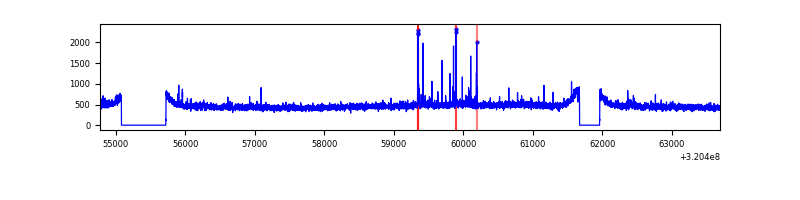 |
| C | 8919 | 7991 | 1 | 1 | 0.01% | 0.01% | 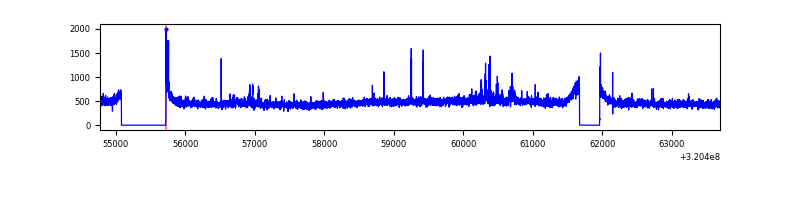 |
| D | 8919 | 7991 | 39 | 39 | 0.44% | 0.49% | 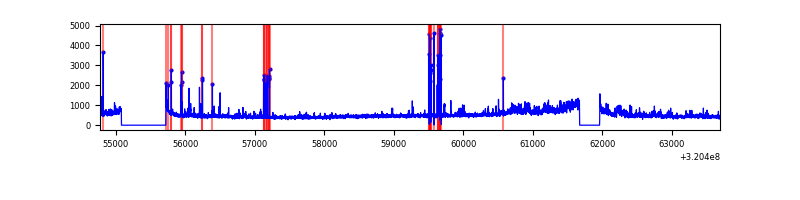 |
Top three noisy pixels from each quadrant. If the there are fewer than three noisy pixels in the level2.evt file, extra rows are filled as -1
| Pixel properties | Quadrant properties | ||||||
|---|---|---|---|---|---|---|---|
| Quadrant | DetID | PixID | Counts | Sigma | Mean | Median | Sigma |
| A | 13 | 254 | 13918 | 68.35 | 946 | 925 | 190.1 |
| A | 3 | 137 | 8576 | 40.25 | 946 | 925 | 190.1 |
| A | 0 | 226 | 8146 | 37.99 | 946 | 925 | 190.1 |
| B | 4 | 216 | 31802 | 171.94 | 949 | 925 | 179.6 |
| B | 0 | 189 | 25040 | 134.29 | 949 | 925 | 179.6 |
| B | 12 | 111 | 21880 | 116.69 | 949 | 925 | 179.6 |
| C | 14 | 238 | 146090 | 688.84 | 908 | 909 | 210.8 |
| C | 7 | 247 | 80093 | 375.7 | 908 | 909 | 210.8 |
| C | 0 | 10 | 71169 | 333.36 | 908 | 909 | 210.8 |
| D | 8 | 195 | 430683 | 1926.99 | 916 | 890 | 223.0 |
| D | 1 | 52 | 195354 | 871.89 | 916 | 890 | 223.0 |
| D | 7 | 223 | 101252 | 449.98 | 916 | 890 | 223.0 |
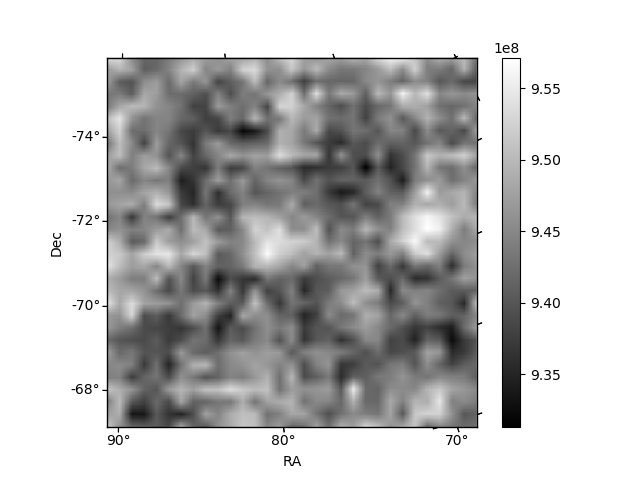
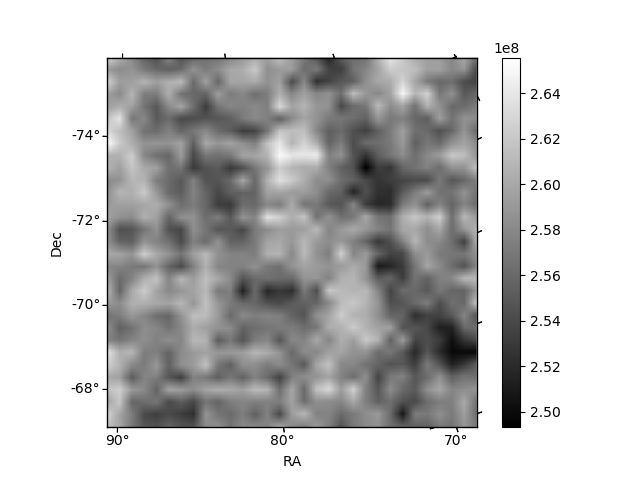
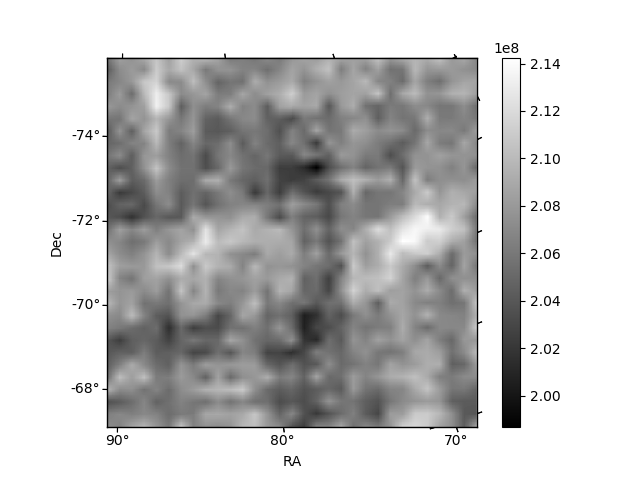
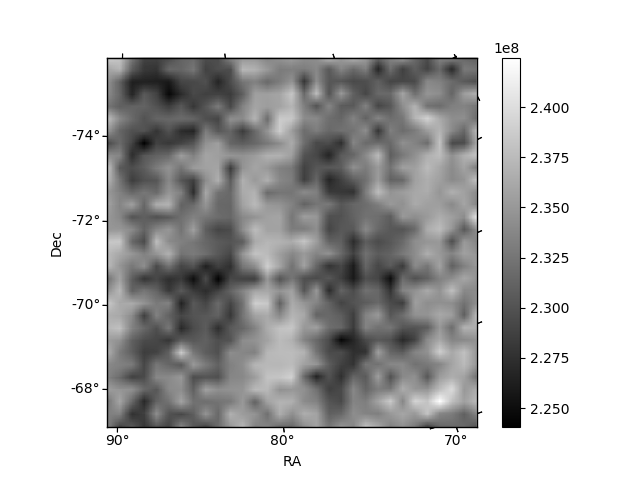
Histogram calculated using DETX and DETY for each event in the final _common_clean file
| Quadrant A | 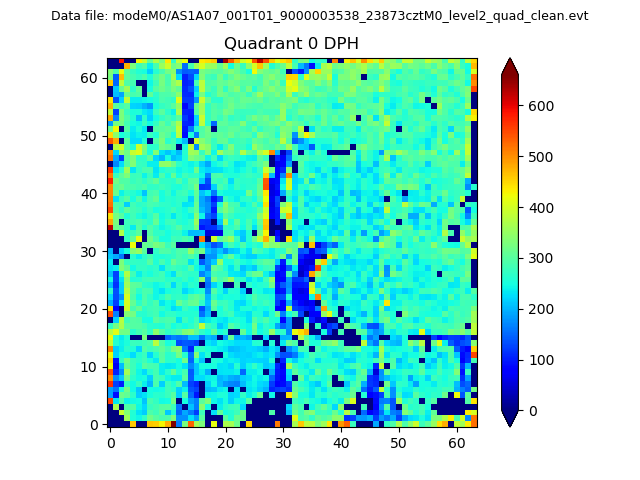 |
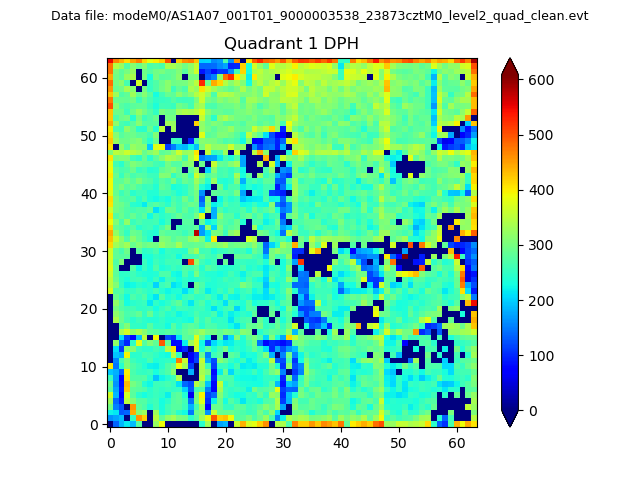 |
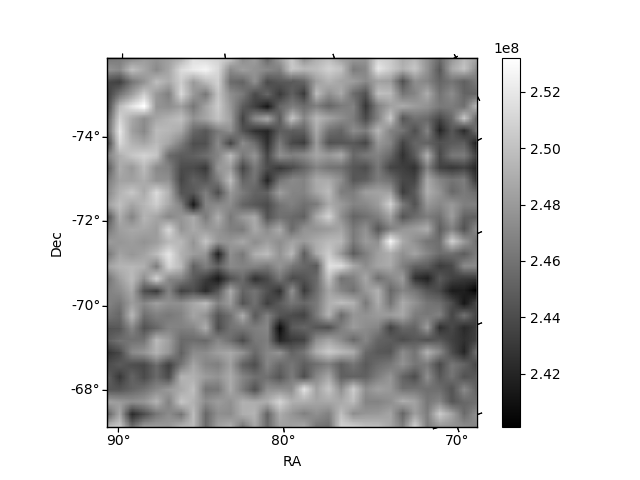
Quadrant B |
|---|---|---|---|
| Quadrant D | 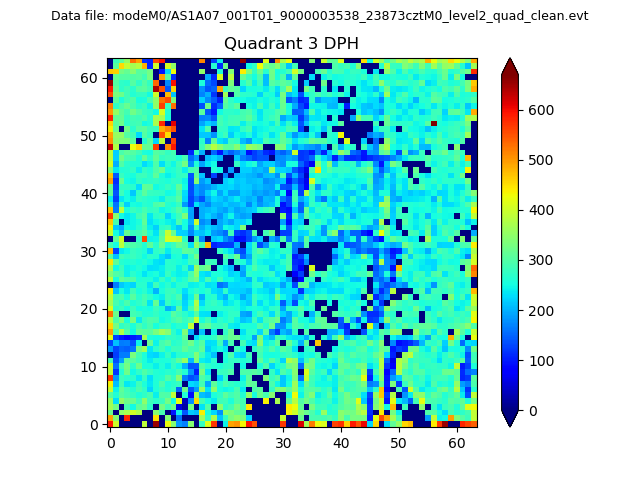 |
 |
Quadrant C |
| Plot type | Count rate plots | Images |
|---|---|---|
| Comparison with Poisson distribution Blue bars denote a histogram of data divided into 1 sec bins. Red curve is a Poisson curve with rate = median count rate of data. |
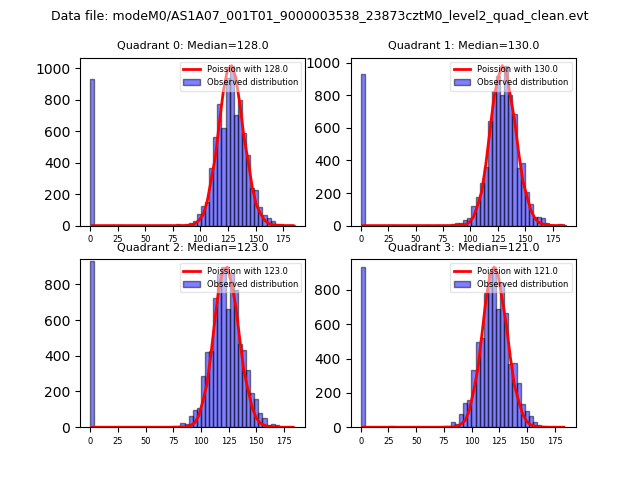 |
 |
| Quadrant-wise count rates Data is divided into 100 sec bins |
 |
|
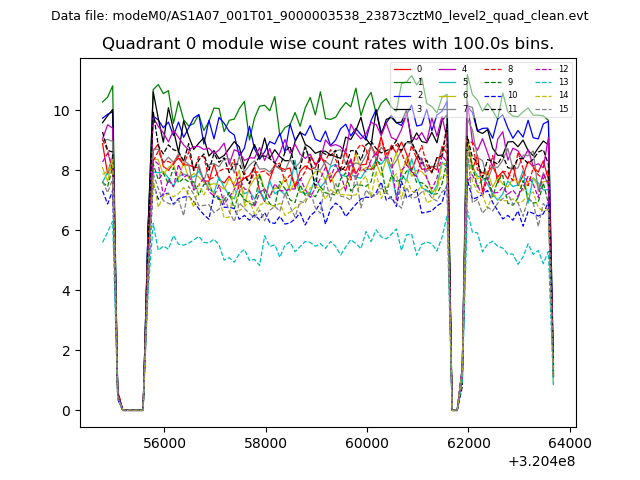
| Module-wise count rates for Quadrant A Data is divided into 100 sec bins |
 |
 |
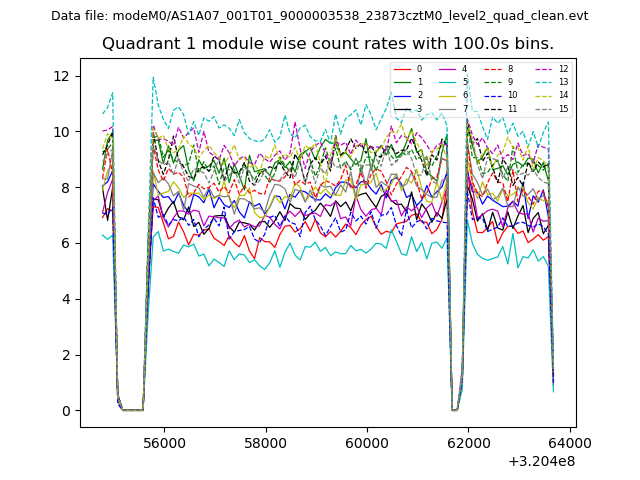
| Module-wise count rates for Quadrant B Data is divided into 100 sec bins |
 |
 |
| Module-wise count rates for Quadrant C Data is divided into 100 sec bins |
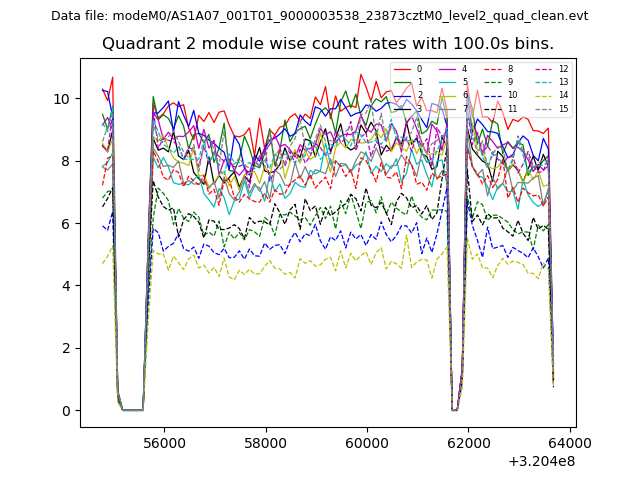 |
 |
| Module-wise count rates for Quadrant D Data is divided into 100 sec bins |
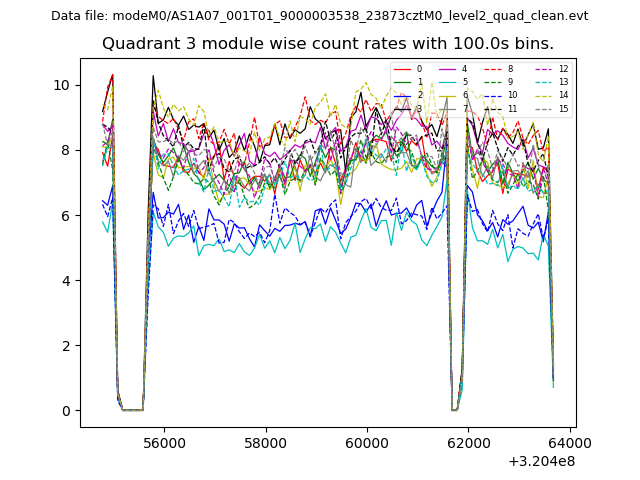 |
 |
| Parameter | Plot |
|---|---|
| CZT HV Monitor | 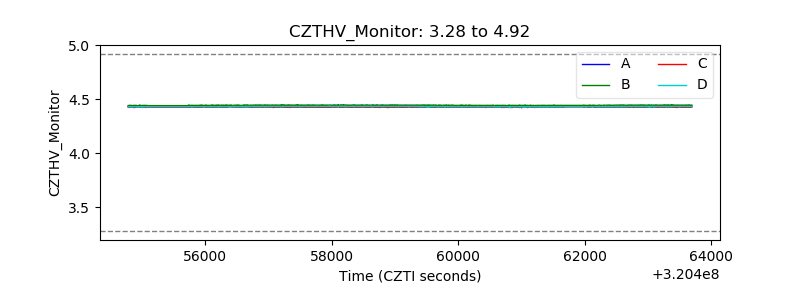 |
| D_VDD | 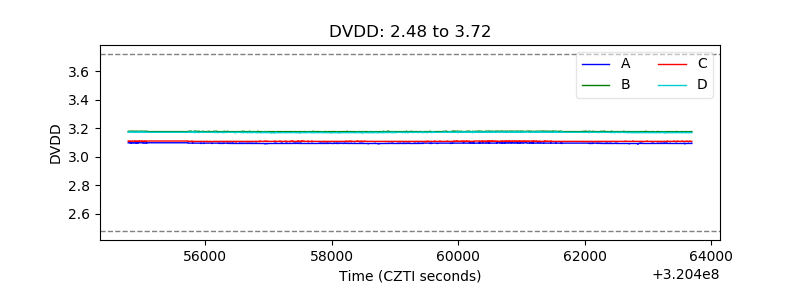 |
| Temperature 1 | 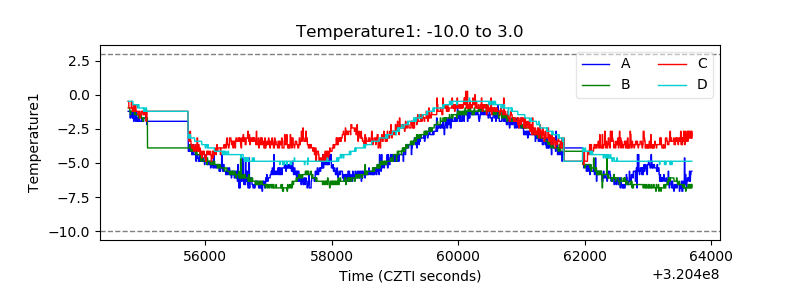 |
| Veto HV Monitor | 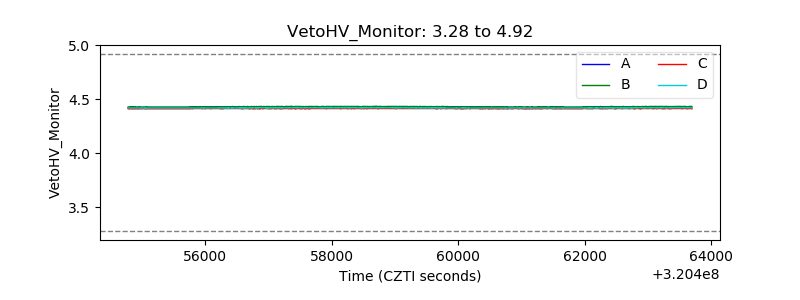 |
| Veto LLD | 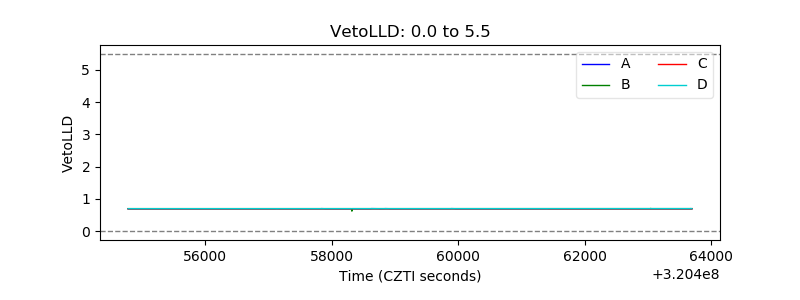 |
| Alpha Counter | 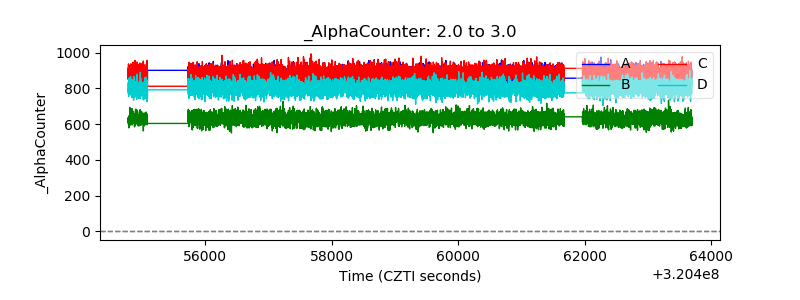 |
| _CPM_Rate | 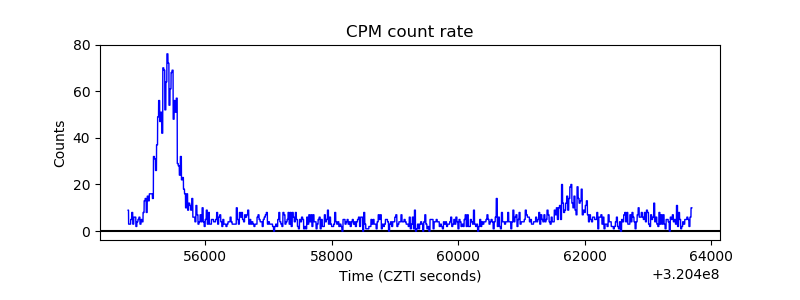 |
| CZT Counter | 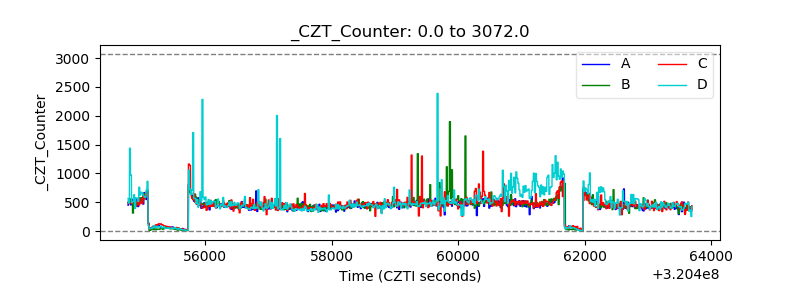 |
| +2.5 Volts monitor |  |
| +5 Volts monitor |  |
| _ROLL_ROT |  |
| _Roll_DEC | 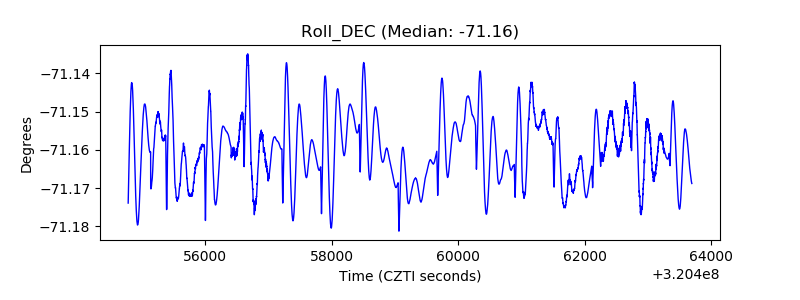 |
| _Roll_RA | 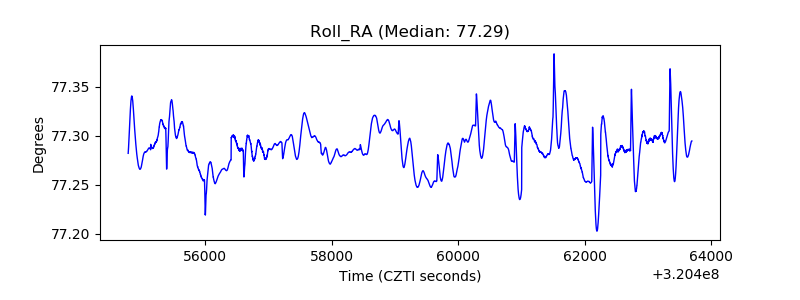 |
| Veto Counter | 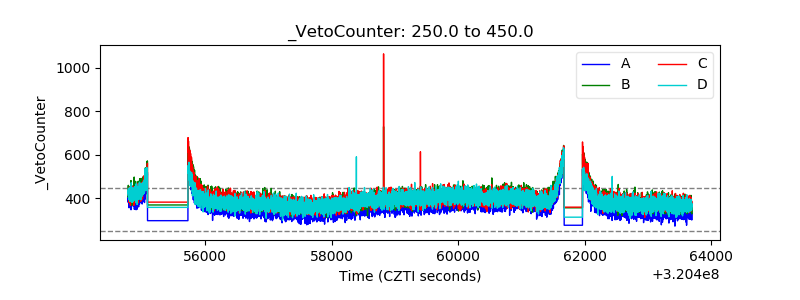 |