| Param | Original file | Final file |
|---|---|---|
| Filename | modeM0/AS1C05_002T07_9000003536cztM0_level2.fits | modeM0/AS1C05_002T07_9000003536cztM0_level2_quad_clean.evt |
| Size (bytes) | 69,937,920 | 35,904,960 |
| Size | 66.7 MB | 34.2 MB |
| Events in quadrant A | 443,790 | 168,670 |
| Events in quadrant B | 426,476 | 172,213 |
| Events in quadrant C | 435,034 | 165,339 |
| Events in quadrant D | 384,686 | 151,620 |
| Mode M0 | |||
|---|---|---|---|
| Quadrant | BADHDUFLAG | Total packets | Discarded packets |
| A | 0 | 13655 | 0 |
| B | 0 | 13971 | 0 |
| C | 0 | 14385 | 0 |
| D | 0 | 15399 | 0 |
| Mode M9 | |||
|---|---|---|---|
| Quadrant | BADHDUFLAG | Total packets | Discarded packets |
| A | 0 | 18 | 0 |
| B | 0 | 18 | 0 |
| C | 0 | 18 | 0 |
| D | 0 | 18 | 0 |
| Mode SS | |||
|---|---|---|---|
| Quadrant | BADHDUFLAG | Total packets | Discarded packets |
| A | 0 | 126 | 0 |
| B | 0 | 126 | 0 |
| C | 0 | 126 | 0 |
| D | 0 | 126 | 0 |
| Quadrant | Total seconds | Saturated seconds | Saturation percentage |
|---|---|---|---|
| A | 6136 | 158 | 2.574967% |
| B | 6136 | 182 | 2.966102% |
| C | 6136 | 252 | 4.106910% |
| D | 6136 | 165 | 2.689048% |
Noise dominated data is calculated using 1-second bins in cleaned event files. If a bin has >2000 counts, and if more than 50% of those come from <1% of pixels, then it is considered to be noise-dominated and hence unusable.
| Quadrant | # 1 sec bins | Bins with >0 counts | Bins with >2000 counts | High rate bins dominated by noise | Noise dominated (total time) | Noise dominated (detector-on time) | Marked lightcurve |
|---|---|---|---|---|---|---|---|
| A | 7491 | 6136 | 0 | 0 | 0.00% | 0.00% | 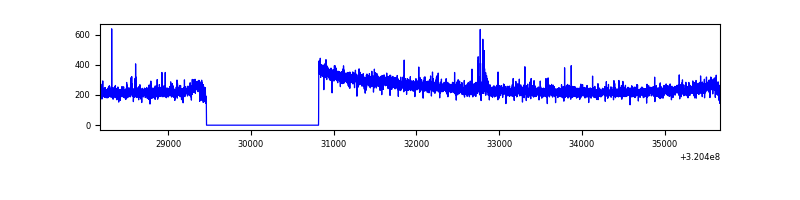 |
| B | 7491 | 6137 | 0 | 0 | 0.00% | 0.00% | 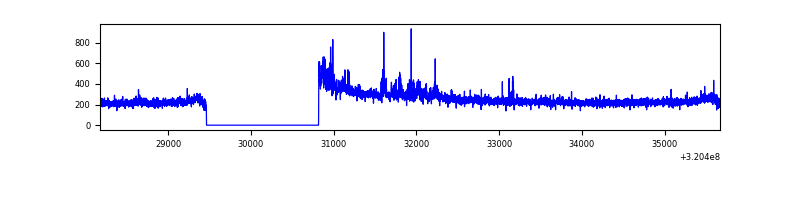 |
| C | 7491 | 6136 | 0 | 0 | 0.00% | 0.00% | 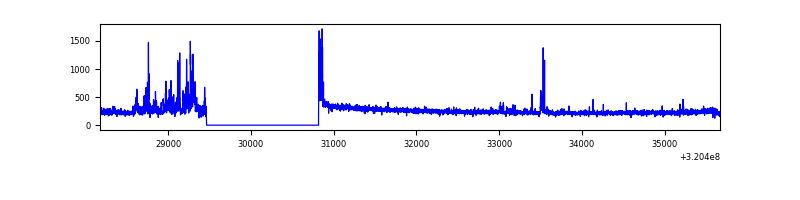 |
| D | 7491 | 6136 | 0 | 0 | 0.00% | 0.00% | 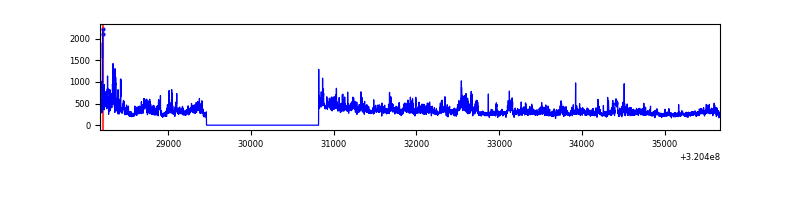 |
Top three noisy pixels from each quadrant. If the there are fewer than three noisy pixels in the level2.evt file, extra rows are filled as -1
| Pixel properties | Quadrant properties | ||||||
|---|---|---|---|---|---|---|---|
| Quadrant | DetID | PixID | Counts | Sigma | Mean | Median | Sigma |
| A | 0 | 29 | 429 | 10.78 | 115 | 109 | 29.7 |
| A | 7 | 110 | 347 | 8.02 | 115 | 109 | 29.7 |
| A | 14 | 79 | 344 | 7.92 | 115 | 109 | 29.7 |
| B | 2 | 9 | 337 | 9.4 | 112 | 108 | 24.4 |
| B | 5 | 255 | 299 | 7.84 | 112 | 108 | 24.4 |
| B | 3 | 80 | 290 | 7.47 | 112 | 108 | 24.4 |
| C | 1 | 80 | 330 | 7.29 | 114 | 108 | 30.5 |
| C | 3 | 202 | 324 | 7.09 | 114 | 108 | 30.5 |
| C | 3 | 126 | 313 | 6.73 | 114 | 108 | 30.5 |
| D | 10 | 189 | 296 | 6.47 | 109 | 100 | 30.3 |
| D | 3 | 14 | 289 | 6.24 | 109 | 100 | 30.3 |
| D | 15 | 46 | 283 | 6.04 | 109 | 100 | 30.3 |
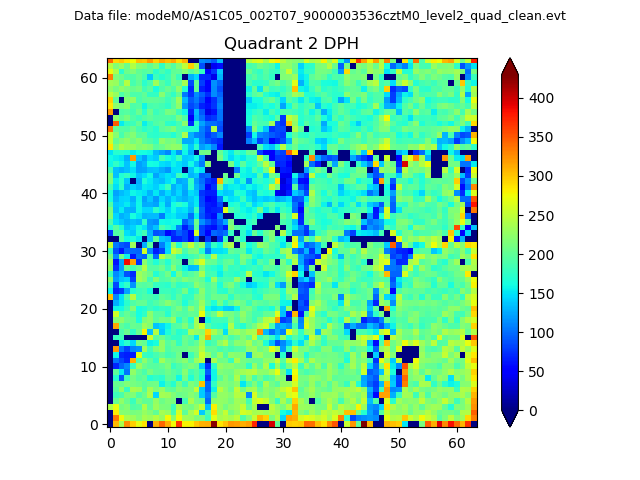
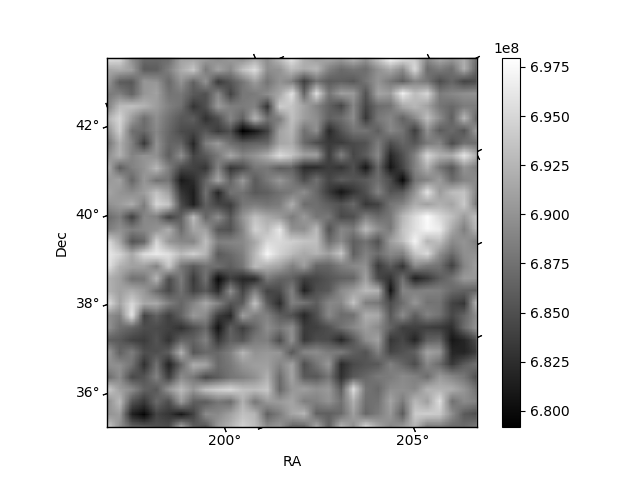
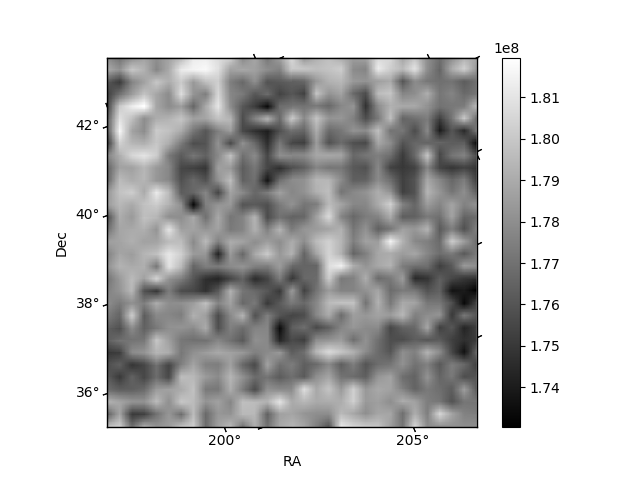
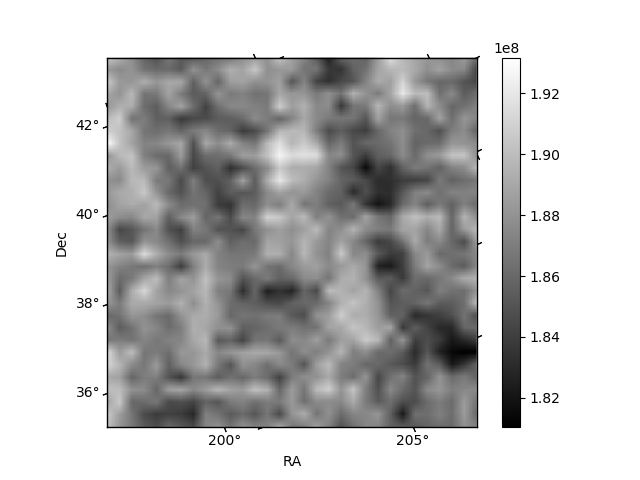
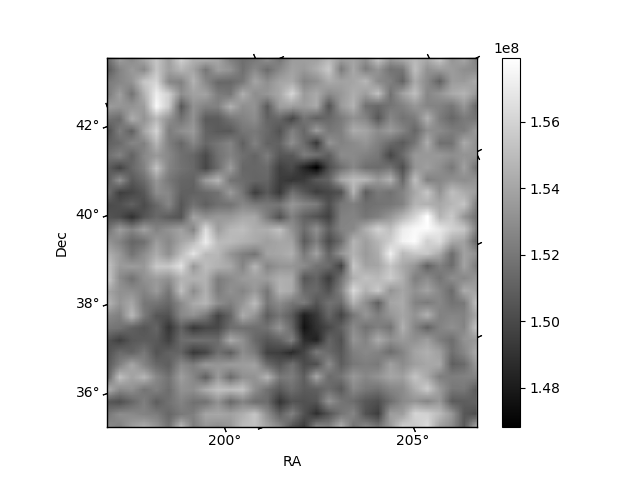
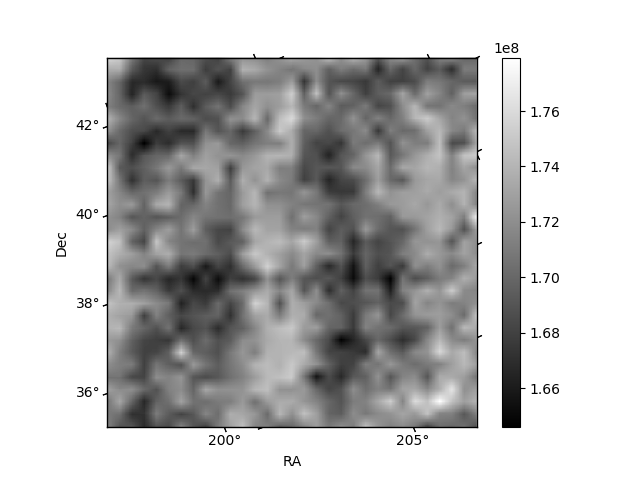
Histogram calculated using DETX and DETY for each event in the final _common_clean file
| Quadrant A | 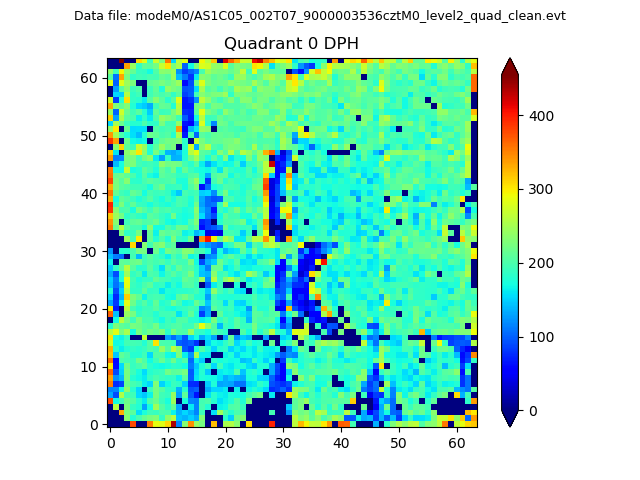 |
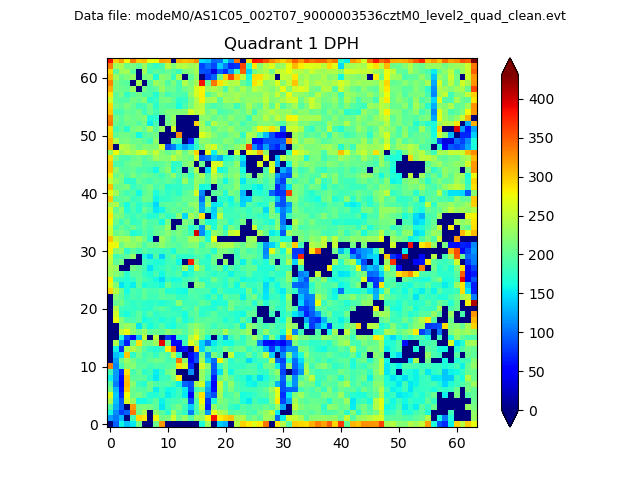 |
Quadrant B |
|---|---|---|---|
| Quadrant D | 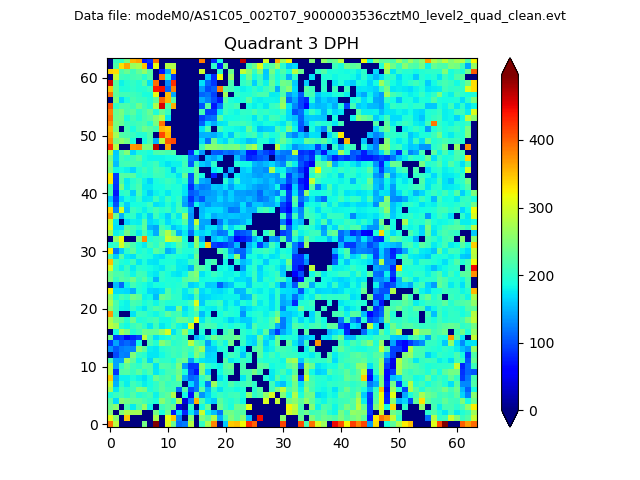 |
 |
Quadrant C |
| Plot type | Count rate plots | Images |
|---|---|---|
| Comparison with Poisson distribution Blue bars denote a histogram of data divided into 1 sec bins. Red curve is a Poisson curve with rate = median count rate of data. |
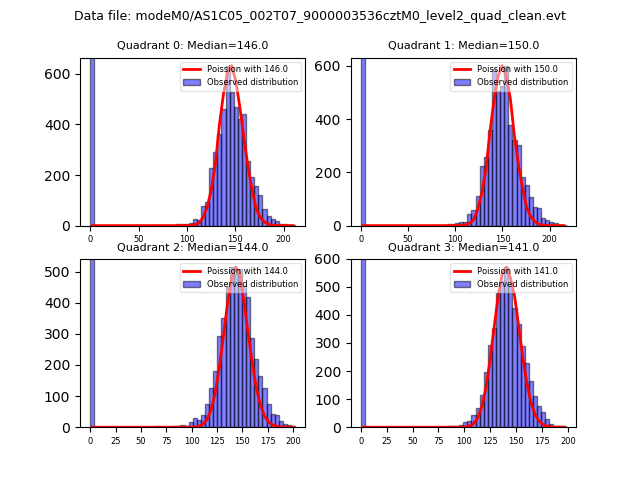 |
 |
| Quadrant-wise count rates Data is divided into 100 sec bins |
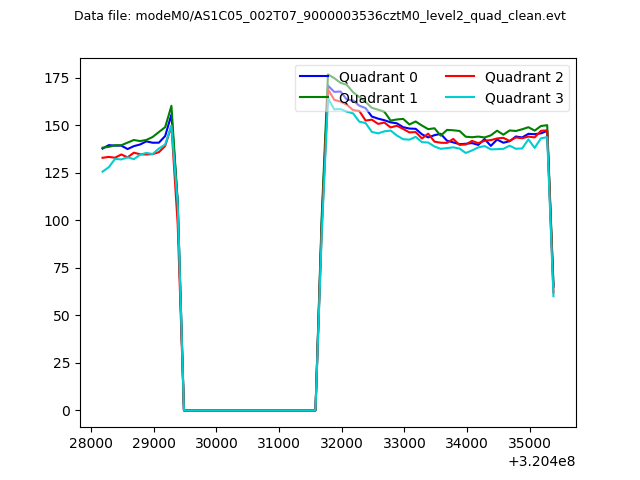 |
|
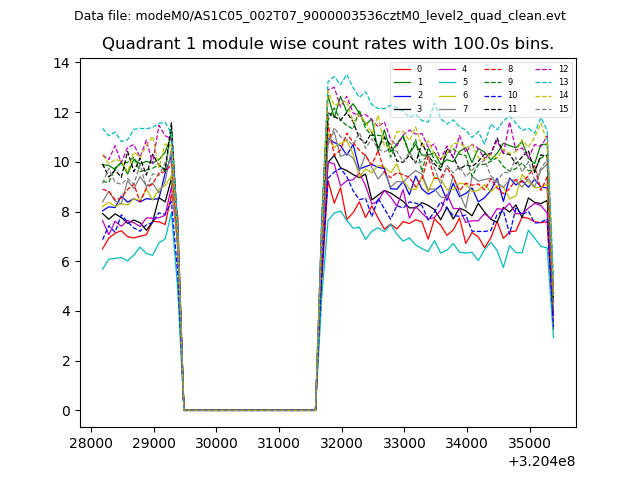
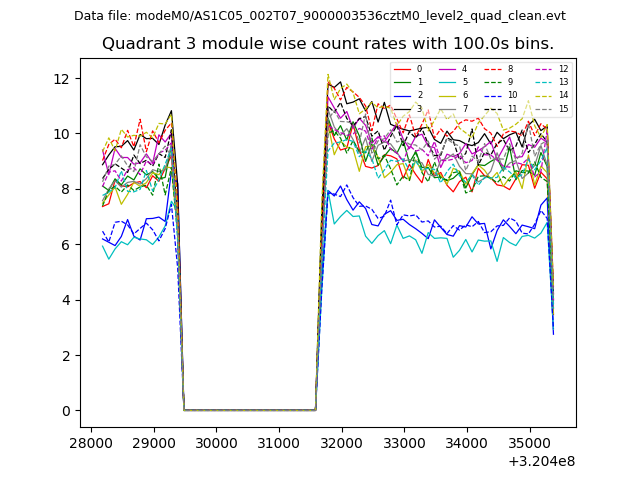
| Module-wise count rates for Quadrant A Data is divided into 100 sec bins |
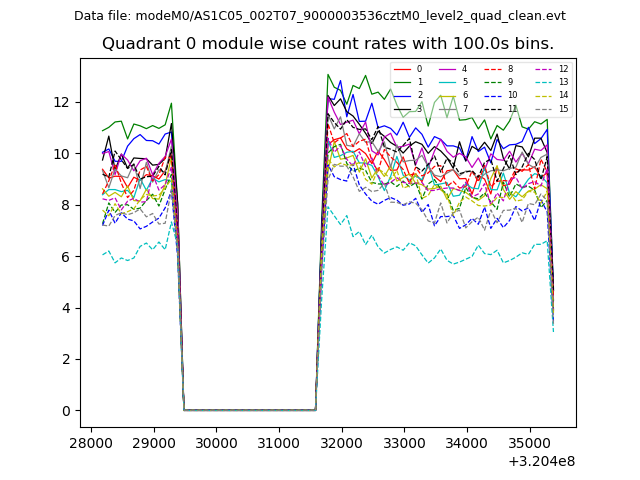 |
 |
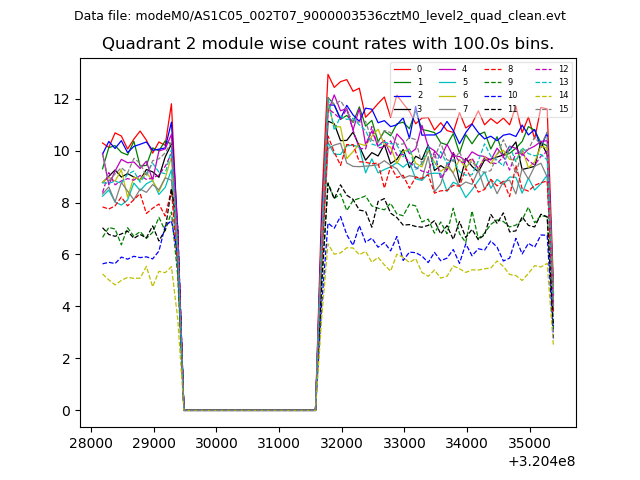
| Module-wise count rates for Quadrant B Data is divided into 100 sec bins |
 |
 |
| Module-wise count rates for Quadrant C Data is divided into 100 sec bins |
 |
 |
| Module-wise count rates for Quadrant D Data is divided into 100 sec bins |
 |
 |
| Parameter | Plot |
|---|---|
| CZT HV Monitor | 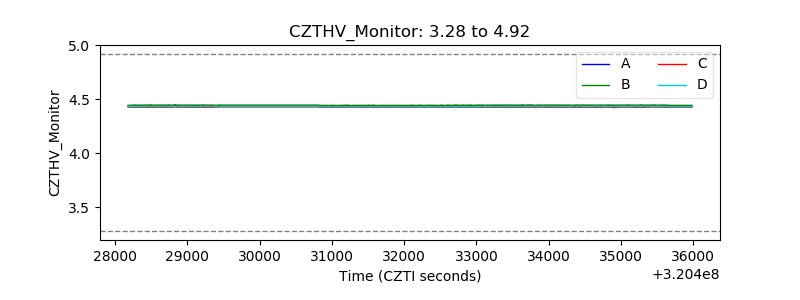 |
| D_VDD | 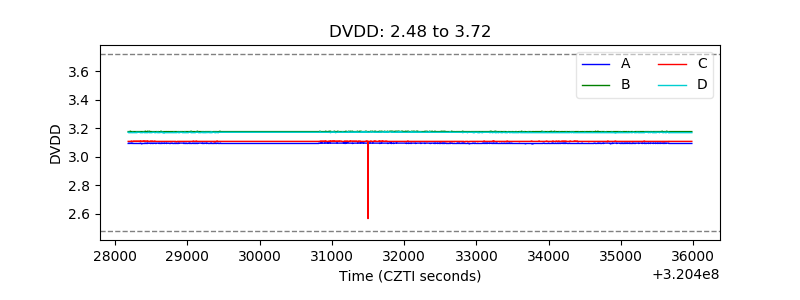 |
| Temperature 1 | 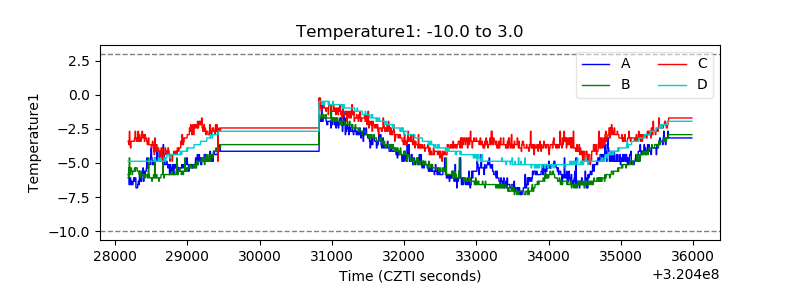 |
| Veto HV Monitor | 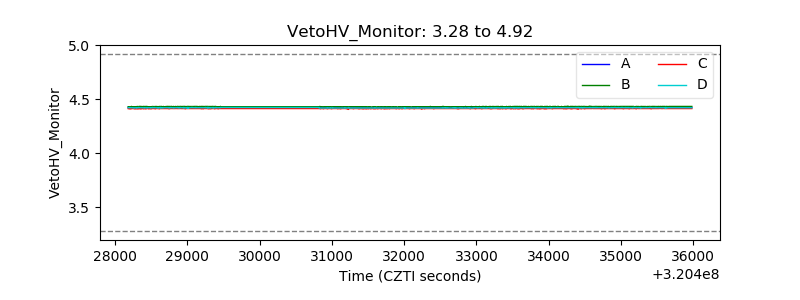 |
| Veto LLD | 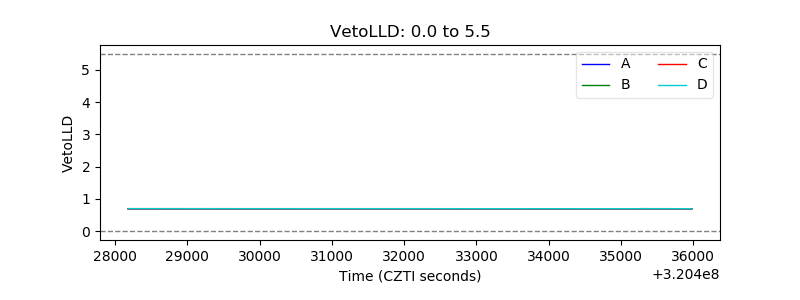 |
| Alpha Counter | 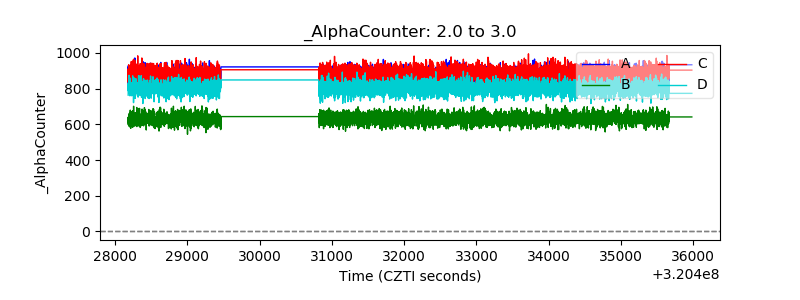 |
| _CPM_Rate | 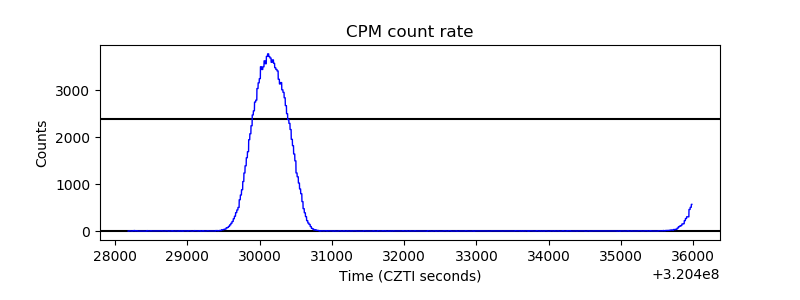 |
| CZT Counter | 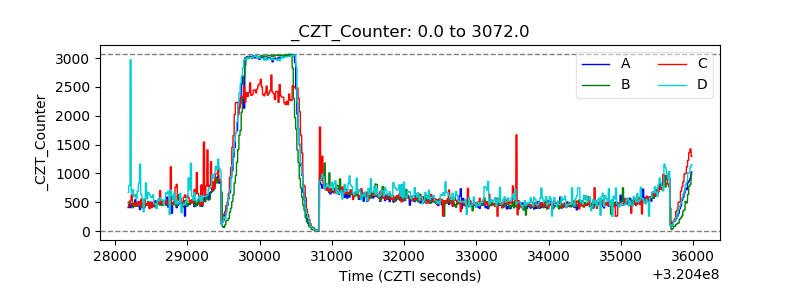 |
| +2.5 Volts monitor | 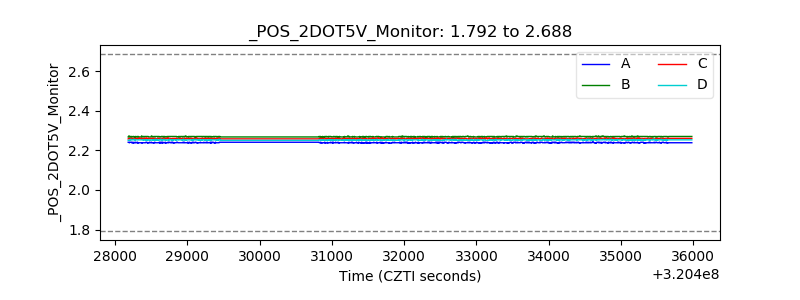 |
| +5 Volts monitor | 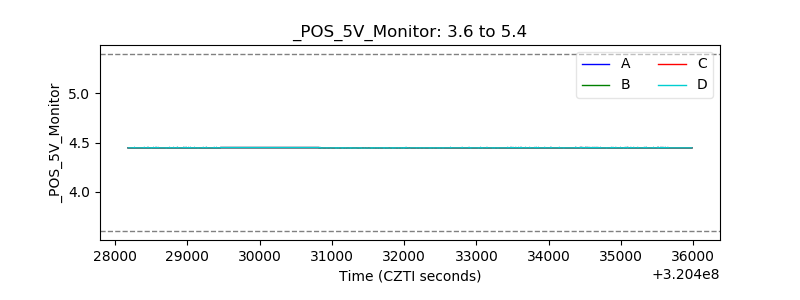 |
| _ROLL_ROT | 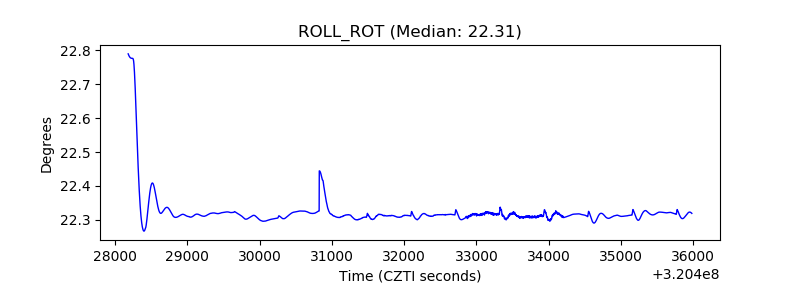 |
| _Roll_DEC | 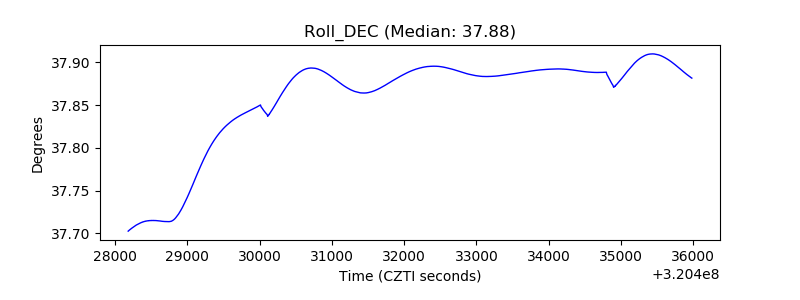 |
| _Roll_RA | 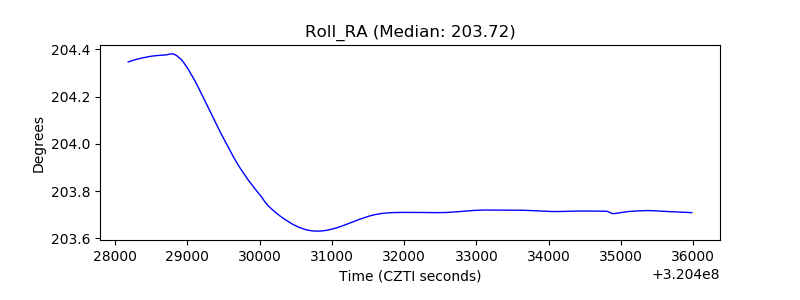 |
| Veto Counter | 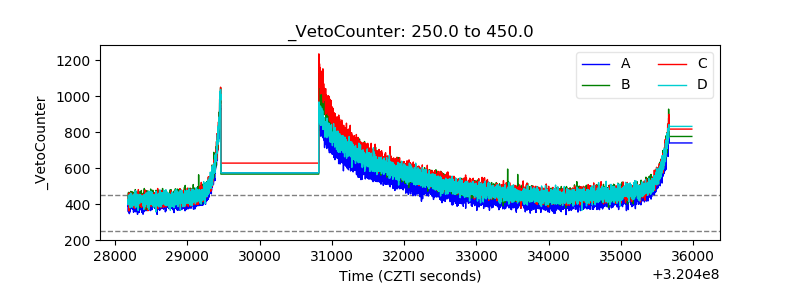 |