| Param | Original file | Final file |
|---|---|---|
| Filename | modeM0/AS1C05_002T07_9000003536_23868cztM0_level2.evt | modeM0/AS1C05_002T07_9000003536_23868cztM0_level2_quad_clean.evt |
| Size (bytes) | 223,306,560 | 38,448,000 |
| Size | 213.0 MB | 36.7 MB |
| Events in quadrant A | 1,500,440 | 248,389 |
| Events in quadrant B | 1,577,611 | 253,723 |
| Events in quadrant C | 1,689,895 | 239,142 |
| Events in quadrant D | 1,817,094 | 236,533 |
| Mode M0 | |||
|---|---|---|---|
| Quadrant | BADHDUFLAG | Total packets | Discarded packets |
| A | 0 | 6237 | 1 |
| B | 0 | 6512 | 1 |
| C | 0 | 6894 | 1 |
| D | 0 | 7330 | 1 |
| Mode M9 | |||
|---|---|---|---|
| Quadrant | BADHDUFLAG | Total packets | Discarded packets |
| A | 0 | 14 | 0 |
| B | 0 | 14 | 0 |
| C | 0 | 14 | 0 |
| D | 0 | 14 | 0 |
| Mode SS | |||
|---|---|---|---|
| Quadrant | BADHDUFLAG | Total packets | Discarded packets |
| A | 0 | 54 | 0 |
| B | 0 | 54 | 0 |
| C | 0 | 54 | 0 |
| D | 0 | 54 | 0 |
| Quadrant | Total seconds | Saturated seconds | Saturation percentage |
|---|---|---|---|
| A | 2593 | 84 | 3.239491% |
| B | 2593 | 101 | 3.895102% |
| C | 2593 | 151 | 5.823371% |
| D | 2593 | 92 | 3.548014% |
Noise dominated data is calculated using 1-second bins in cleaned event files. If a bin has >2000 counts, and if more than 50% of those come from <1% of pixels, then it is considered to be noise-dominated and hence unusable.
| Quadrant | # 1 sec bins | Bins with >0 counts | Bins with >2000 counts | High rate bins dominated by noise | Noise dominated (total time) | Noise dominated (detector-on time) | Marked lightcurve |
|---|---|---|---|---|---|---|---|
| A | 3948 | 2594 | 0 | 0 | 0.00% | 0.00% | 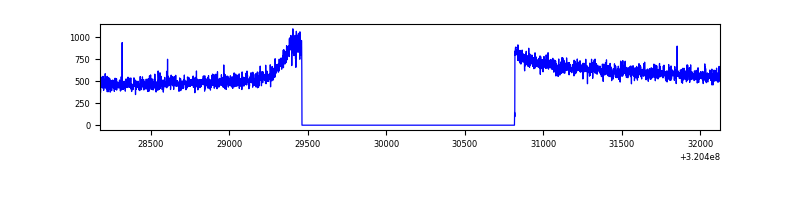 |
| B | 3948 | 2594 | 0 | 0 | 0.00% | 0.00% | 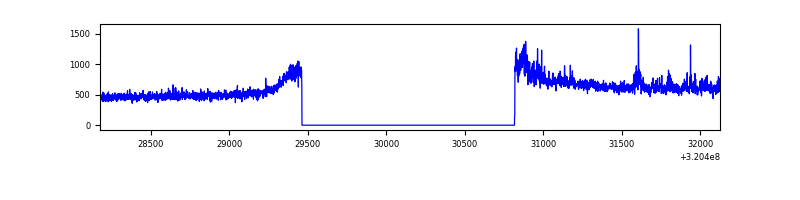 |
| C | 3948 | 2594 | 12 | 12 | 0.30% | 0.46% | 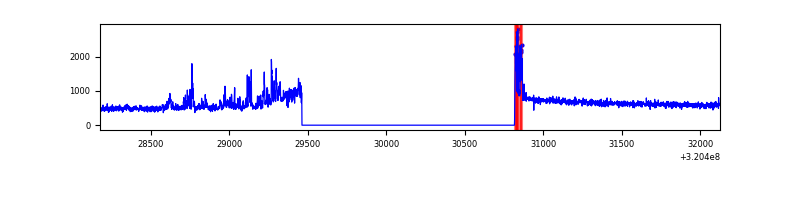 |
| D | 3948 | 2594 | 4 | 4 | 0.10% | 0.15% | 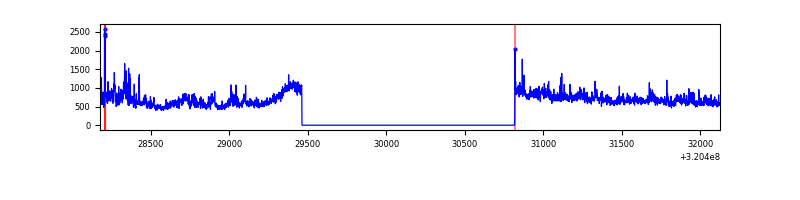 |
Top three noisy pixels from each quadrant. If the there are fewer than three noisy pixels in the level2.evt file, extra rows are filled as -1
| Pixel properties | Quadrant properties | ||||||
|---|---|---|---|---|---|---|---|
| Quadrant | DetID | PixID | Counts | Sigma | Mean | Median | Sigma |
| A | 13 | 254 | 4015 | 45.87 | 389 | 381 | 79.2 |
| A | 0 | 226 | 3618 | 40.86 | 389 | 381 | 79.2 |
| A | 3 | 137 | 3236 | 36.04 | 389 | 381 | 79.2 |
| B | 0 | 189 | 69132 | 919.52 | 385 | 377 | 74.8 |
| B | 12 | 111 | 8421 | 107.58 | 385 | 377 | 74.8 |
| B | 11 | 111 | 7309 | 92.71 | 385 | 377 | 74.8 |
| C | 7 | 247 | 137429 | 1565.33 | 368 | 371 | 87.6 |
| C | 14 | 238 | 59544 | 675.81 | 368 | 371 | 87.6 |
| C | 0 | 10 | 52801 | 598.8 | 368 | 371 | 87.6 |
| D | 8 | 195 | 292251 | 3136.67 | 381 | 369 | 93.1 |
| D | 9 | 35 | 49235 | 525.13 | 381 | 369 | 93.1 |
| D | 1 | 52 | 19456 | 205.11 | 381 | 369 | 93.1 |
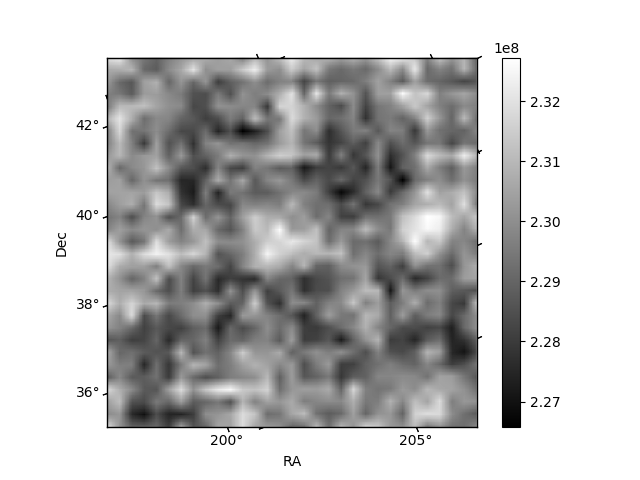
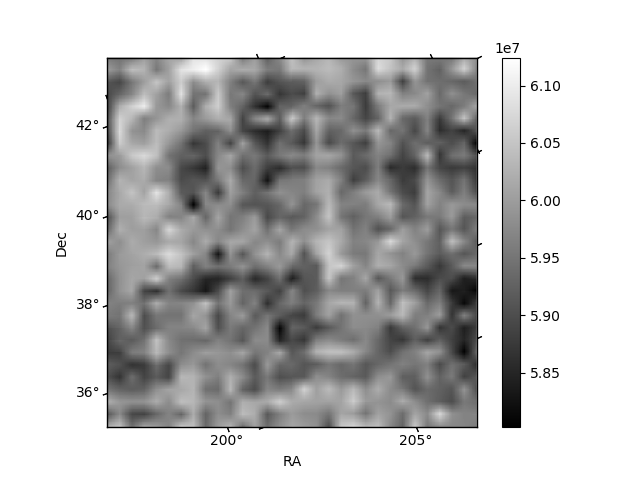
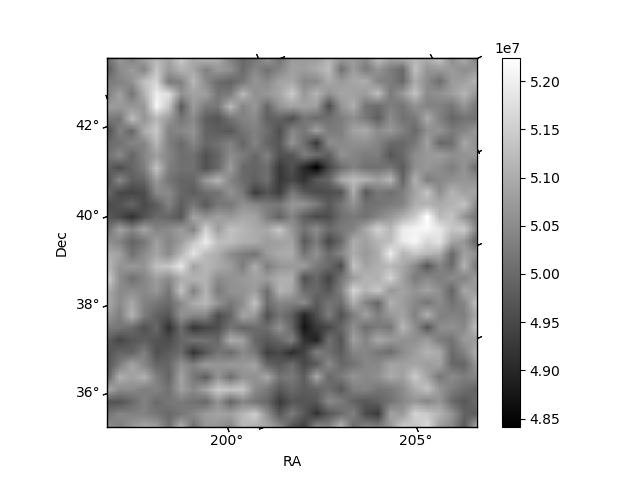
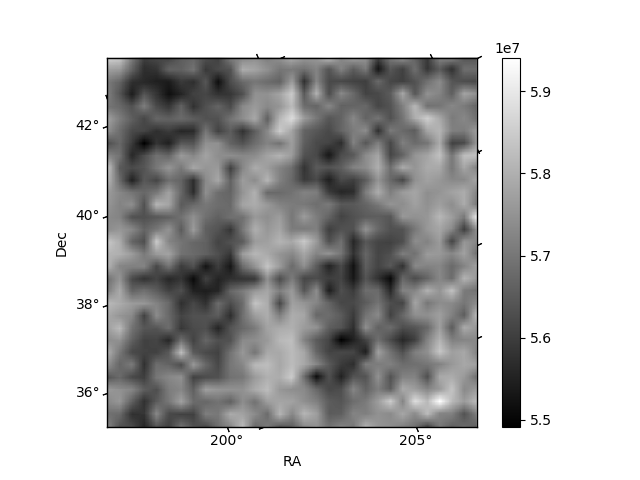
Histogram calculated using DETX and DETY for each event in the final _common_clean file
| Quadrant A | 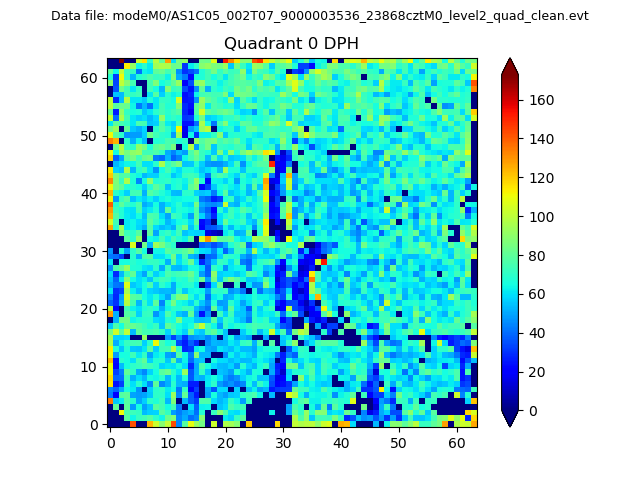 |
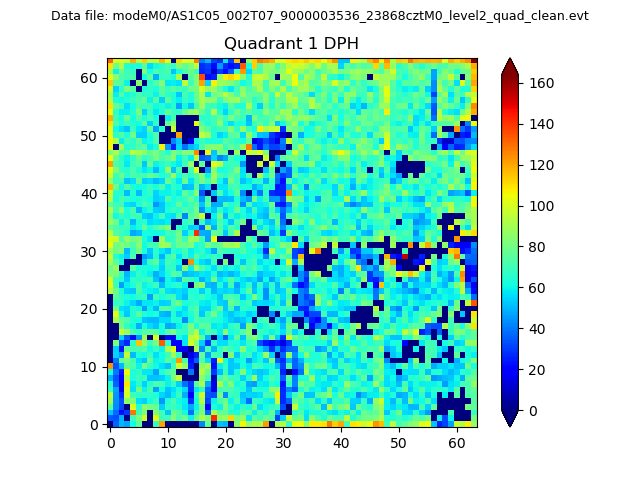 |
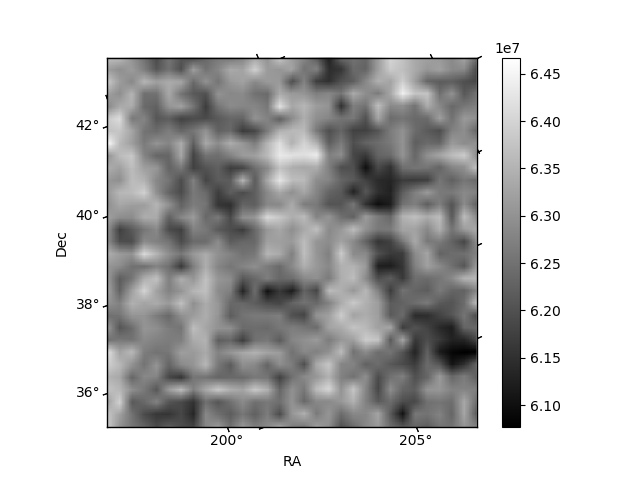
Quadrant B |
|---|---|---|---|
| Quadrant D | 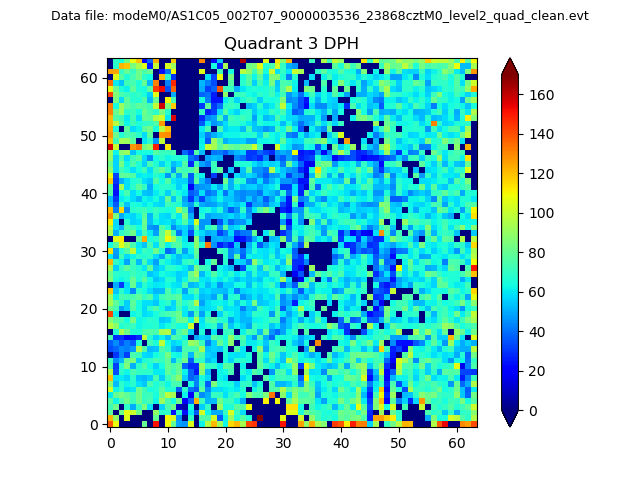 |
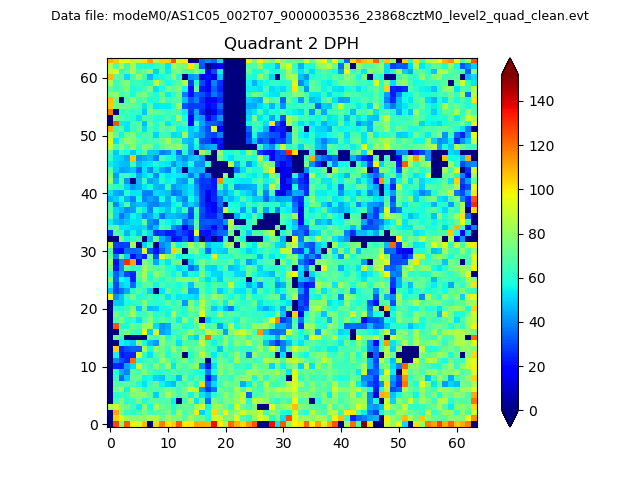 |
Quadrant C |
| Plot type | Count rate plots | Images |
|---|---|---|
| Comparison with Poisson distribution Blue bars denote a histogram of data divided into 1 sec bins. Red curve is a Poisson curve with rate = median count rate of data. |
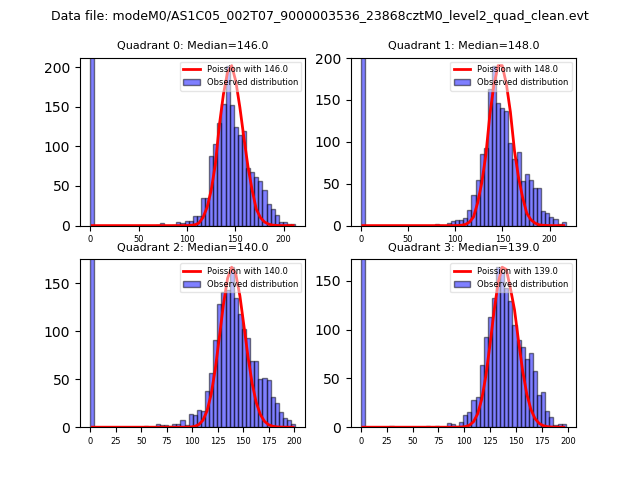 |
 |
| Quadrant-wise count rates Data is divided into 100 sec bins |
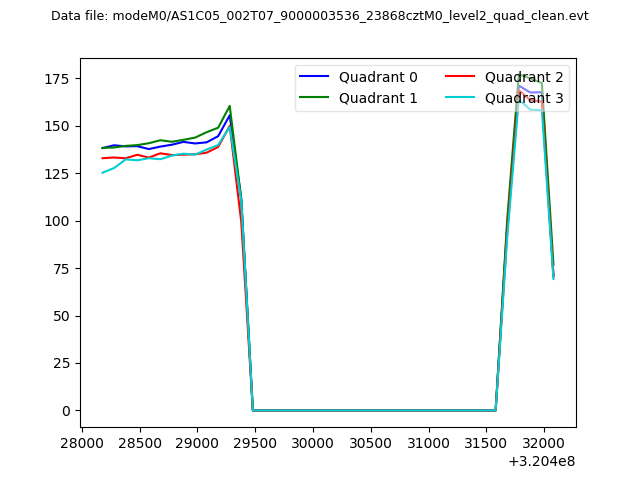 |
|
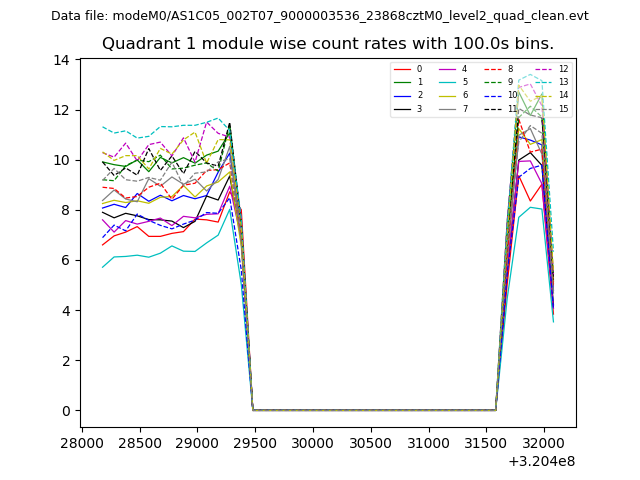
| Module-wise count rates for Quadrant A Data is divided into 100 sec bins |
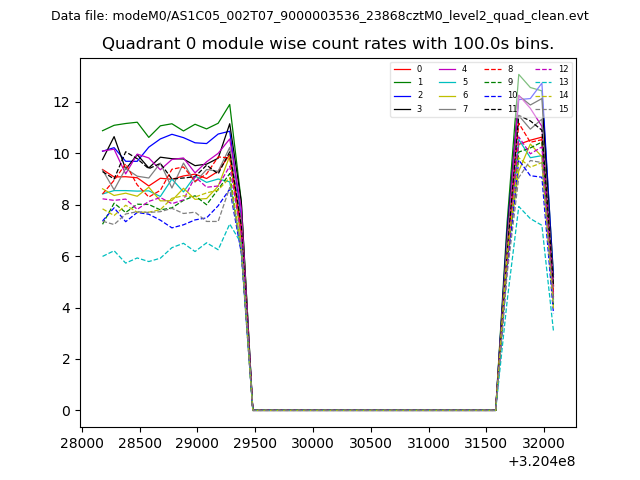 |
 |
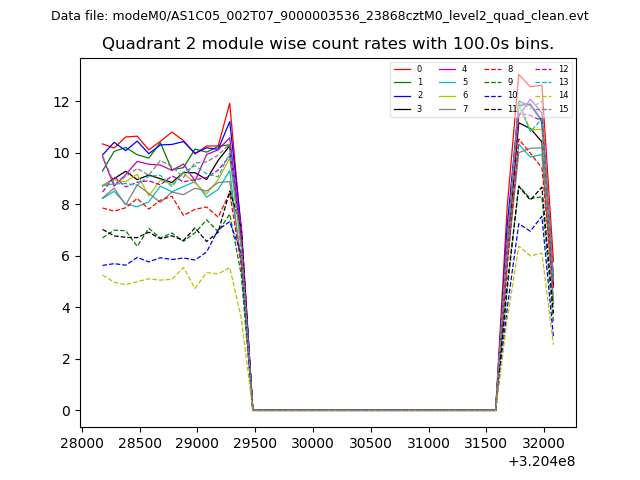
| Module-wise count rates for Quadrant B Data is divided into 100 sec bins |
 |
 |
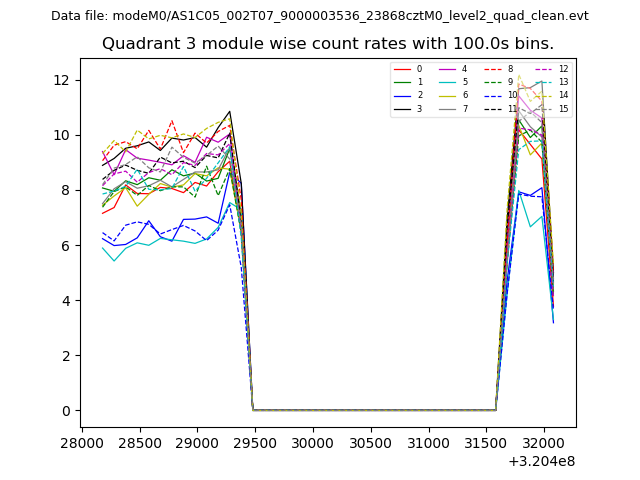
| Module-wise count rates for Quadrant C Data is divided into 100 sec bins |
 |
 |
| Module-wise count rates for Quadrant D Data is divided into 100 sec bins |
 |
 |
| Parameter | Plot |
|---|---|
| CZT HV Monitor | 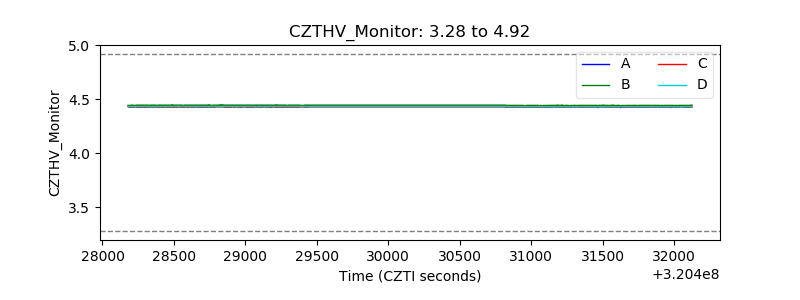 |
| D_VDD | 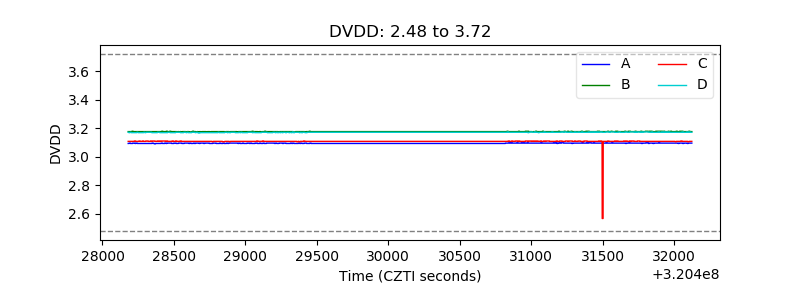 |
| Temperature 1 | 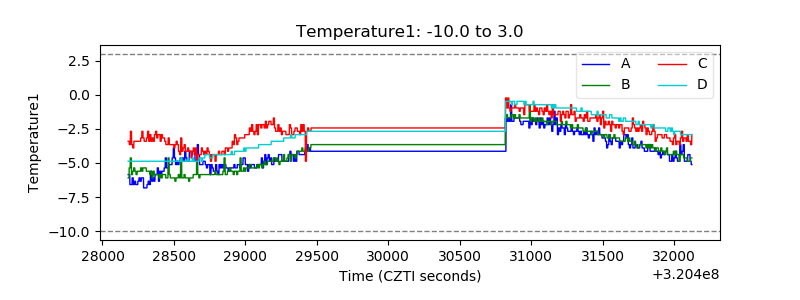 |
| Veto HV Monitor | 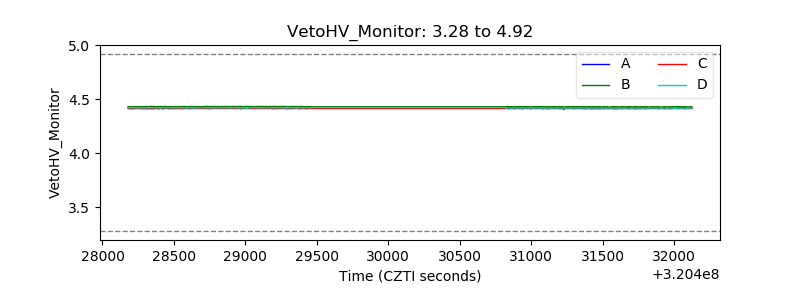 |
| Veto LLD | 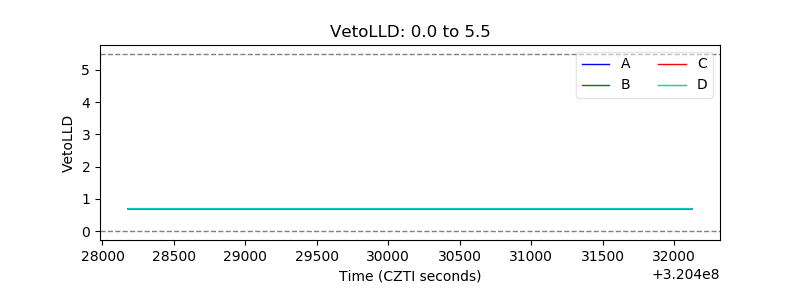 |
| Alpha Counter | 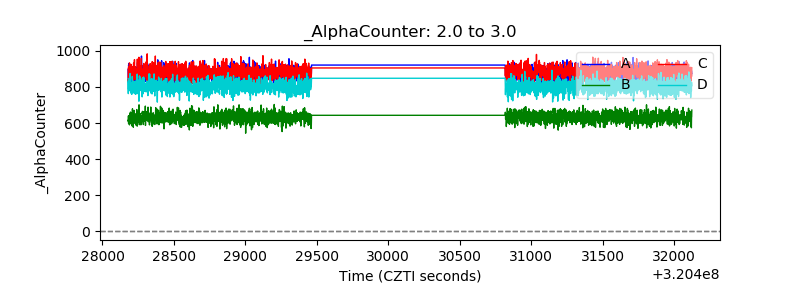 |
| _CPM_Rate | 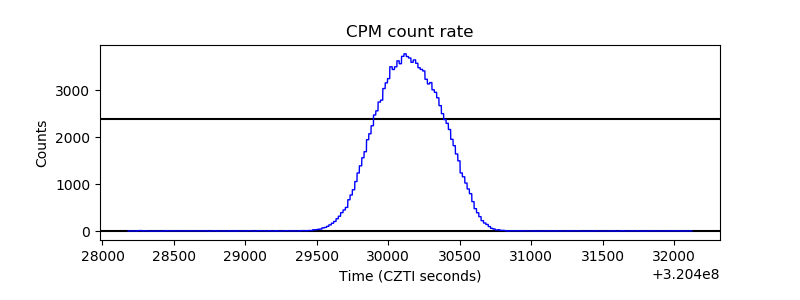 |
| CZT Counter | 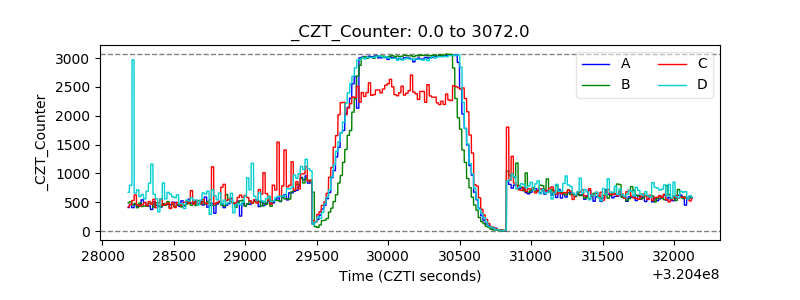 |
| +2.5 Volts monitor | 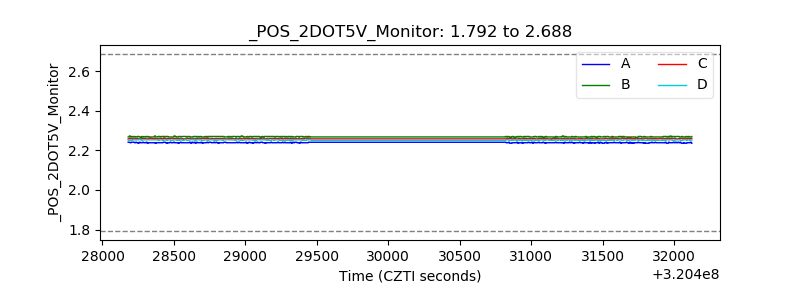 |
| +5 Volts monitor |  |
| _ROLL_ROT | 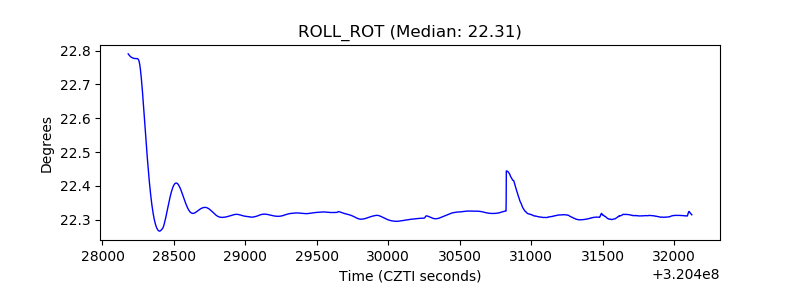 |
| _Roll_DEC |  |
| _Roll_RA | 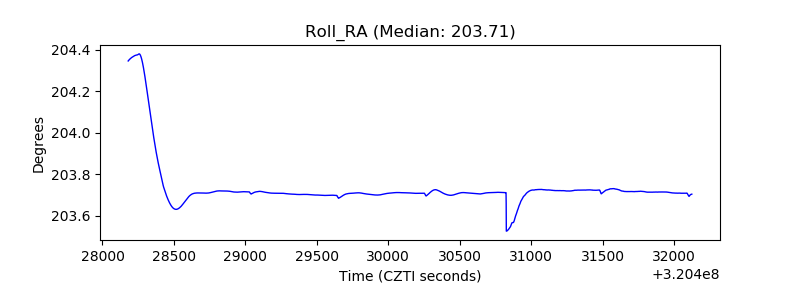 |
| Veto Counter | 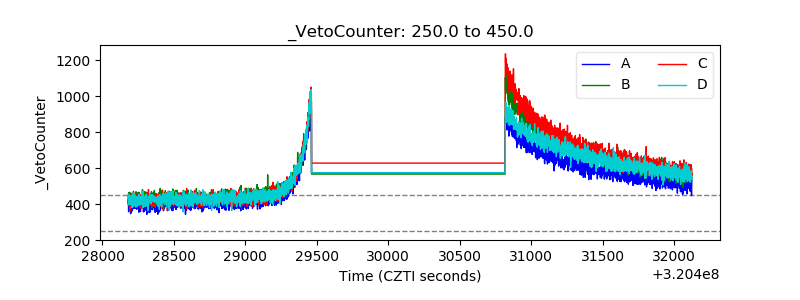 |