| Param | Original file | Final file |
|---|---|---|
| Filename | modeM0/AS1A07_142T01_9000003540cztM0_level2.fits | modeM0/AS1A07_142T01_9000003540cztM0_level2_quad_clean.evt |
| Size (bytes) | 2,871,417,600 | 2,424,594,240 |
| Size | 2.7 GB | 2.3 GB |
| Events in quadrant A | 18,262,591 | 14,346,012 |
| Events in quadrant B | 17,294,756 | 14,325,296 |
| Events in quadrant C | 17,271,700 | 13,381,975 |
| Events in quadrant D | 14,728,939 | 11,976,269 |
| Mode M9 | |||
|---|---|---|---|
| Quadrant | BADHDUFLAG | Total packets | Discarded packets |
| A | 0 | 465 | 0 |
| B | 0 | 464 | 0 |
| C | 0 | 466 | 0 |
| D | 0 | 465 | 0 |
| Mode M0 | |||
|---|---|---|---|
| Quadrant | BADHDUFLAG | Total packets | Discarded packets |
| A | 0 | 594693 | 0 |
| B | 0 | 609745 | 0 |
| C | 0 | 620951 | 0 |
| D | 0 | 832958 | 0 |
| Mode SS | |||
|---|---|---|---|
| Quadrant | BADHDUFLAG | Total packets | Discarded packets |
| A | 0 | 5792 | 0 |
| B | 0 | 5789 | 0 |
| C | 0 | 5788 | 0 |
| D | 0 | 5787 | 0 |
| Quadrant | Total seconds | Saturated seconds | Saturation percentage |
|---|---|---|---|
| A | 283197 | 2957 | 1.044149% |
| B | 283209 | 4190 | 1.479473% |
| C | 283187 | 6945 | 2.452443% |
| D | 283003 | 19421 | 6.862471% |
Noise dominated data is calculated using 1-second bins in cleaned event files. If a bin has >2000 counts, and if more than 50% of those come from <1% of pixels, then it is considered to be noise-dominated and hence unusable.
| Quadrant | # 1 sec bins | Bins with >0 counts | Bins with >2000 counts | High rate bins dominated by noise | Noise dominated (total time) | Noise dominated (detector-on time) | Marked lightcurve |
|---|---|---|---|---|---|---|---|
| A | 345369 | 283683 | 0 | 0 | 0.00% | 0.00% |  |
| B | 345369 | 283714 | 0 | 0 | 0.00% | 0.00% |  |
| C | 345369 | 283713 | 0 | 0 | 0.00% | 0.00% | 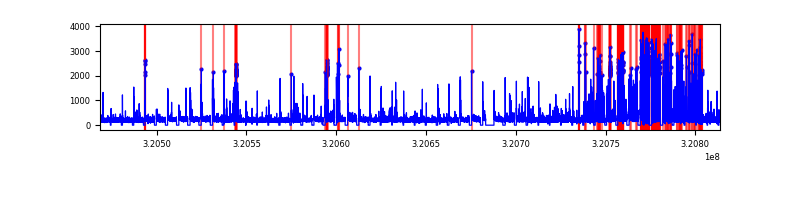 |
| D | 345369 | 282369 | 0 | 0 | 0.00% | 0.00% | 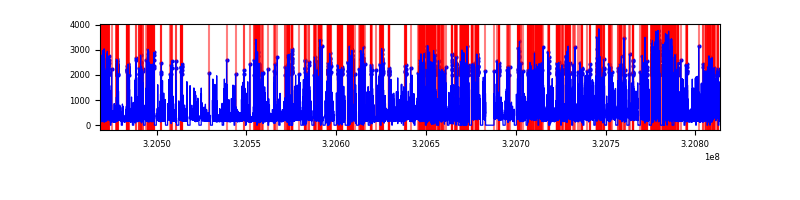 |
Top three noisy pixels from each quadrant. If the there are fewer than three noisy pixels in the level2.evt file, extra rows are filled as -1
| Pixel properties | Quadrant properties | ||||||
|---|---|---|---|---|---|---|---|
| Quadrant | DetID | PixID | Counts | Sigma | Mean | Median | Sigma |
| A | 0 | 29 | 17392 | 11.22 | 4755 | 4480 | 1150.8 |
| A | 7 | 110 | 14575 | 8.77 | 4755 | 4480 | 1150.8 |
| A | 0 | 30 | 13737 | 8.04 | 4755 | 4480 | 1150.8 |
| B | 2 | 9 | 13851 | 10.69 | 4579 | 4386 | 885.2 |
| B | 2 | 8 | 11620 | 8.17 | 4579 | 4386 | 885.2 |
| B | 3 | 17 | 11333 | 7.85 | 4579 | 4386 | 885.2 |
| C | 3 | 126 | 11798 | 6.54 | 4563 | 4276 | 1149.3 |
| C | 12 | 241 | 11758 | 6.51 | 4563 | 4276 | 1149.3 |
| C | 9 | 209 | 11509 | 6.29 | 4563 | 4276 | 1149.3 |
| D | 3 | 14 | 10740 | 6.25 | 4208 | 3834 | 1105.7 |
| D | 6 | 231 | 10484 | 6.01 | 4208 | 3834 | 1105.7 |
| D | 15 | 46 | 10483 | 6.01 | 4208 | 3834 | 1105.7 |
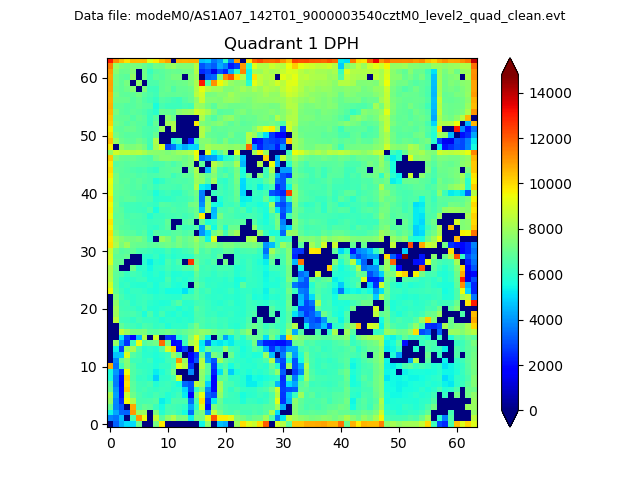
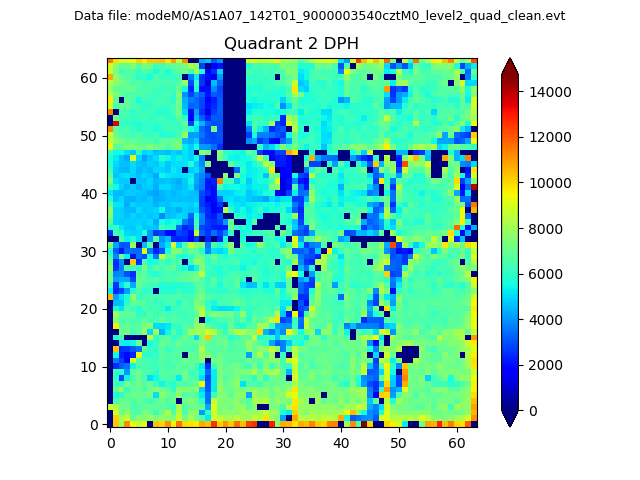
Histogram calculated using DETX and DETY for each event in the final _common_clean file
| Quadrant A |  |
 |
Quadrant B |
|---|---|---|---|
| Quadrant D | 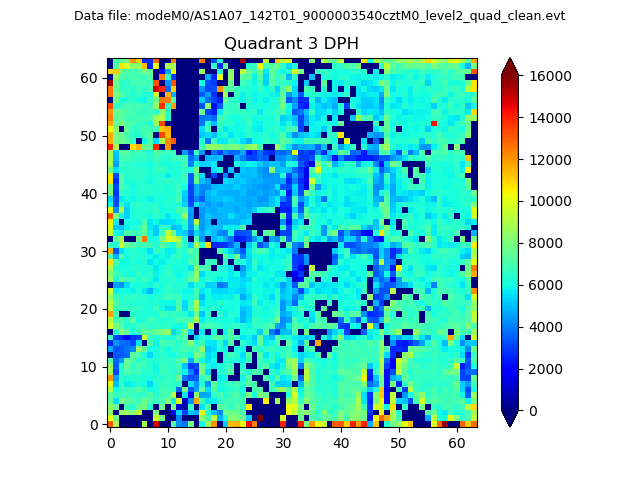 |
 |
Quadrant C |
| Plot type | Count rate plots | Images |
|---|---|---|
| Comparison with Poisson distribution Blue bars denote a histogram of data divided into 1 sec bins. Red curve is a Poisson curve with rate = median count rate of data. |
 |
 |
| Quadrant-wise count rates Data is divided into 100 sec bins |
 |
|
| Module-wise count rates for Quadrant A Data is divided into 100 sec bins |
 |
 |
| Module-wise count rates for Quadrant B Data is divided into 100 sec bins |
 |
 |
| Module-wise count rates for Quadrant C Data is divided into 100 sec bins |
 |
 |
| Module-wise count rates for Quadrant D Data is divided into 100 sec bins |
 |
 |
| Parameter | Plot |
|---|---|
| CZT HV Monitor | 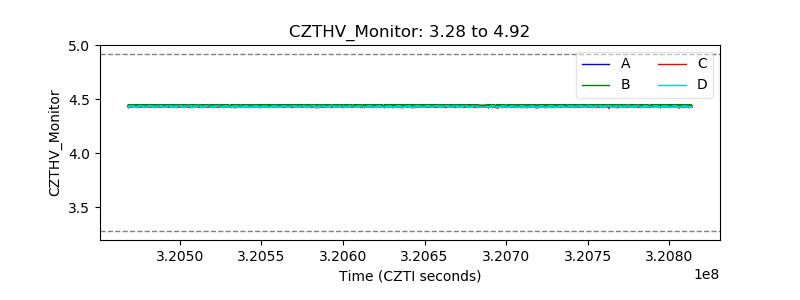 |
| D_VDD | 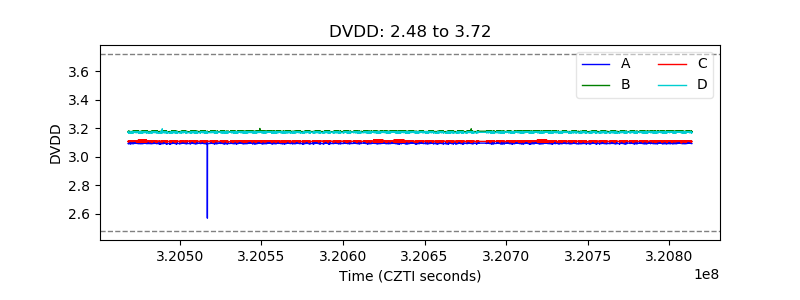 |
| Temperature 1 | 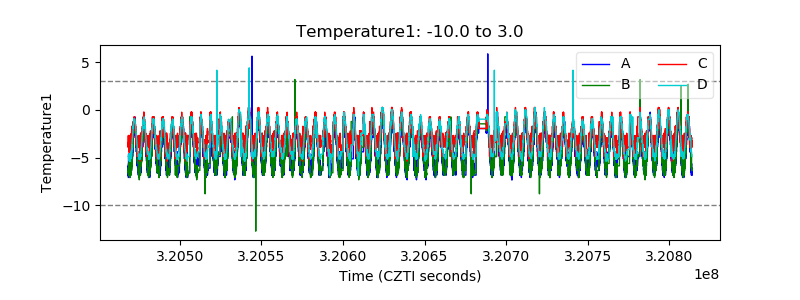 |
| Veto HV Monitor |  |
| Veto LLD |  |
| Alpha Counter | 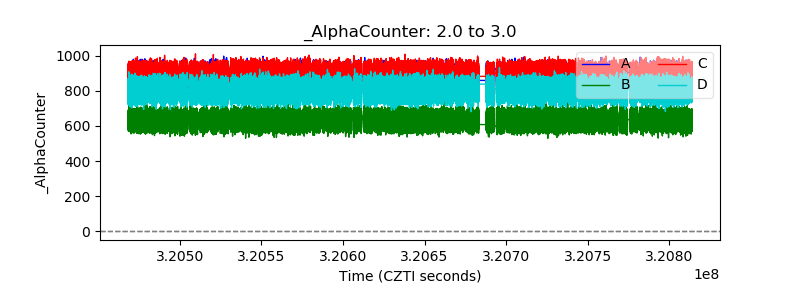 |
| _CPM_Rate | 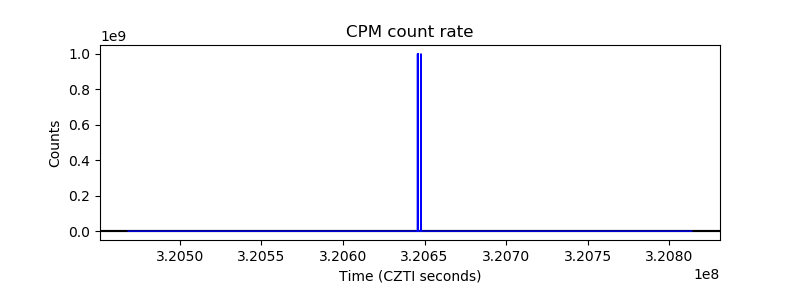 |
| CZT Counter |  |
| +2.5 Volts monitor |  |
| +5 Volts monitor |  |
| _ROLL_ROT | 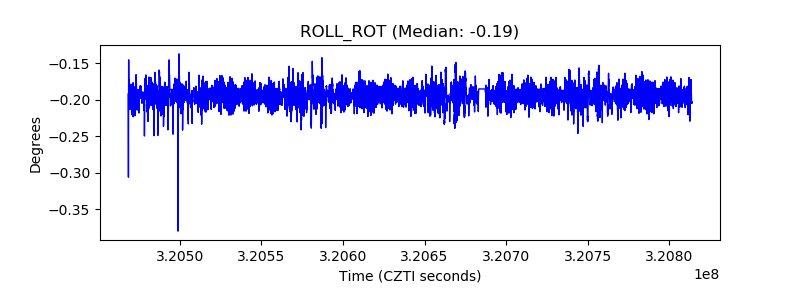 |
| _Roll_DEC |  |
| _Roll_RA |  |
| Veto Counter |  |