| Param | Original file | Final file |
|---|---|---|
| Filename | modeM0/AS1A07_142T01_9000003540_23874cztM0_level2.evt | modeM0/AS1A07_142T01_9000003540_23874cztM0_level2_quad_clean.evt |
| Size (bytes) | 95,924,160 | 26,974,080 |
| Size | 91.5 MB | 25.7 MB |
| Events in quadrant A | 632,573 | 180,372 |
| Events in quadrant B | 668,511 | 184,252 |
| Events in quadrant C | 659,984 | 175,627 |
| Events in quadrant D | 843,718 | 169,749 |
| Mode M0 | |||
|---|---|---|---|
| Quadrant | BADHDUFLAG | Total packets | Discarded packets |
| A | 0 | 2868 | 0 |
| B | 0 | 2900 | 0 |
| C | 0 | 2868 | 0 |
| D | 0 | 3431 | 0 |
| Mode SS | |||
|---|---|---|---|
| Quadrant | BADHDUFLAG | Total packets | Discarded packets |
| A | 0 | 28 | 0 |
| B | 0 | 28 | 0 |
| C | 0 | 28 | 0 |
| D | 0 | 28 | 0 |
| Quadrant | Total seconds | Saturated seconds | Saturation percentage |
|---|---|---|---|
| A | 1431 | 0 | 0.000000% |
| B | 1431 | 1 | 0.069881% |
| C | 1431 | 6 | 0.419287% |
| D | 1431 | 28 | 1.956674% |
Noise dominated data is calculated using 1-second bins in cleaned event files. If a bin has >2000 counts, and if more than 50% of those come from <1% of pixels, then it is considered to be noise-dominated and hence unusable.
| Quadrant | # 1 sec bins | Bins with >0 counts | Bins with >2000 counts | High rate bins dominated by noise | Noise dominated (total time) | Noise dominated (detector-on time) | Marked lightcurve |
|---|---|---|---|---|---|---|---|
| A | 1431 | 1431 | 0 | 0 | 0.00% | 0.00% | 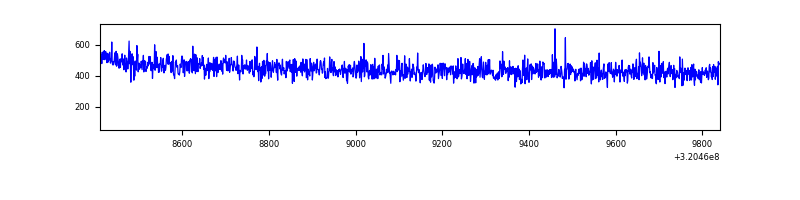 |
| B | 1431 | 1431 | 0 | 0 | 0.00% | 0.00% | 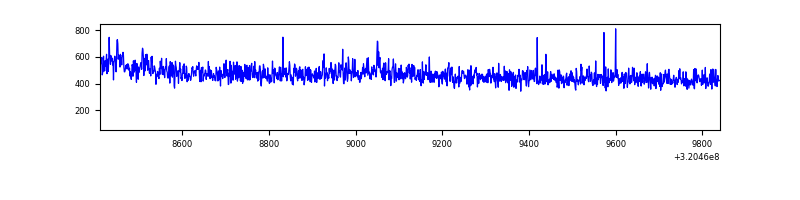 |
| C | 1431 | 1431 | 0 | 0 | 0.00% | 0.00% | 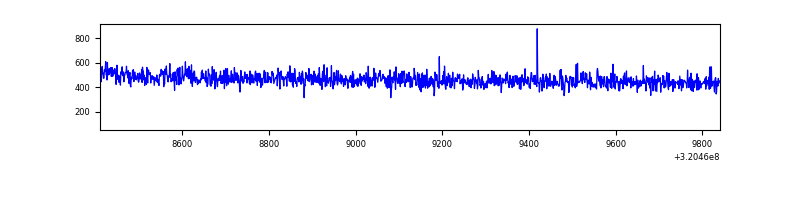 |
| D | 1431 | 1431 | 36 | 36 | 2.52% | 2.52% | 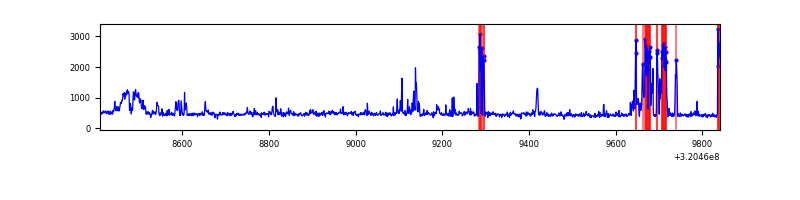 |
Top three noisy pixels from each quadrant. If the there are fewer than three noisy pixels in the level2.evt file, extra rows are filled as -1
| Pixel properties | Quadrant properties | ||||||
|---|---|---|---|---|---|---|---|
| Quadrant | DetID | PixID | Counts | Sigma | Mean | Median | Sigma |
| A | 13 | 254 | 2305 | 60.75 | 163 | 160 | 35.3 |
| A | 3 | 137 | 1539 | 39.06 | 163 | 160 | 35.3 |
| A | 0 | 226 | 1366 | 34.16 | 163 | 160 | 35.3 |
| B | 0 | 189 | 10414 | 296.98 | 166 | 161 | 34.5 |
| B | 12 | 111 | 3958 | 109.98 | 166 | 161 | 34.5 |
| B | 11 | 111 | 3413 | 94.2 | 166 | 161 | 34.5 |
| C | 14 | 238 | 25143 | 614.16 | 162 | 163 | 40.7 |
| C | 13 | 61 | 1094 | 22.89 | 162 | 163 | 40.7 |
| C | 0 | 10 | 560 | 9.76 | 162 | 163 | 40.7 |
| D | 1 | 52 | 163889 | 3945.01 | 159 | 154 | 41.5 |
| D | 8 | 195 | 36300 | 870.9 | 159 | 154 | 41.5 |
| D | 7 | 238 | 33034 | 792.21 | 159 | 154 | 41.5 |
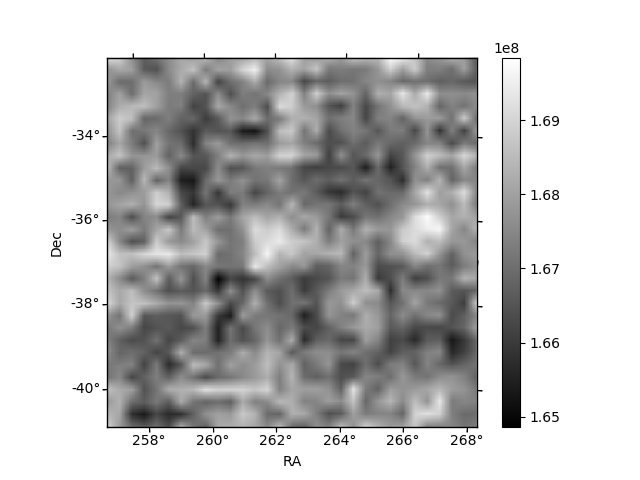
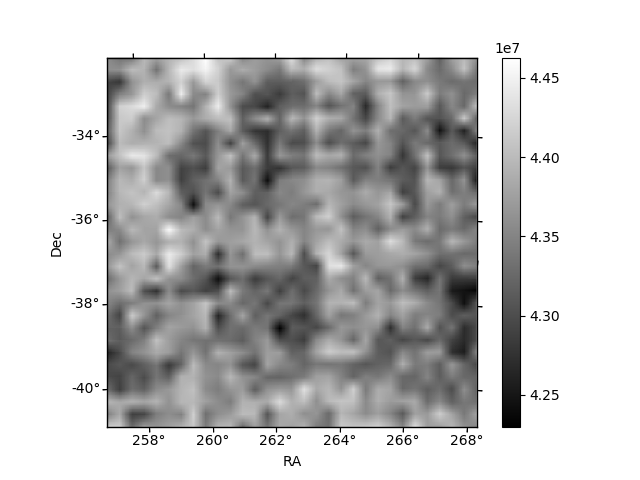
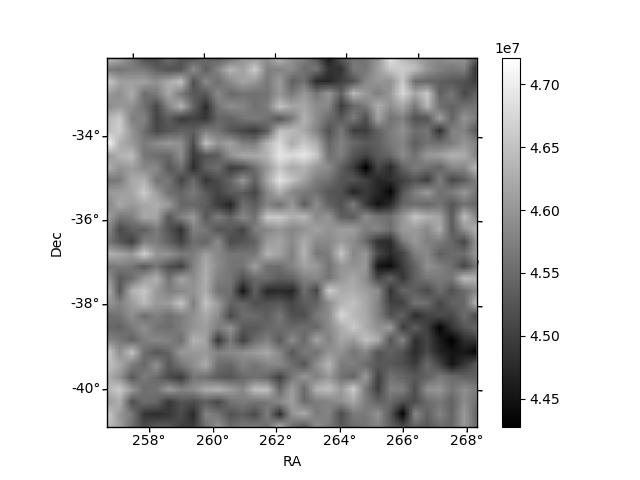
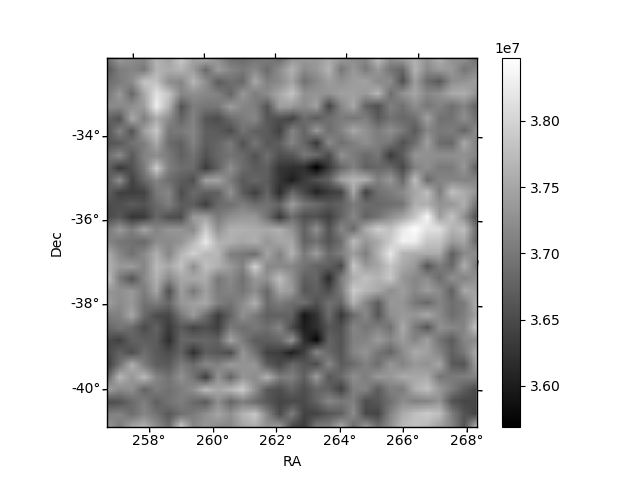
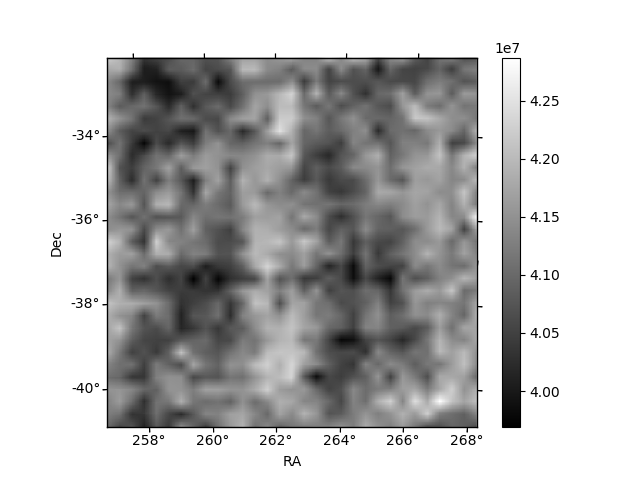
Histogram calculated using DETX and DETY for each event in the final _common_clean file
| Quadrant A | 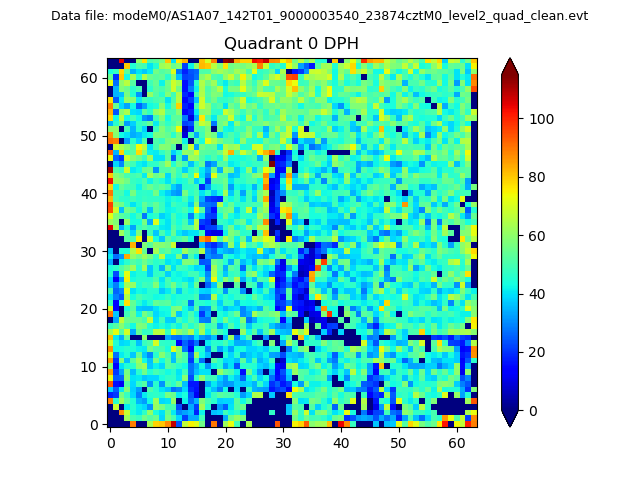 |
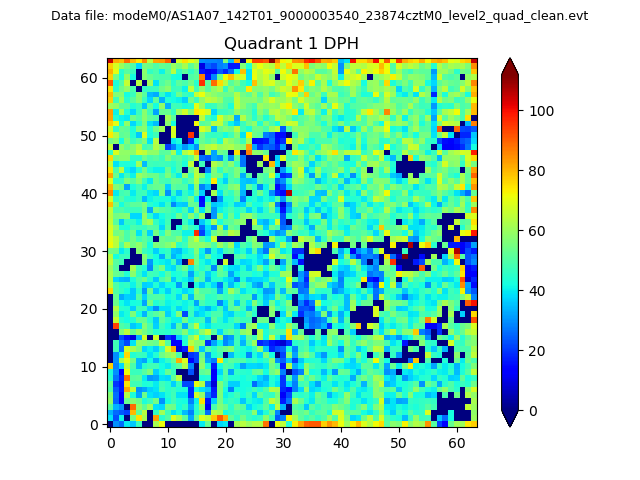 |
Quadrant B |
|---|---|---|---|
| Quadrant D | 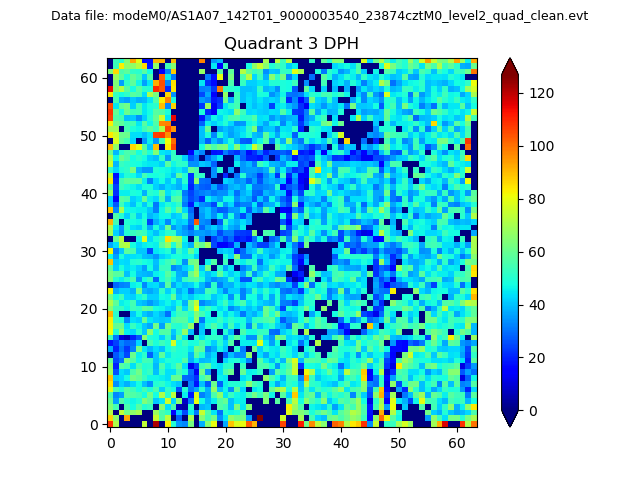 |
 |
Quadrant C |
| Plot type | Count rate plots | Images |
|---|---|---|
| Comparison with Poisson distribution Blue bars denote a histogram of data divided into 1 sec bins. Red curve is a Poisson curve with rate = median count rate of data. |
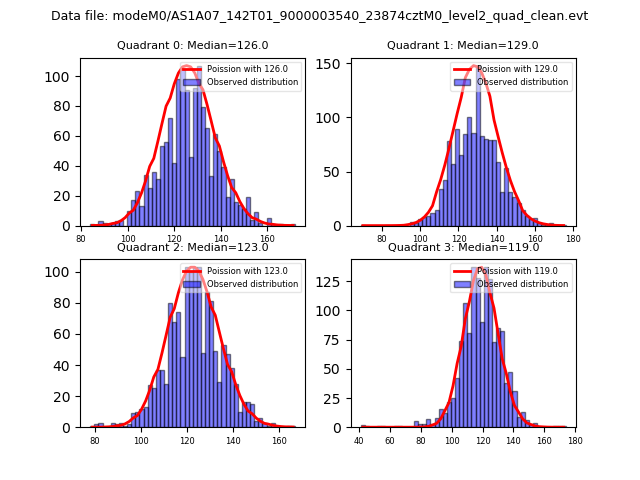 |
 |
| Quadrant-wise count rates Data is divided into 100 sec bins |
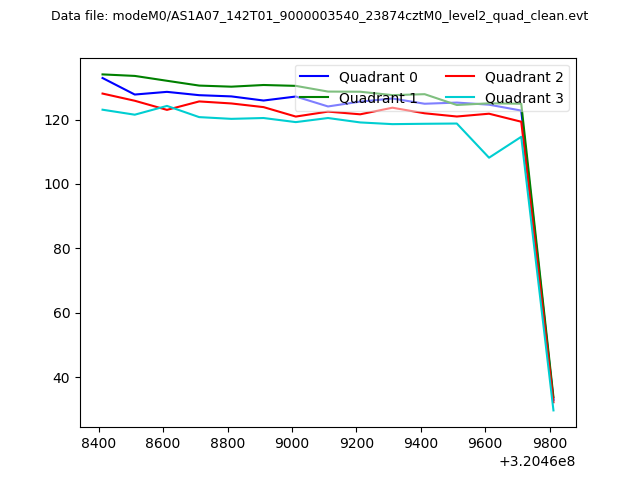 |
|
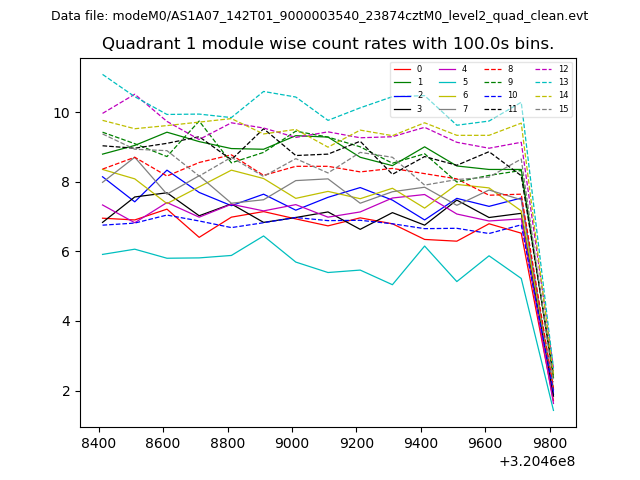
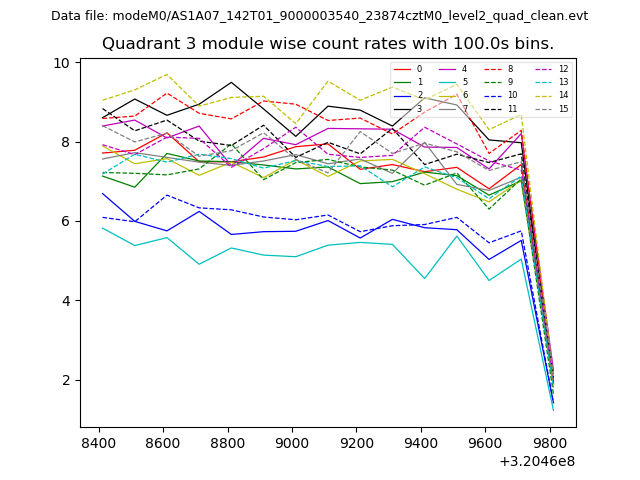
| Module-wise count rates for Quadrant A Data is divided into 100 sec bins |
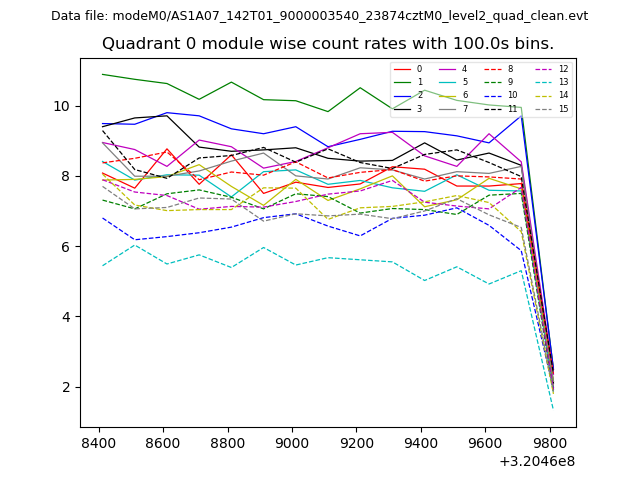 |
 |
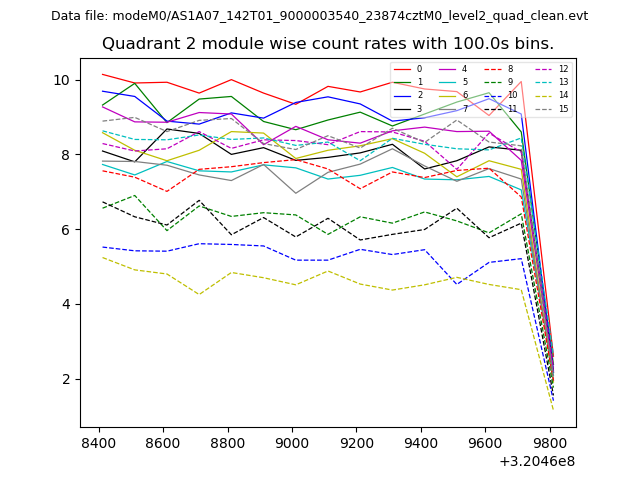
| Module-wise count rates for Quadrant B Data is divided into 100 sec bins |
 |
 |
| Module-wise count rates for Quadrant C Data is divided into 100 sec bins |
 |
 |
| Module-wise count rates for Quadrant D Data is divided into 100 sec bins |
 |
 |
| Parameter | Plot |
|---|---|
| CZT HV Monitor | 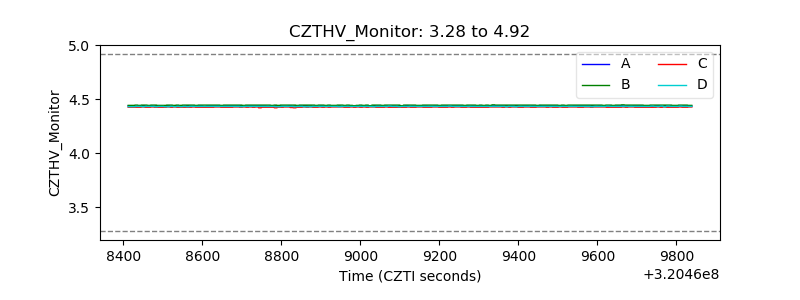 |
| D_VDD | 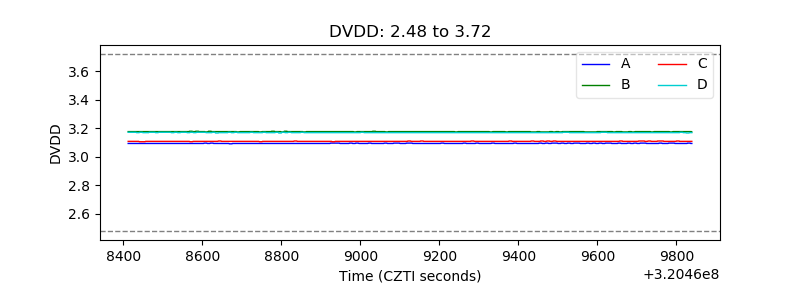 |
| Temperature 1 | 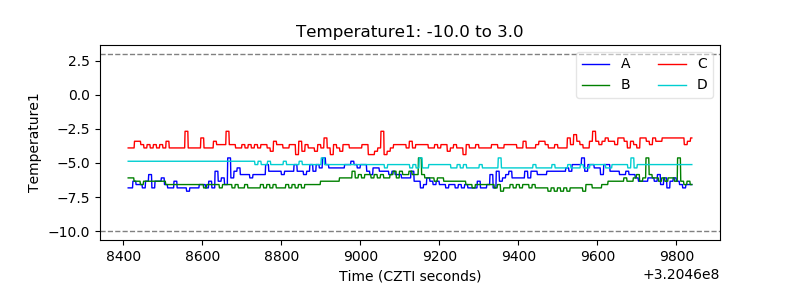 |
| Veto HV Monitor | 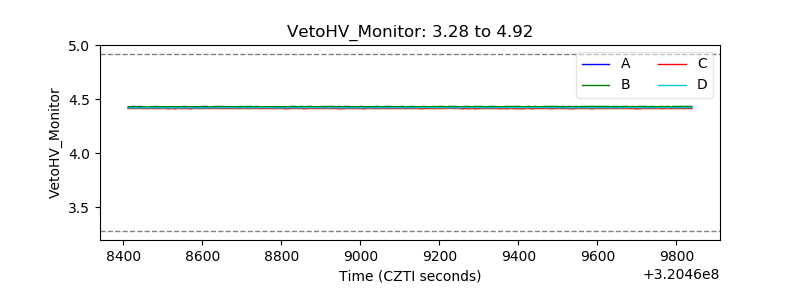 |
| Veto LLD | 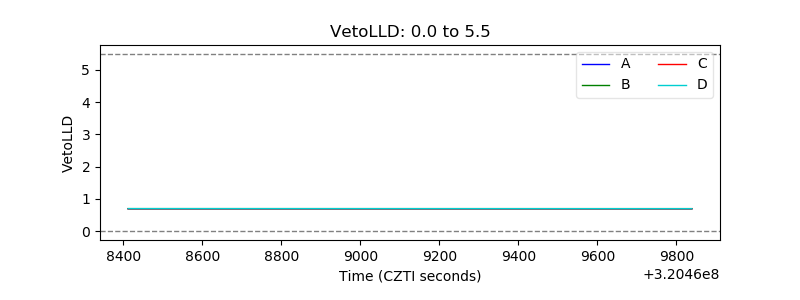 |
| Alpha Counter | 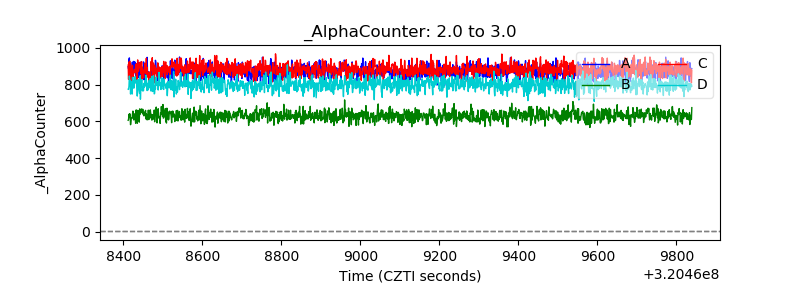 |
| _CPM_Rate | 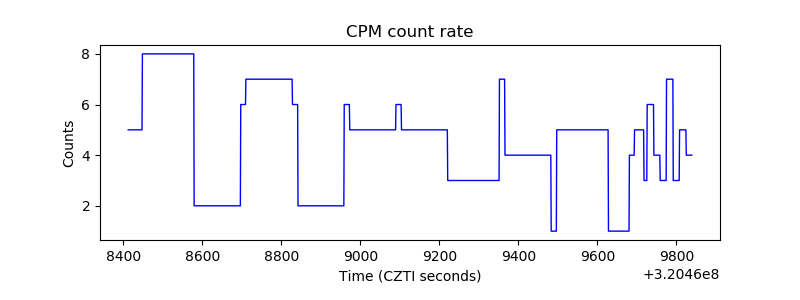 |
| CZT Counter | 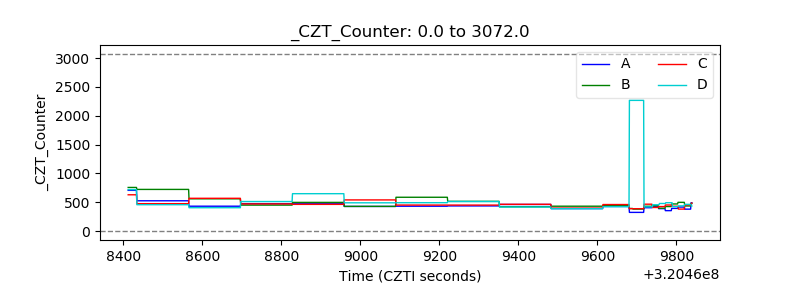 |
| +2.5 Volts monitor |  |
| +5 Volts monitor |  |
| _ROLL_ROT | 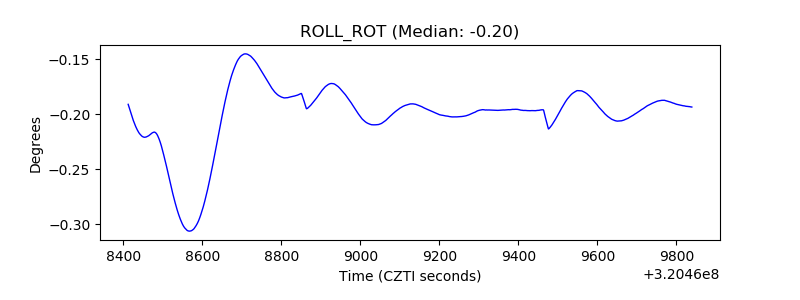 |
| _Roll_DEC |  |
| _Roll_RA | 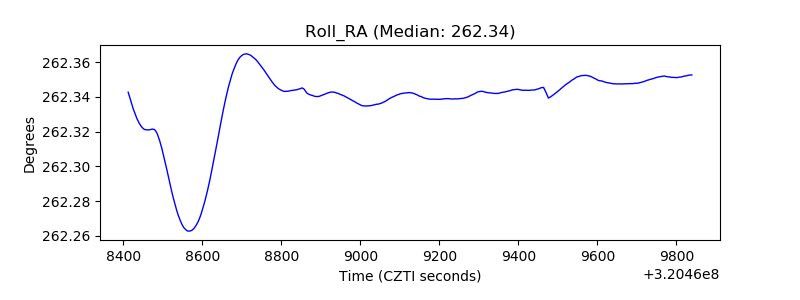 |
| Veto Counter | 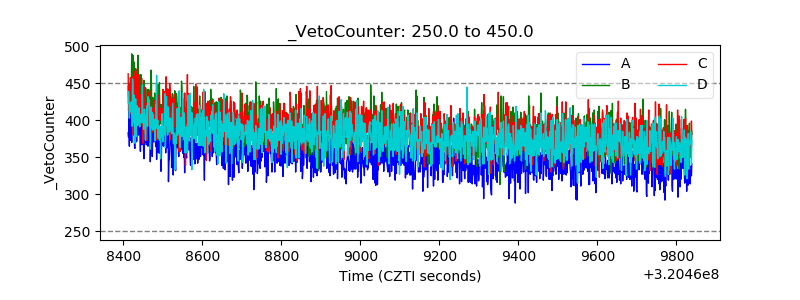 |