| Param | Original file | Final file |
|---|---|---|
| Filename | modeM0/AS1A07_142T01_9000003540_23880cztM0_level2.evt | modeM0/AS1A07_142T01_9000003540_23880cztM0_level2_quad_clean.evt |
| Size (bytes) | 1,102,691,520 | 189,866,880 |
| Size | 1.0 GB | 181.1 MB |
| Events in quadrant A | 7,539,753 | 1,192,082 |
| Events in quadrant B | 7,833,917 | 1,206,961 |
| Events in quadrant C | 7,651,981 | 1,149,865 |
| Events in quadrant D | 9,315,763 | 1,126,424 |
| Mode M9 | |||
|---|---|---|---|
| Quadrant | BADHDUFLAG | Total packets | Discarded packets |
| A | 0 | 28 | 0 |
| B | 0 | 28 | 0 |
| C | 0 | 28 | 0 |
| D | 0 | 28 | 0 |
| Mode M0 | |||
|---|---|---|---|
| Quadrant | BADHDUFLAG | Total packets | Discarded packets |
| A | 0 | 32185 | 3 |
| B | 0 | 32816 | 3 |
| C | 0 | 32374 | 3 |
| D | 0 | 37671 | 3 |
| Mode SS | |||
|---|---|---|---|
| Quadrant | BADHDUFLAG | Total packets | Discarded packets |
| A | 0 | 318 | 0 |
| B | 0 | 318 | 0 |
| C | 0 | 318 | 0 |
| D | 0 | 318 | 0 |
| Quadrant | Total seconds | Saturated seconds | Saturation percentage |
|---|---|---|---|
| A | 15579 | 135 | 0.866551% |
| B | 15580 | 139 | 0.892169% |
| C | 15580 | 231 | 1.482670% |
| D | 15579 | 393 | 2.522627% |
Noise dominated data is calculated using 1-second bins in cleaned event files. If a bin has >2000 counts, and if more than 50% of those come from <1% of pixels, then it is considered to be noise-dominated and hence unusable.
| Quadrant | # 1 sec bins | Bins with >0 counts | Bins with >2000 counts | High rate bins dominated by noise | Noise dominated (total time) | Noise dominated (detector-on time) | Marked lightcurve |
|---|---|---|---|---|---|---|---|
| A | 18384 | 15582 | 0 | 0 | 0.00% | 0.00% | 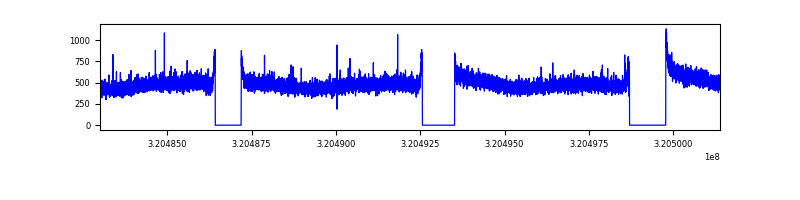 |
| B | 18385 | 15583 | 5 | 5 | 0.03% | 0.03% | 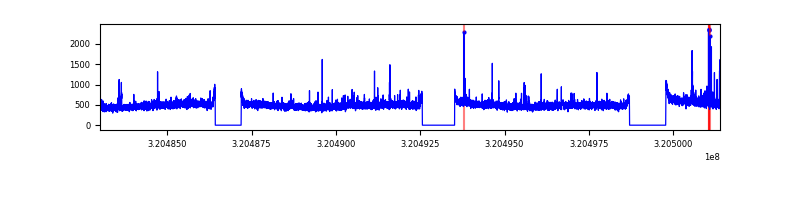 |
| C | 18385 | 15583 | 8 | 8 | 0.04% | 0.05% | 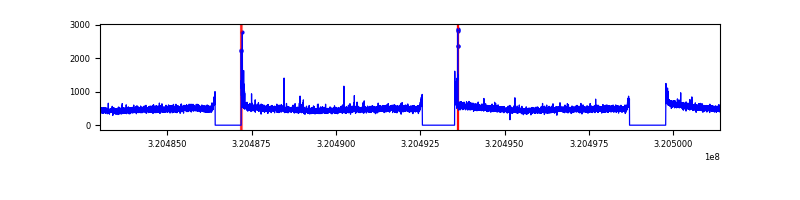 |
| D | 18384 | 15582 | 243 | 243 | 1.32% | 1.56% | 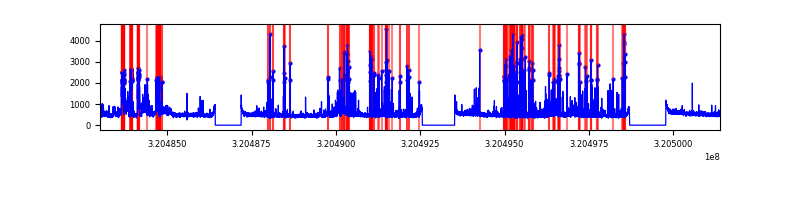 |
Top three noisy pixels from each quadrant. If the there are fewer than three noisy pixels in the level2.evt file, extra rows are filled as -1
| Pixel properties | Quadrant properties | ||||||
|---|---|---|---|---|---|---|---|
| Quadrant | DetID | PixID | Counts | Sigma | Mean | Median | Sigma |
| A | 13 | 254 | 26335 | 62.55 | 1953 | 1910 | 390.5 |
| A | 0 | 226 | 17117 | 38.95 | 1953 | 1910 | 390.5 |
| A | 3 | 137 | 16935 | 38.48 | 1953 | 1910 | 390.5 |
| B | 0 | 189 | 92861 | 250.17 | 1929 | 1881 | 363.7 |
| B | 12 | 111 | 44568 | 117.38 | 1929 | 1881 | 363.7 |
| B | 11 | 111 | 39753 | 104.14 | 1929 | 1881 | 363.7 |
| C | 14 | 238 | 296019 | 681.32 | 1863 | 1878 | 431.7 |
| C | 0 | 10 | 82552 | 186.86 | 1863 | 1878 | 431.7 |
| C | 0 | 239 | 18568 | 38.66 | 1863 | 1878 | 431.7 |
| D | 1 | 52 | 1039806 | 2248.1 | 1897 | 1844 | 461.7 |
| D | 7 | 238 | 922512 | 1994.06 | 1897 | 1844 | 461.7 |
| D | 8 | 195 | 103880 | 221.0 | 1897 | 1844 | 461.7 |
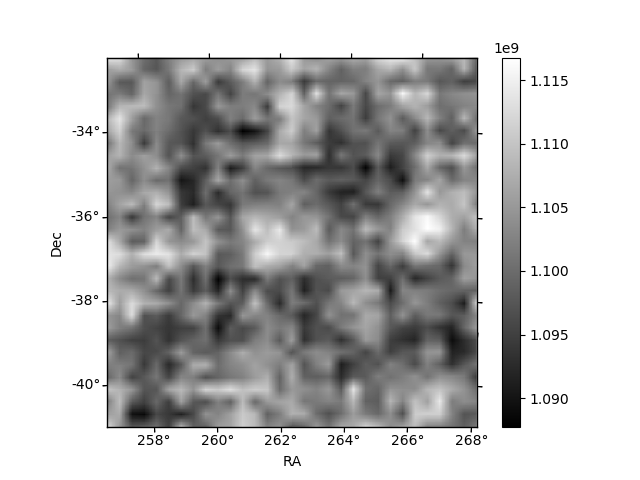
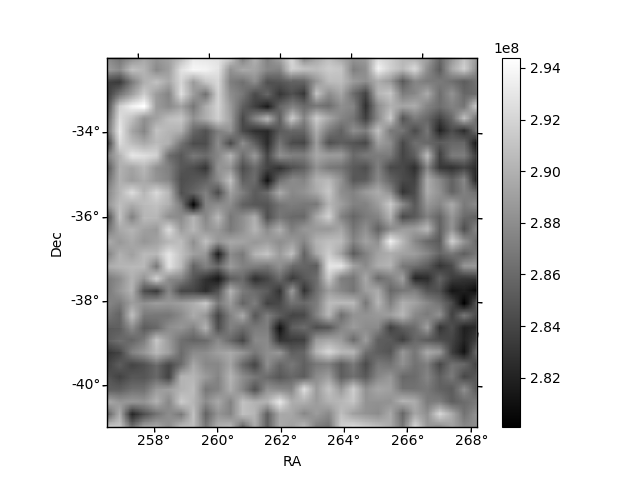
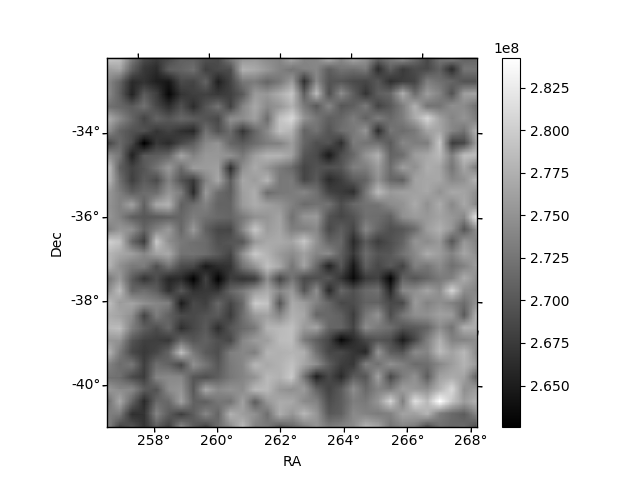
Histogram calculated using DETX and DETY for each event in the final _common_clean file
| Quadrant A | 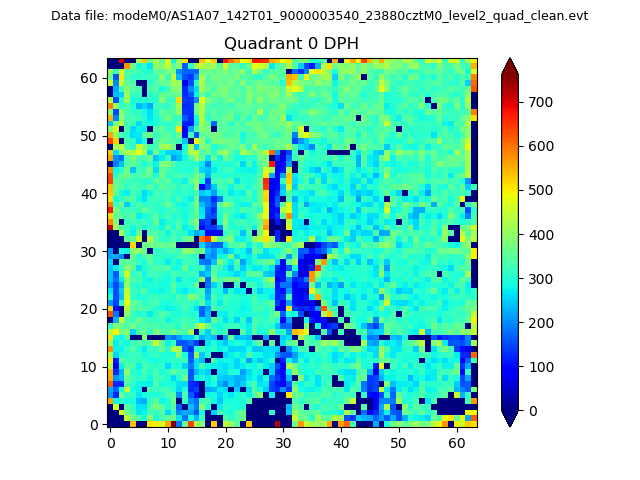 |
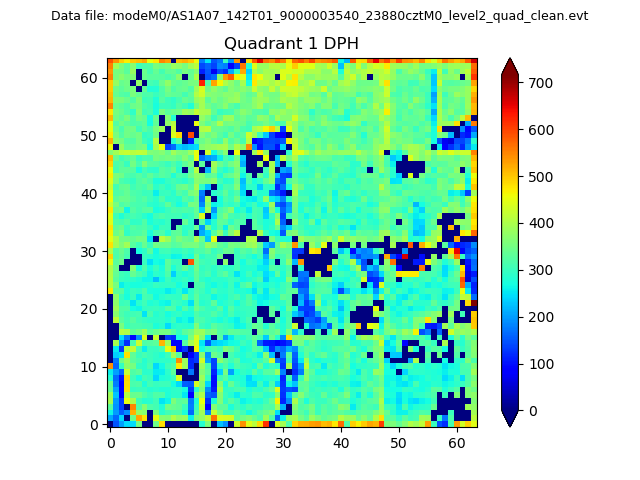 |
Quadrant B |
|---|---|---|---|
| Quadrant D | 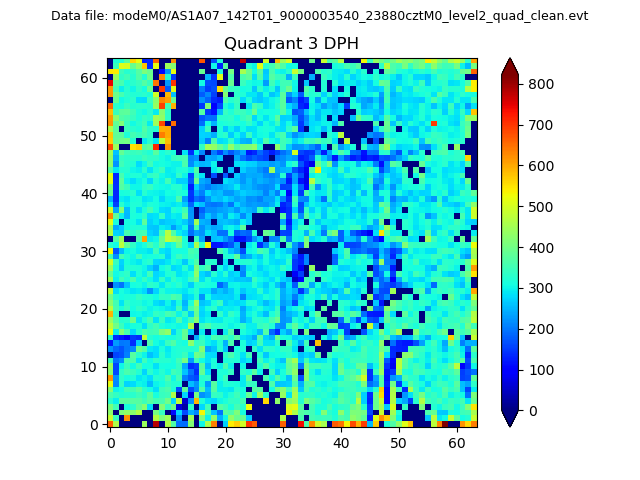 |
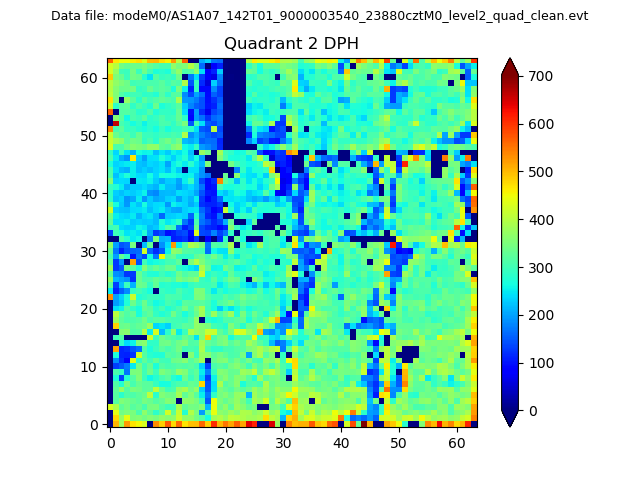 |
Quadrant C |
| Plot type | Count rate plots | Images |
|---|---|---|
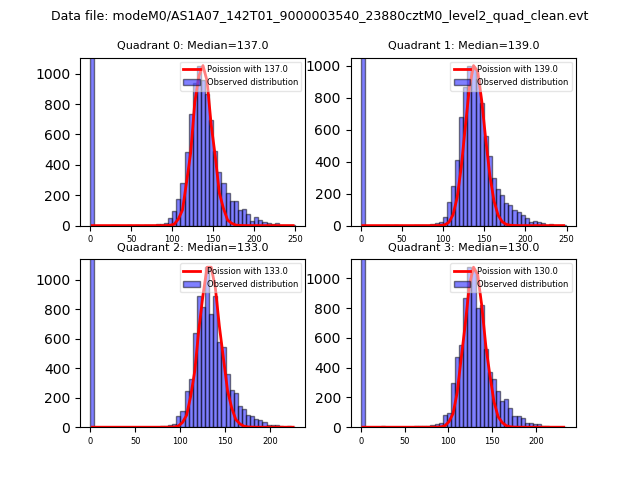
| Comparison with Poisson distribution Blue bars denote a histogram of data divided into 1 sec bins. Red curve is a Poisson curve with rate = median count rate of data. |
 |
 |
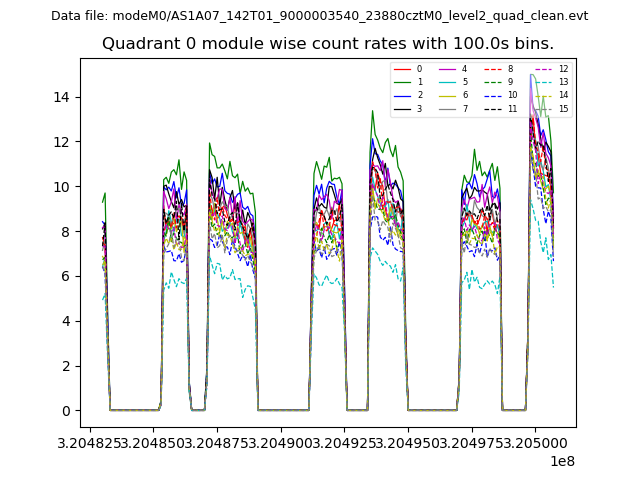
| Quadrant-wise count rates Data is divided into 100 sec bins |
 |
|
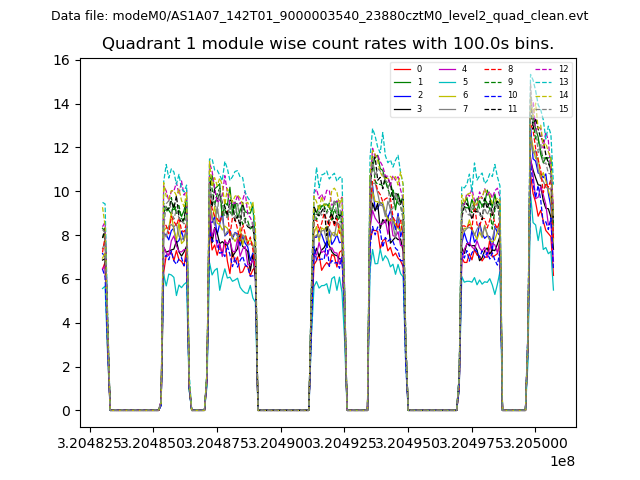
| Module-wise count rates for Quadrant A Data is divided into 100 sec bins |
 |
 |
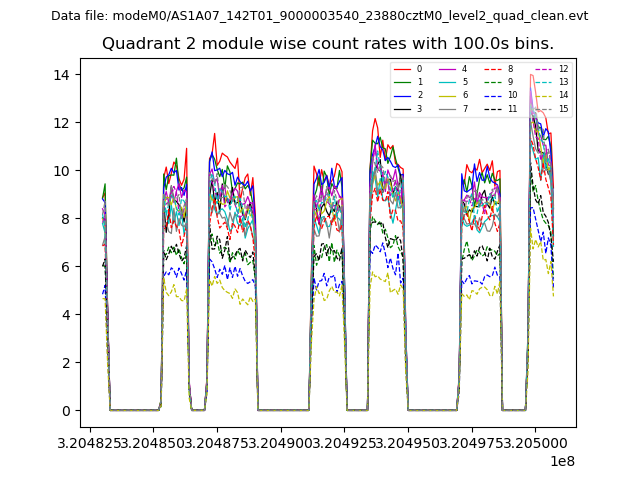
| Module-wise count rates for Quadrant B Data is divided into 100 sec bins |
 |
 |
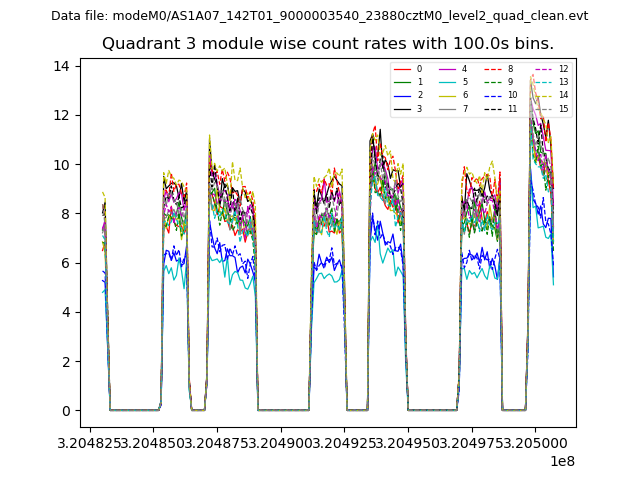
| Module-wise count rates for Quadrant C Data is divided into 100 sec bins |
 |
 |
| Module-wise count rates for Quadrant D Data is divided into 100 sec bins |
 |
 |
| Parameter | Plot |
|---|---|
| CZT HV Monitor | 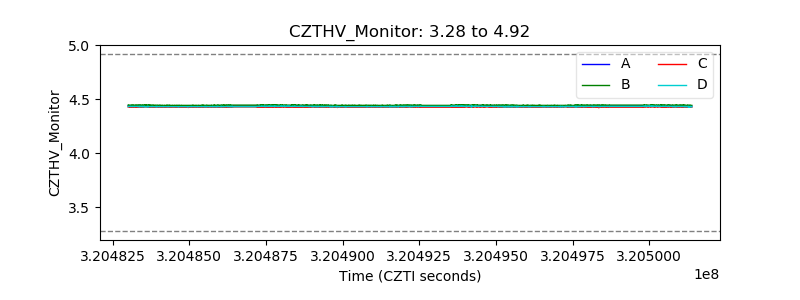 |
| D_VDD | 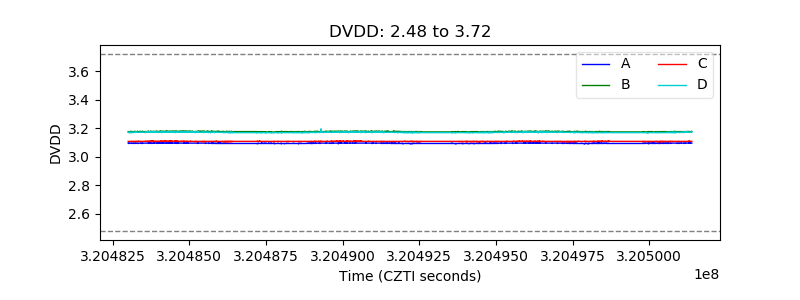 |
| Temperature 1 | 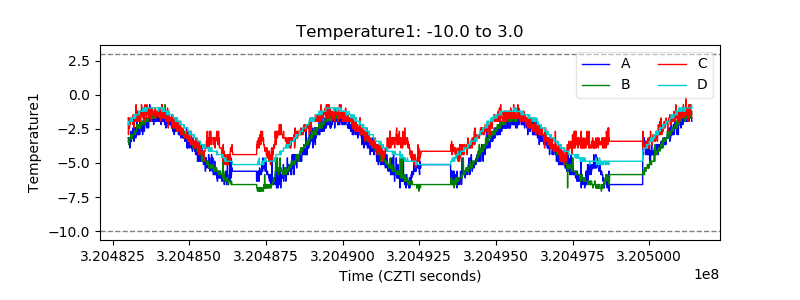 |
| Veto HV Monitor | 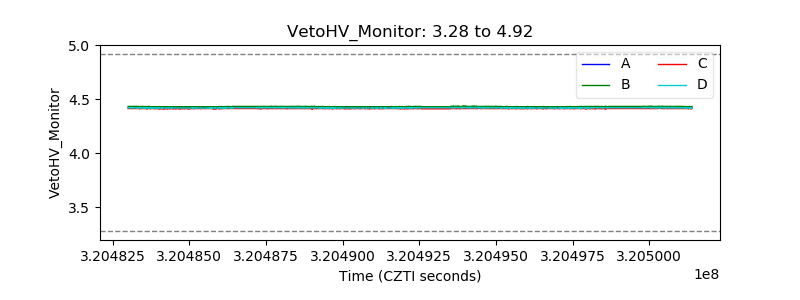 |
| Veto LLD | 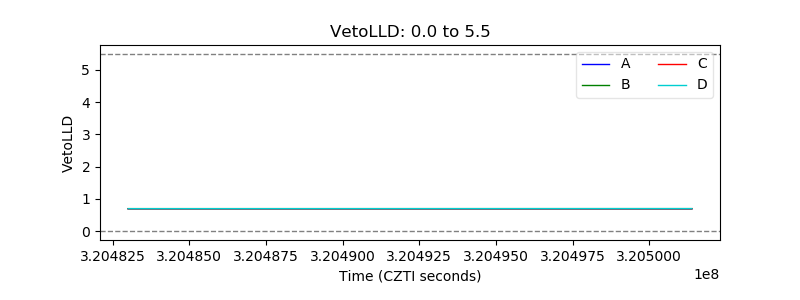 |
| Alpha Counter |  |
| _CPM_Rate |  |
| CZT Counter | 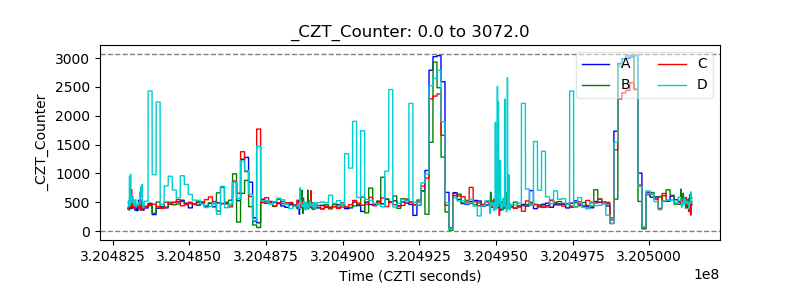 |
| +2.5 Volts monitor |  |
| +5 Volts monitor |  |
| _ROLL_ROT | 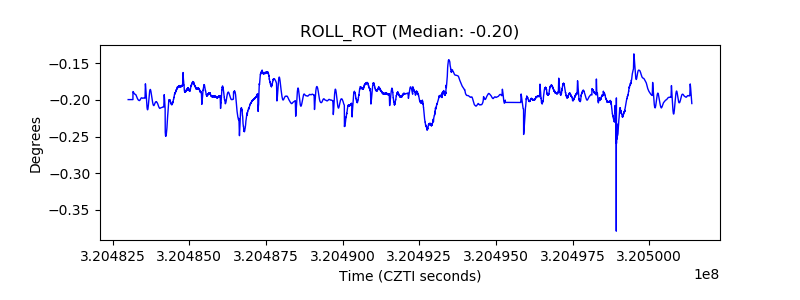 |
| _Roll_DEC | 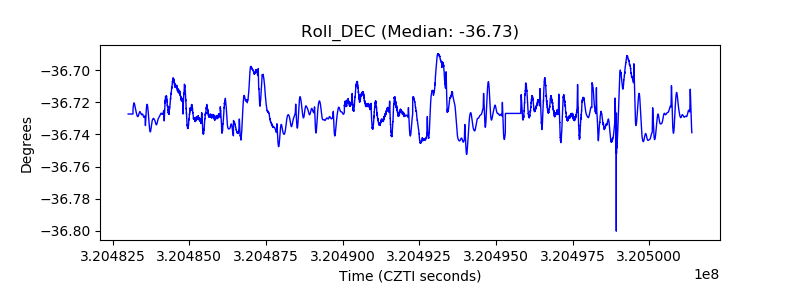 |
| _Roll_RA |  |
| Veto Counter | 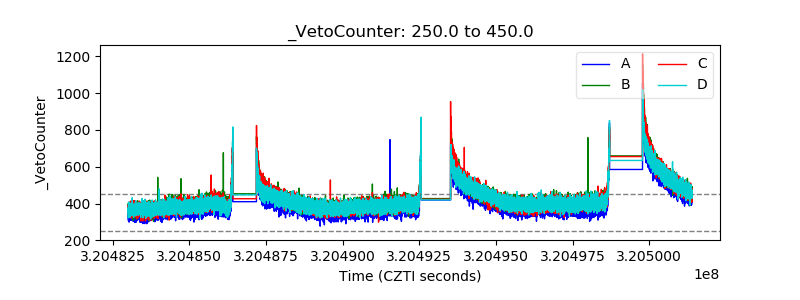 |