| Param | Original file | Final file |
|---|---|---|
| Filename | modeM0/AS1A07_142T01_9000003540_23881cztM0_level2.evt | modeM0/AS1A07_142T01_9000003540_23881cztM0_level2_quad_clean.evt |
| Size (bytes) | 501,275,520 | 87,566,400 |
| Size | 478.1 MB | 83.5 MB |
| Events in quadrant A | 3,558,869 | 563,220 |
| Events in quadrant B | 3,731,232 | 567,287 |
| Events in quadrant C | 3,547,426 | 529,117 |
| Events in quadrant D | 3,892,252 | 528,391 |
| Mode M9 | |||
|---|---|---|---|
| Quadrant | BADHDUFLAG | Total packets | Discarded packets |
| A | 0 | 12 | 0 |
| B | 0 | 12 | 0 |
| C | 0 | 12 | 0 |
| D | 0 | 12 | 0 |
| Mode M0 | |||
|---|---|---|---|
| Quadrant | BADHDUFLAG | Total packets | Discarded packets |
| A | 0 | 14803 | 2 |
| B | 0 | 15285 | 2 |
| C | 0 | 14668 | 2 |
| D | 0 | 15819 | 2 |
| Mode SS | |||
|---|---|---|---|
| Quadrant | BADHDUFLAG | Total packets | Discarded packets |
| A | 0 | 136 | 0 |
| B | 0 | 136 | 0 |
| C | 0 | 136 | 0 |
| D | 0 | 136 | 0 |
| Quadrant | Total seconds | Saturated seconds | Saturation percentage |
|---|---|---|---|
| A | 6647 | 85 | 1.278772% |
| B | 6648 | 121 | 1.820096% |
| C | 6648 | 150 | 2.256318% |
| D | 6648 | 121 | 1.820096% |
Noise dominated data is calculated using 1-second bins in cleaned event files. If a bin has >2000 counts, and if more than 50% of those come from <1% of pixels, then it is considered to be noise-dominated and hence unusable.
| Quadrant | # 1 sec bins | Bins with >0 counts | Bins with >2000 counts | High rate bins dominated by noise | Noise dominated (total time) | Noise dominated (detector-on time) | Marked lightcurve |
|---|---|---|---|---|---|---|---|
| A | 7847 | 6648 | 0 | 0 | 0.00% | 0.00% | 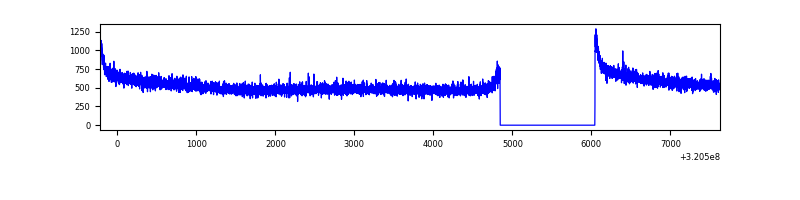 |
| B | 7848 | 6649 | 16 | 16 | 0.20% | 0.24% | 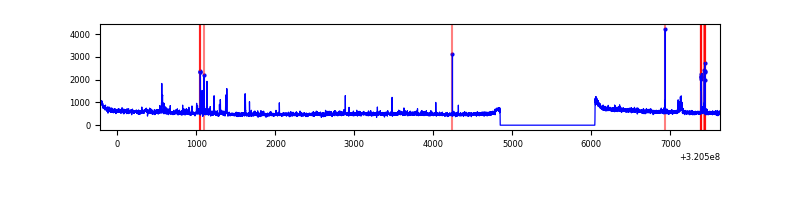 |
| C | 7848 | 6649 | 6 | 6 | 0.08% | 0.09% | 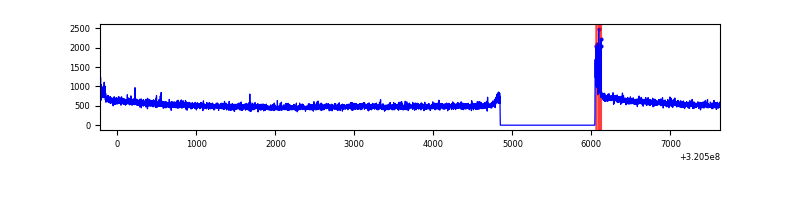 |
| D | 7848 | 6649 | 53 | 53 | 0.68% | 0.80% | 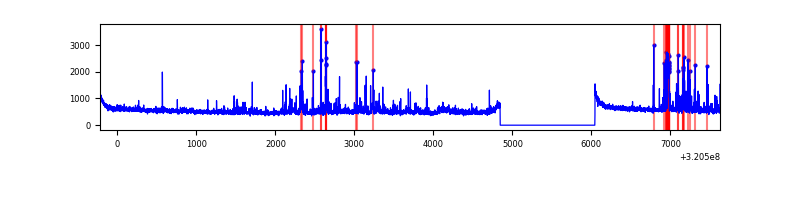 |
Top three noisy pixels from each quadrant. If the there are fewer than three noisy pixels in the level2.evt file, extra rows are filled as -1
| Pixel properties | Quadrant properties | ||||||
|---|---|---|---|---|---|---|---|
| Quadrant | DetID | PixID | Counts | Sigma | Mean | Median | Sigma |
| A | 13 | 254 | 11167 | 56.11 | 923 | 908 | 182.8 |
| A | 0 | 226 | 8053 | 39.08 | 923 | 908 | 182.8 |
| A | 3 | 137 | 7441 | 35.73 | 923 | 908 | 182.8 |
| B | 0 | 189 | 68214 | 397.45 | 904 | 884 | 169.4 |
| B | 5 | 172 | 34252 | 196.97 | 904 | 884 | 169.4 |
| B | 4 | 216 | 25932 | 147.86 | 904 | 884 | 169.4 |
| C | 14 | 238 | 140813 | 706.26 | 862 | 870 | 198.1 |
| C | 0 | 10 | 42917 | 212.2 | 862 | 870 | 198.1 |
| C | 13 | 61 | 5943 | 25.6 | 862 | 870 | 198.1 |
| D | 1 | 52 | 210491 | 969.14 | 893 | 870 | 216.3 |
| D | 12 | 233 | 167557 | 770.64 | 893 | 870 | 216.3 |
| D | 8 | 195 | 120857 | 554.73 | 893 | 870 | 216.3 |
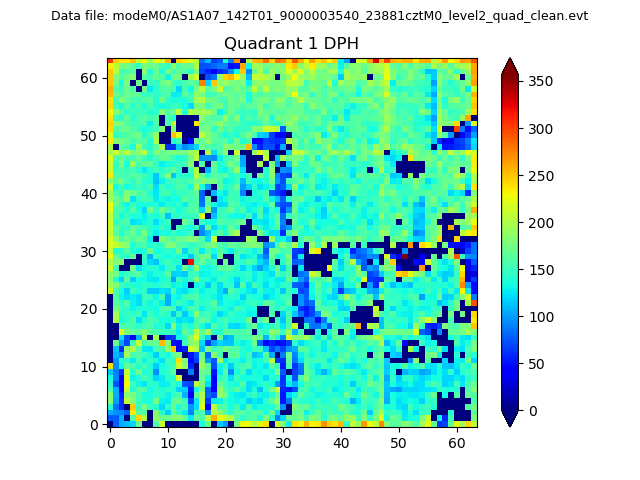
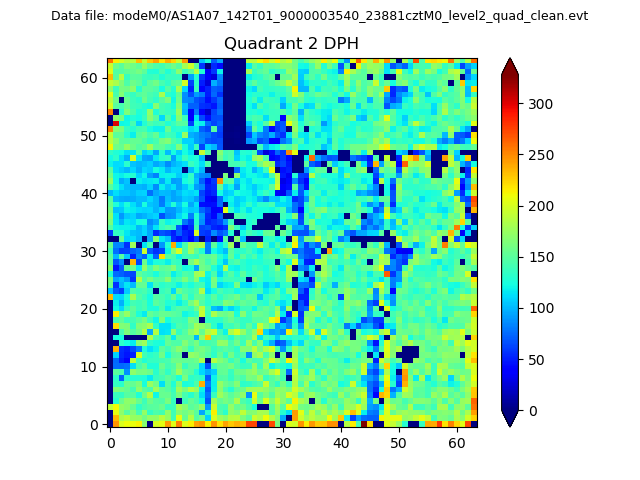
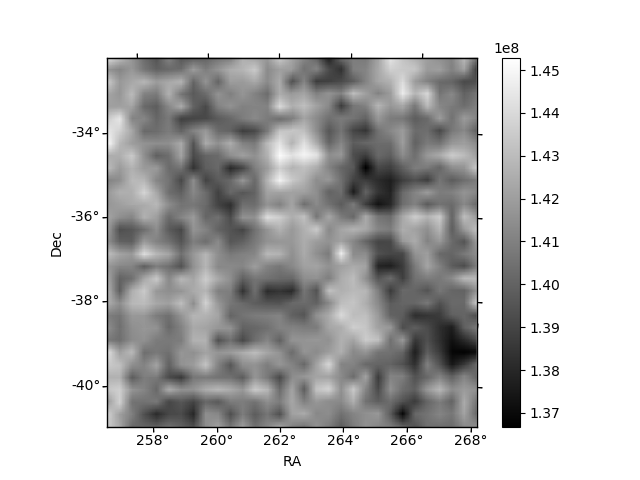
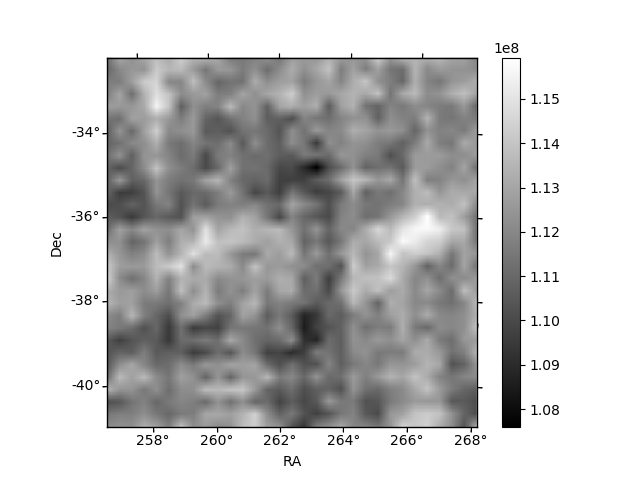
Histogram calculated using DETX and DETY for each event in the final _common_clean file
| Quadrant A |  |
 |
Quadrant B |
|---|---|---|---|
| Quadrant D | 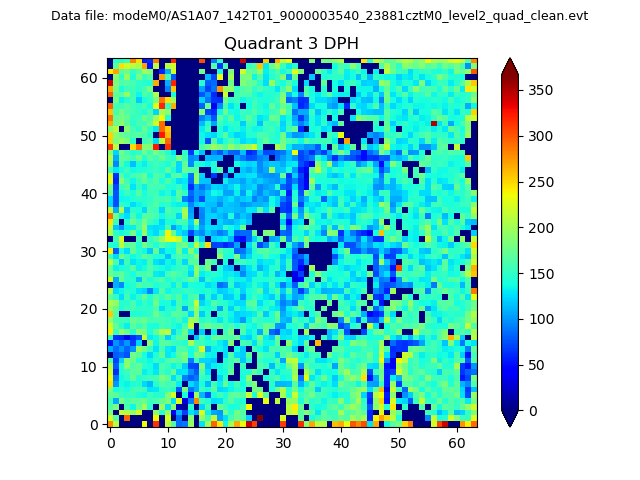 |
 |
Quadrant C |
| Plot type | Count rate plots | Images |
|---|---|---|
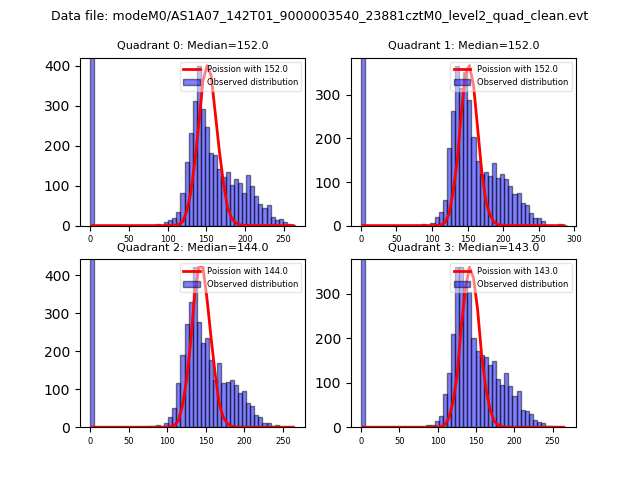
| Comparison with Poisson distribution Blue bars denote a histogram of data divided into 1 sec bins. Red curve is a Poisson curve with rate = median count rate of data. |
 |
 |
| Quadrant-wise count rates Data is divided into 100 sec bins |
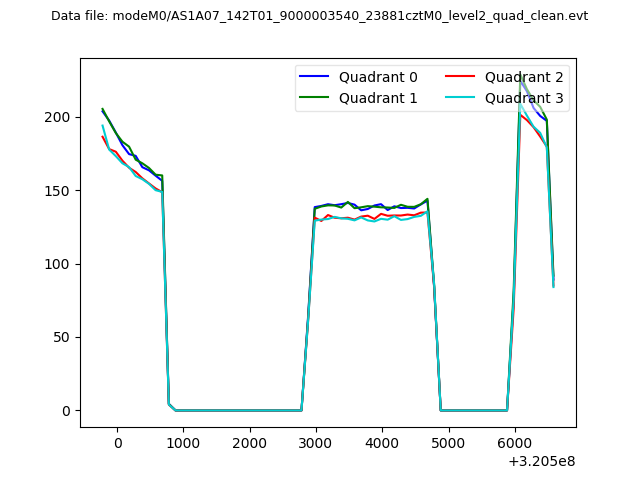 |
|
| Module-wise count rates for Quadrant A Data is divided into 100 sec bins |
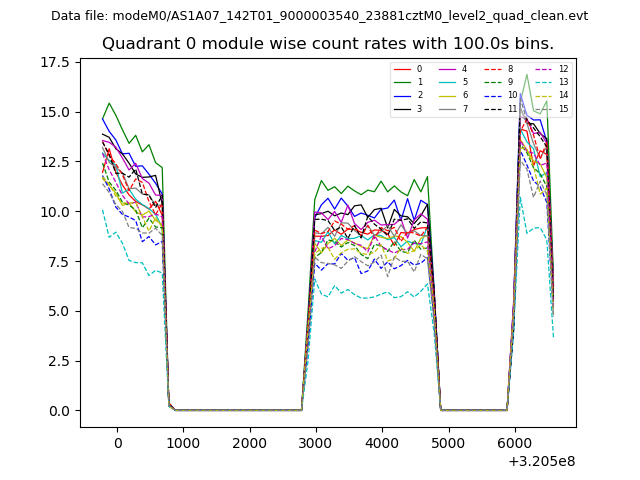 |
 |
| Module-wise count rates for Quadrant B Data is divided into 100 sec bins |
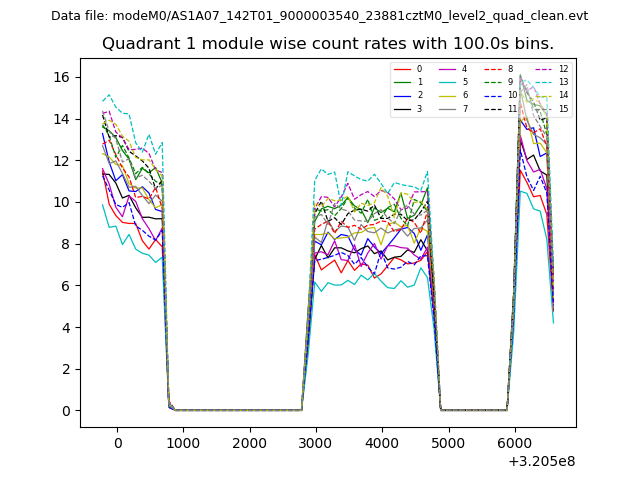 |
 |
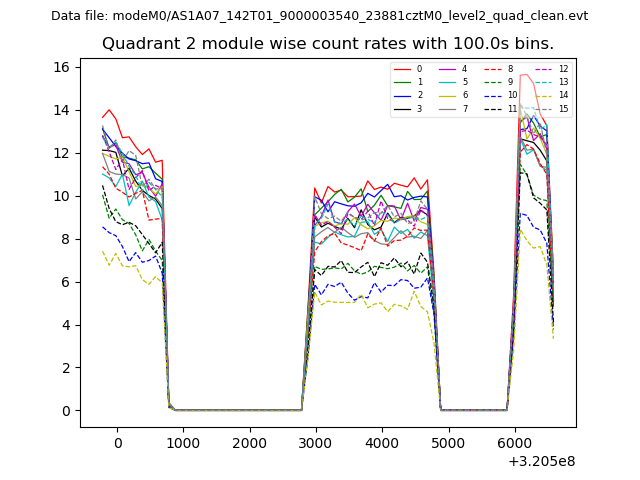
| Module-wise count rates for Quadrant C Data is divided into 100 sec bins |
 |
 |
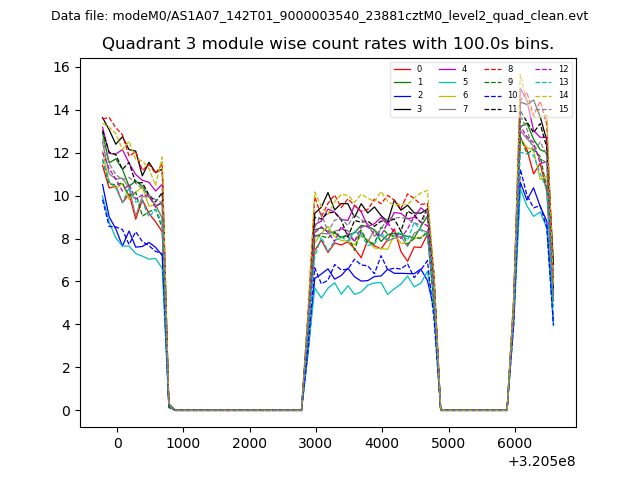
| Module-wise count rates for Quadrant D Data is divided into 100 sec bins |
 |
 |
| Parameter | Plot |
|---|---|
| CZT HV Monitor | 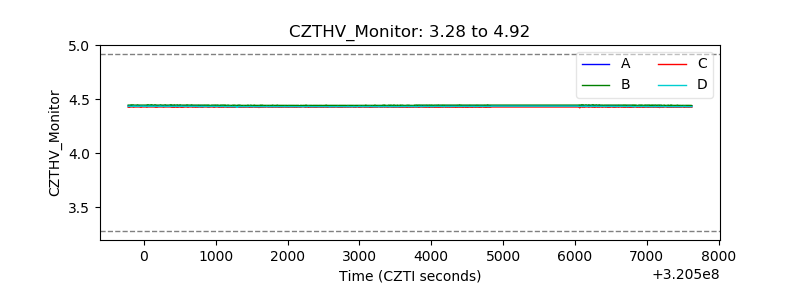 |
| D_VDD | 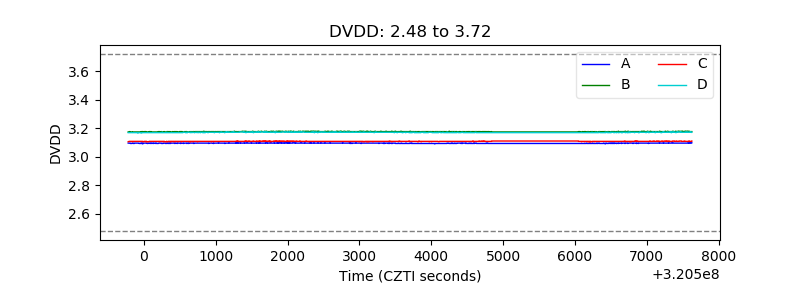 |
| Temperature 1 | 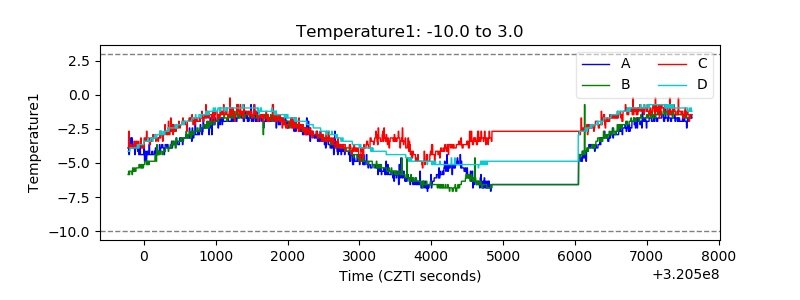 |
| Veto HV Monitor |  |
| Veto LLD | 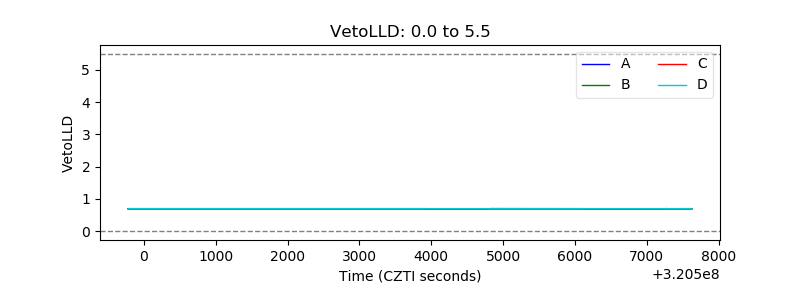 |
| Alpha Counter | 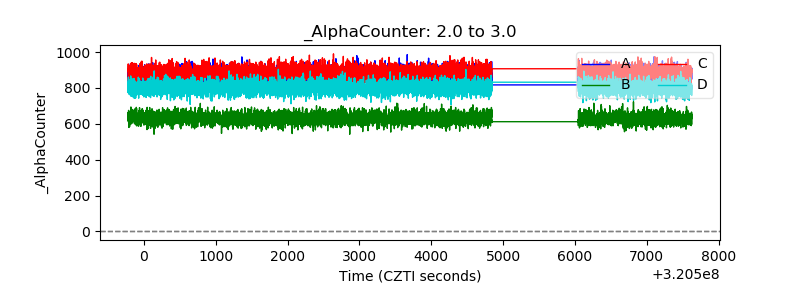 |
| _CPM_Rate | 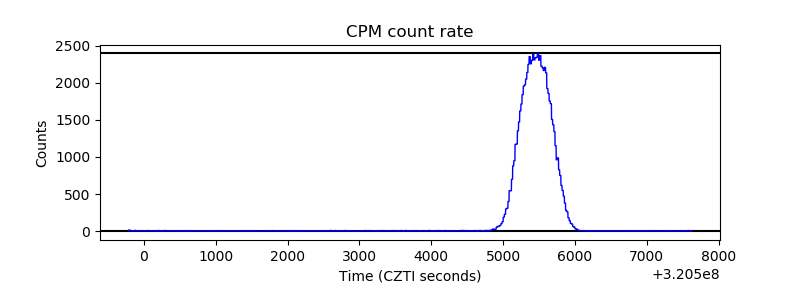 |
| CZT Counter | 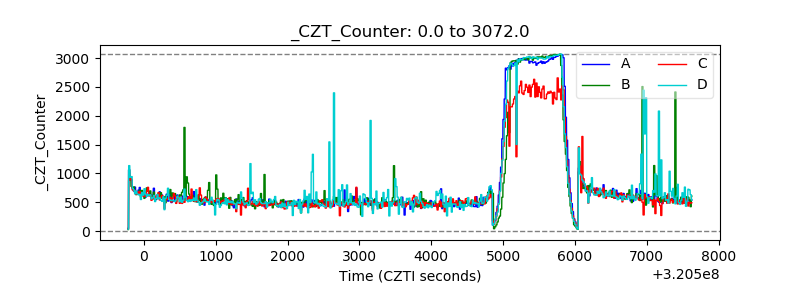 |
| +2.5 Volts monitor | 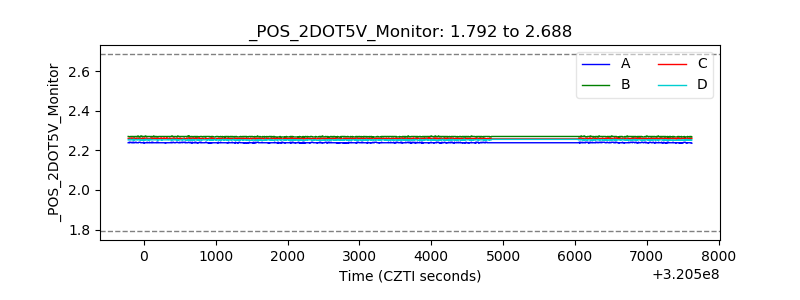 |
| +5 Volts monitor |  |
| _ROLL_ROT | 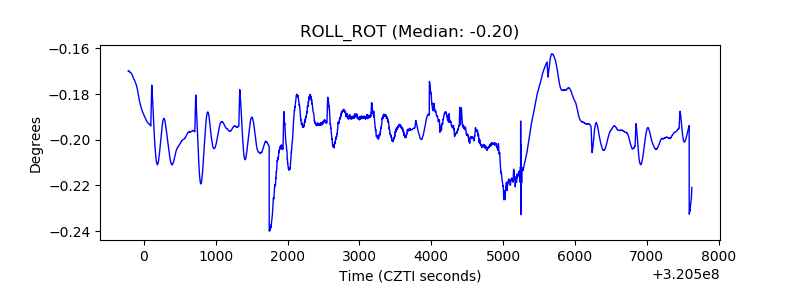 |
| _Roll_DEC | 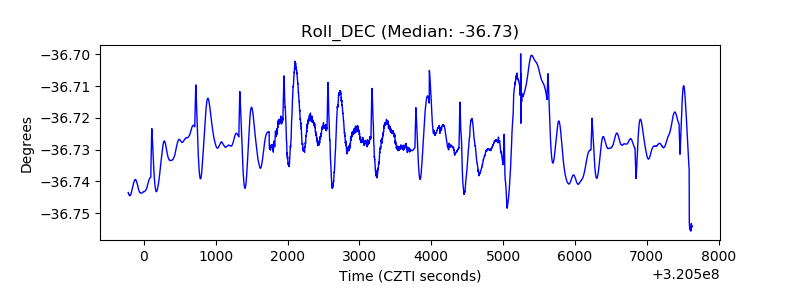 |
| _Roll_RA | 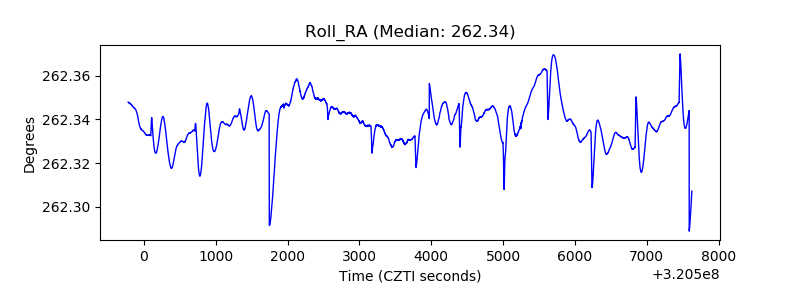 |
| Veto Counter | 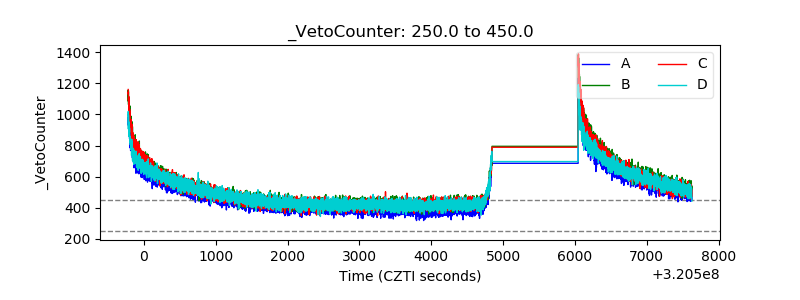 |