| Param | Original file | Final file |
|---|---|---|
| Filename | modeM0/AS1A07_142T01_9000003540_23882cztM0_level2.evt | modeM0/AS1A07_142T01_9000003540_23882cztM0_level2_quad_clean.evt |
| Size (bytes) | 501,393,600 | 74,410,560 |
| Size | 478.2 MB | 71.0 MB |
| Events in quadrant A | 3,561,479 | 465,950 |
| Events in quadrant B | 3,754,558 | 468,662 |
| Events in quadrant C | 3,512,460 | 436,526 |
| Events in quadrant D | 3,921,830 | 435,206 |
| Mode M9 | |||
|---|---|---|---|
| Quadrant | BADHDUFLAG | Total packets | Discarded packets |
| A | 0 | 13 | 0 |
| B | 0 | 13 | 0 |
| C | 0 | 13 | 0 |
| D | 0 | 13 | 0 |
| Mode M0 | |||
|---|---|---|---|
| Quadrant | BADHDUFLAG | Total packets | Discarded packets |
| A | 0 | 14670 | 1 |
| B | 0 | 15217 | 1 |
| C | 0 | 14382 | 1 |
| D | 0 | 15887 | 1 |
| Mode SS | |||
|---|---|---|---|
| Quadrant | BADHDUFLAG | Total packets | Discarded packets |
| A | 0 | 130 | 0 |
| B | 0 | 130 | 0 |
| C | 0 | 130 | 0 |
| D | 0 | 130 | 0 |
| Quadrant | Total seconds | Saturated seconds | Saturation percentage |
|---|---|---|---|
| A | 6402 | 98 | 1.530772% |
| B | 6403 | 125 | 1.952210% |
| C | 6403 | 134 | 2.092769% |
| D | 6403 | 172 | 2.686241% |
Noise dominated data is calculated using 1-second bins in cleaned event files. If a bin has >2000 counts, and if more than 50% of those come from <1% of pixels, then it is considered to be noise-dominated and hence unusable.
| Quadrant | # 1 sec bins | Bins with >0 counts | Bins with >2000 counts | High rate bins dominated by noise | Noise dominated (total time) | Noise dominated (detector-on time) | Marked lightcurve |
|---|---|---|---|---|---|---|---|
| A | 7687 | 6403 | 0 | 0 | 0.00% | 0.00% | 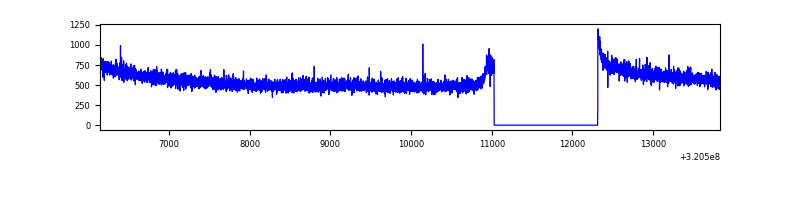 |
| B | 7688 | 6404 | 20 | 20 | 0.26% | 0.31% | 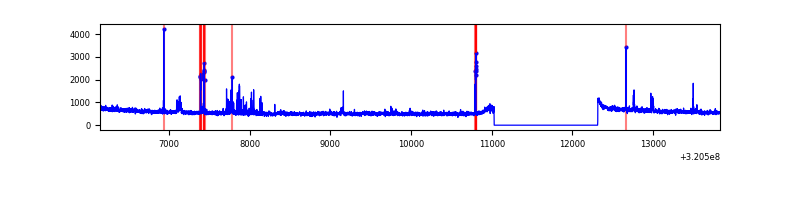 |
| C | 7688 | 6404 | 0 | 0 | 0.00% | 0.00% | 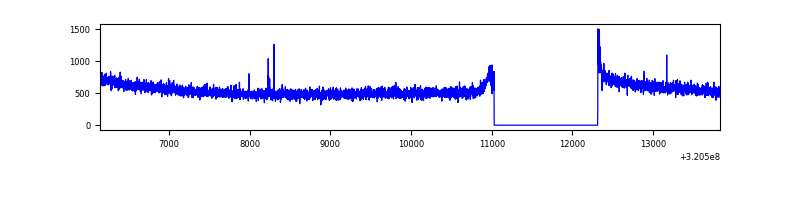 |
| D | 7688 | 6404 | 82 | 82 | 1.07% | 1.28% | 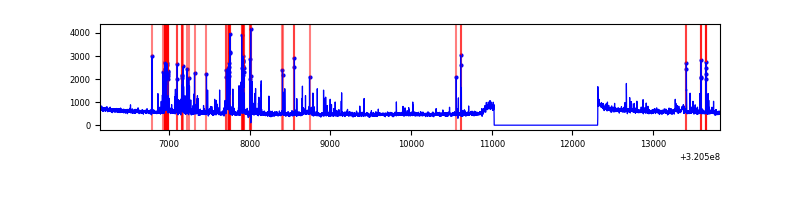 |
Top three noisy pixels from each quadrant. If the there are fewer than three noisy pixels in the level2.evt file, extra rows are filled as -1
| Pixel properties | Quadrant properties | ||||||
|---|---|---|---|---|---|---|---|
| Quadrant | DetID | PixID | Counts | Sigma | Mean | Median | Sigma |
| A | 13 | 254 | 10369 | 51.69 | 924 | 908 | 183.0 |
| A | 0 | 226 | 8157 | 39.61 | 924 | 908 | 183.0 |
| A | 3 | 137 | 7278 | 34.8 | 924 | 908 | 183.0 |
| B | 0 | 197 | 71806 | 424.84 | 908 | 892 | 166.9 |
| B | 5 | 172 | 30411 | 176.85 | 908 | 892 | 166.9 |
| B | 15 | 33 | 27602 | 160.02 | 908 | 892 | 166.9 |
| C | 14 | 238 | 142071 | 724.46 | 860 | 870 | 194.9 |
| C | 0 | 10 | 12581 | 60.09 | 860 | 870 | 194.9 |
| C | 13 | 61 | 6063 | 26.64 | 860 | 870 | 194.9 |
| D | 12 | 233 | 284730 | 1336.71 | 884 | 859 | 212.4 |
| D | 1 | 52 | 181243 | 849.4 | 884 | 859 | 212.4 |
| D | 8 | 195 | 66512 | 309.15 | 884 | 859 | 212.4 |
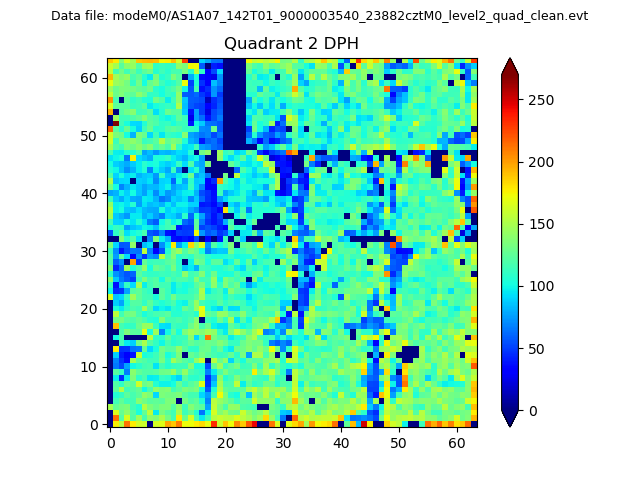
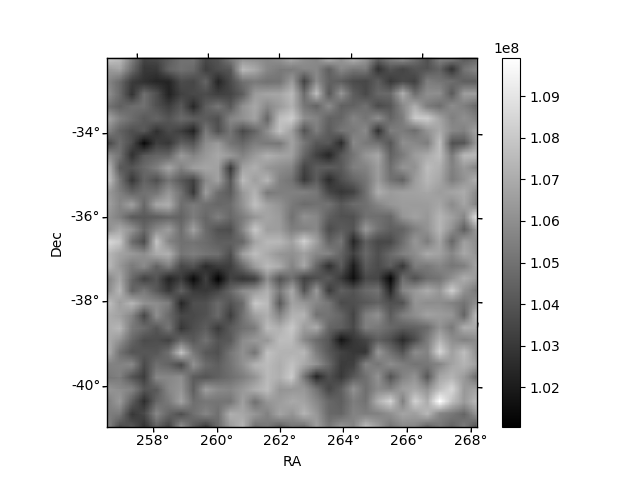
Histogram calculated using DETX and DETY for each event in the final _common_clean file
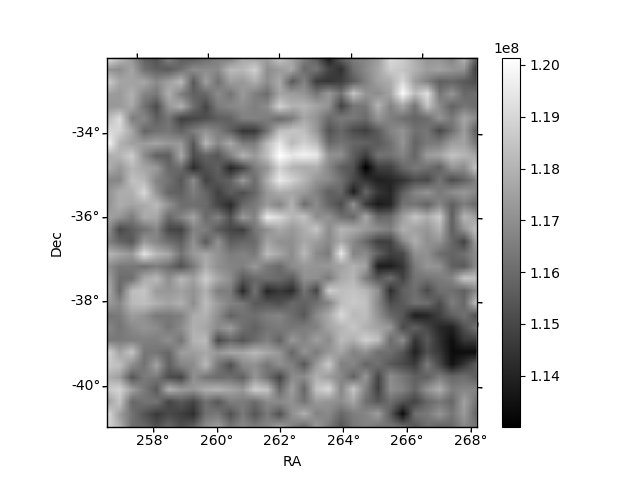
| Quadrant A | 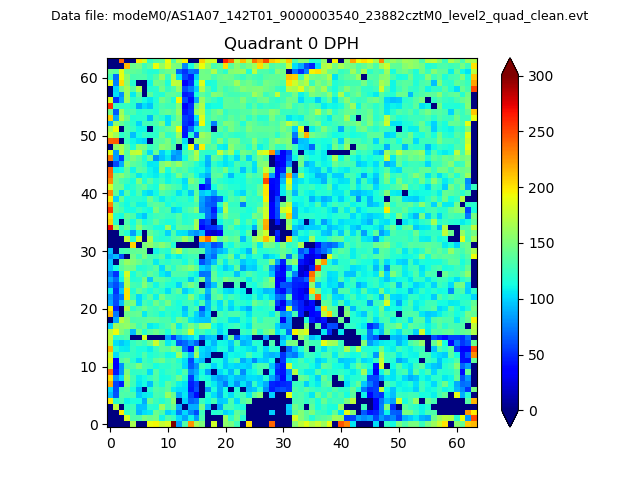 |
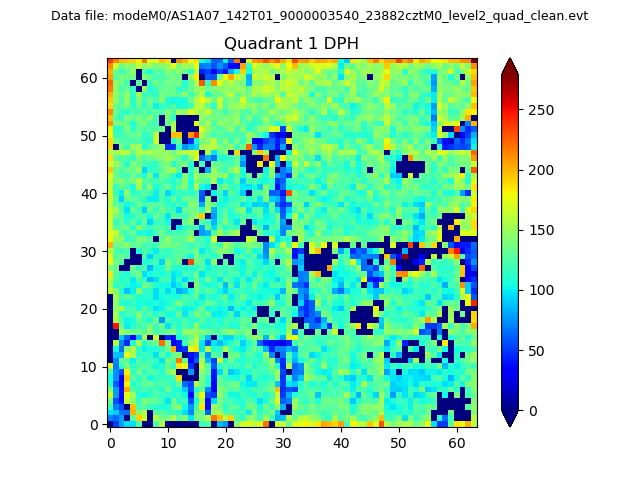 |
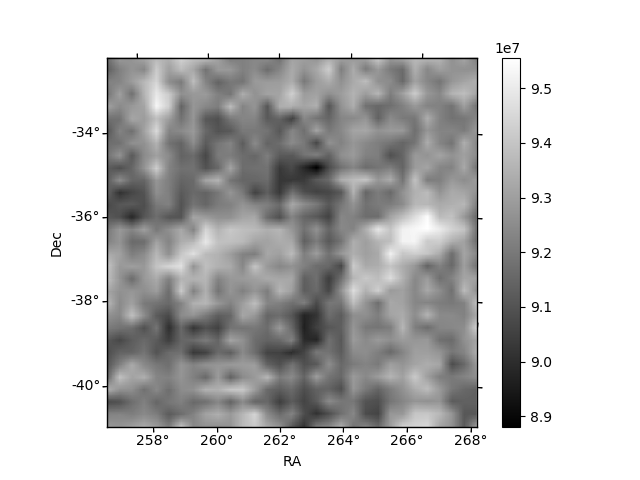
Quadrant B |
|---|---|---|---|
| Quadrant D | 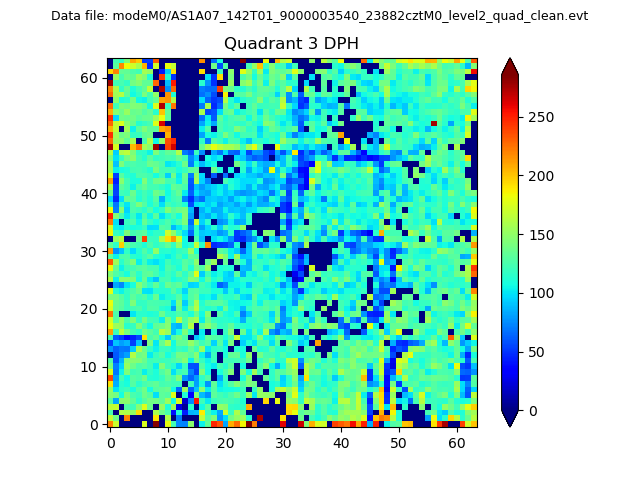 |
 |
Quadrant C |
| Plot type | Count rate plots | Images |
|---|---|---|
| Comparison with Poisson distribution Blue bars denote a histogram of data divided into 1 sec bins. Red curve is a Poisson curve with rate = median count rate of data. |
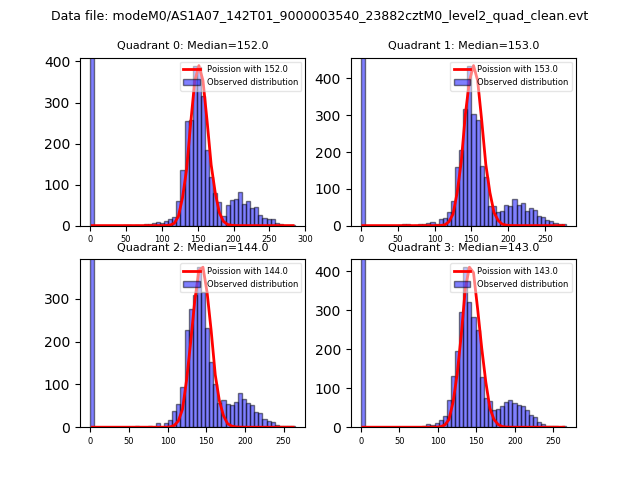 |
 |
| Quadrant-wise count rates Data is divided into 100 sec bins |
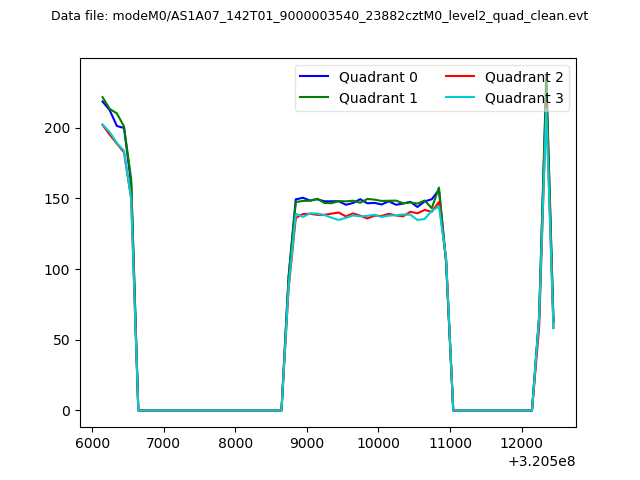 |
|
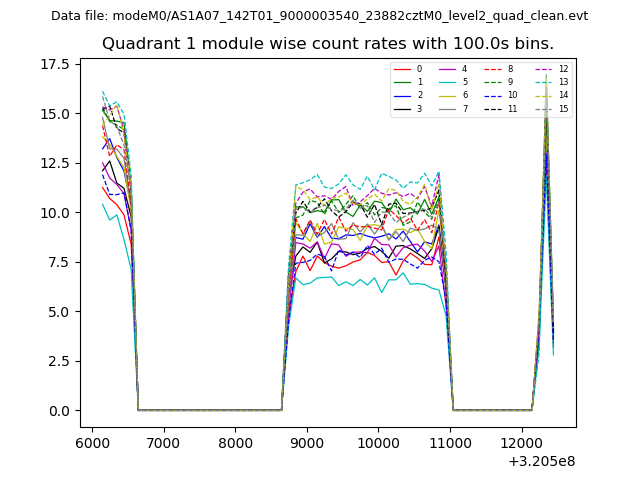
| Module-wise count rates for Quadrant A Data is divided into 100 sec bins |
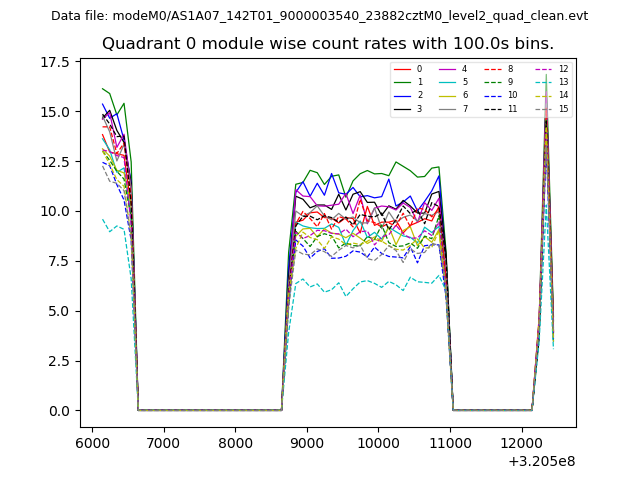 |
 |
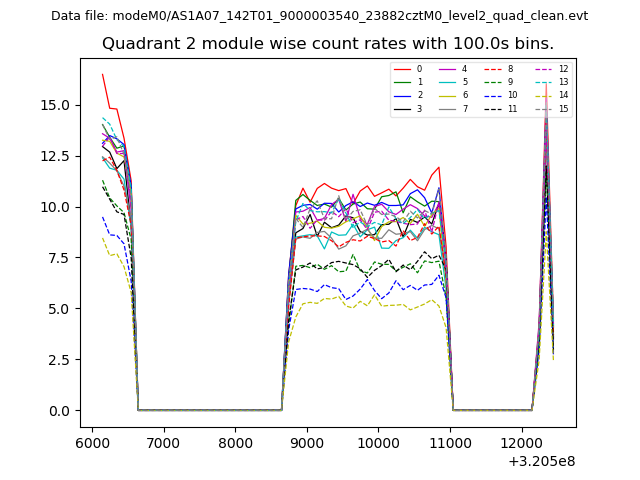
| Module-wise count rates for Quadrant B Data is divided into 100 sec bins |
 |
 |
| Module-wise count rates for Quadrant C Data is divided into 100 sec bins |
 |
 |
| Module-wise count rates for Quadrant D Data is divided into 100 sec bins |
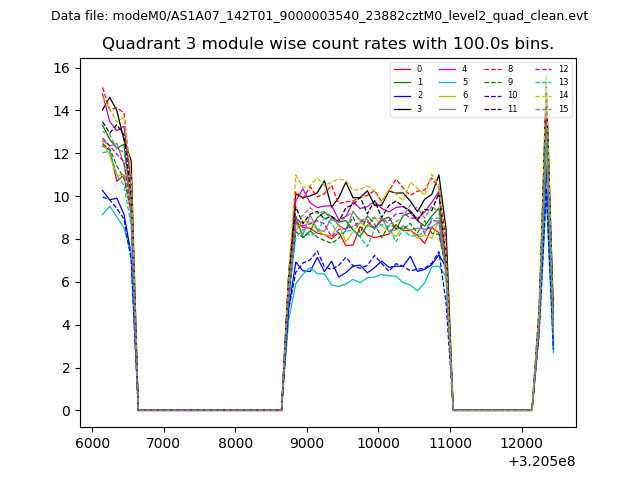 |
 |
| Parameter | Plot |
|---|---|
| CZT HV Monitor | 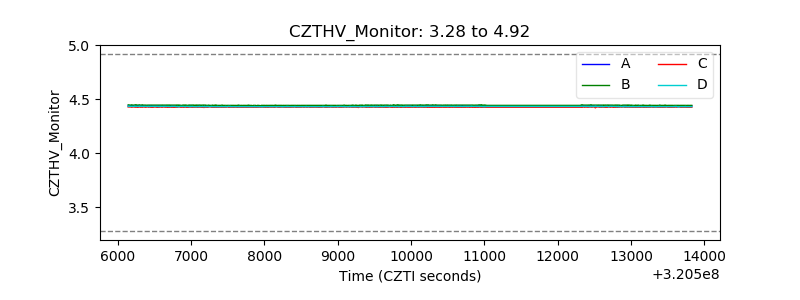 |
| D_VDD | 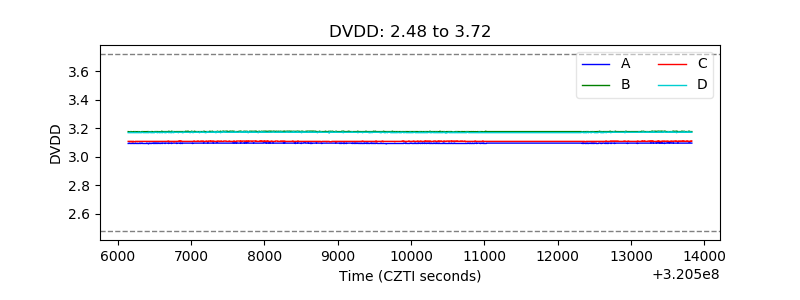 |
| Temperature 1 | 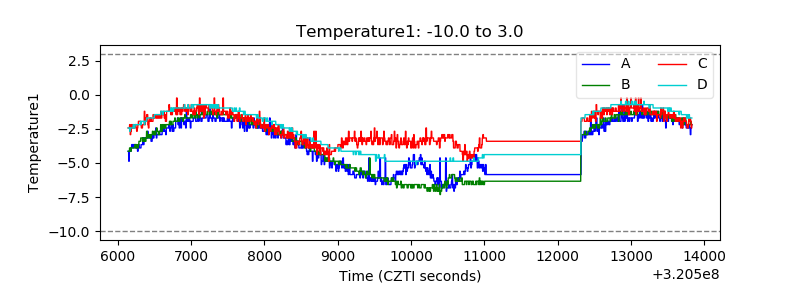 |
| Veto HV Monitor | 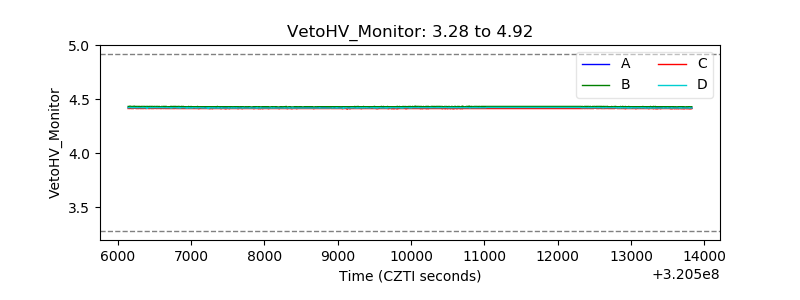 |
| Veto LLD | 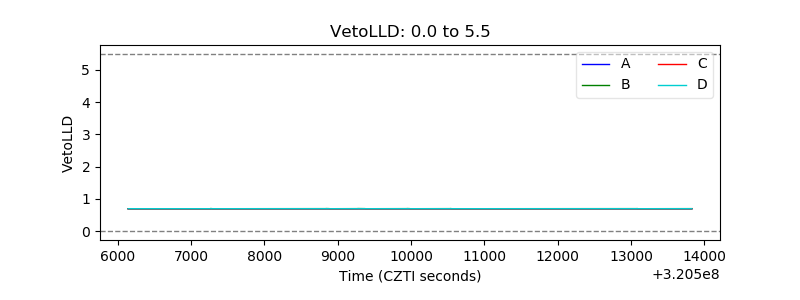 |
| Alpha Counter | 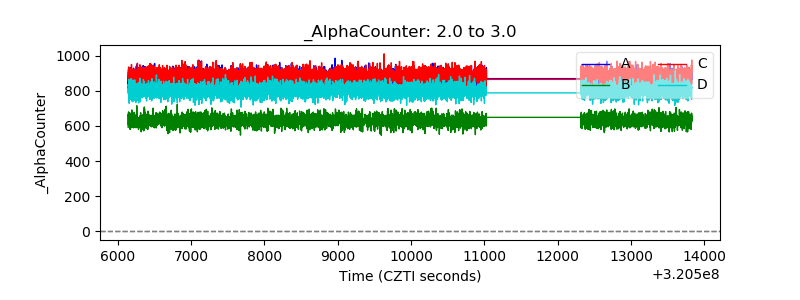 |
| _CPM_Rate | 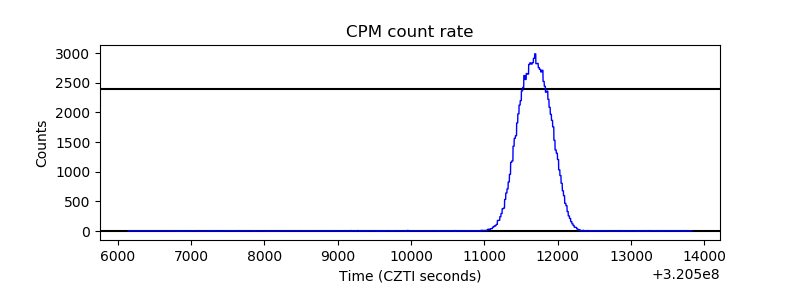 |
| CZT Counter |  |
| +2.5 Volts monitor |  |
| +5 Volts monitor | 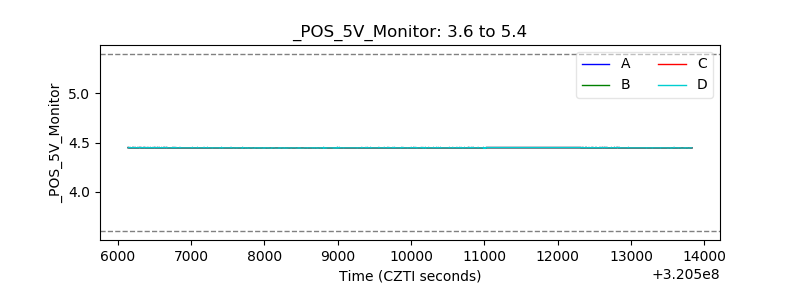 |
| _ROLL_ROT | 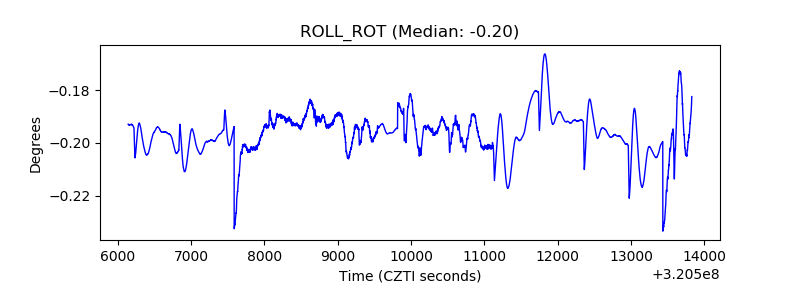 |
| _Roll_DEC | 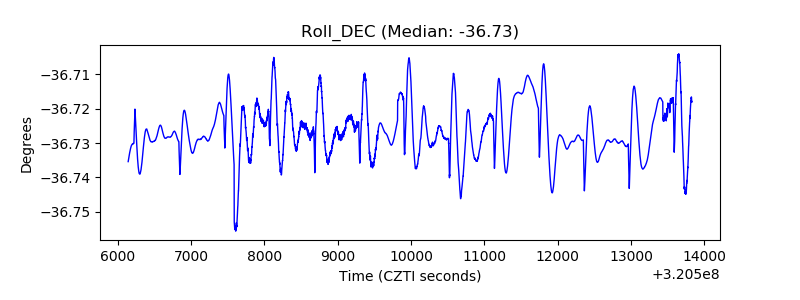 |
| _Roll_RA | 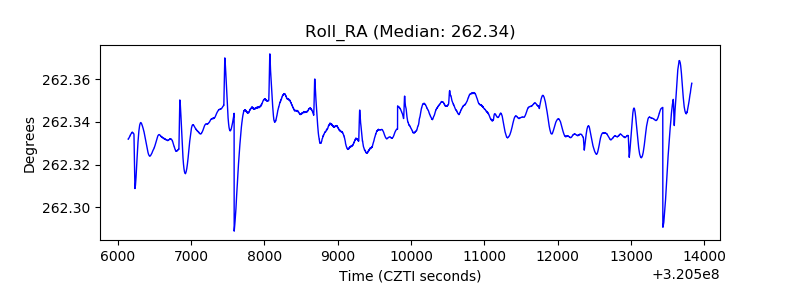 |
| Veto Counter | 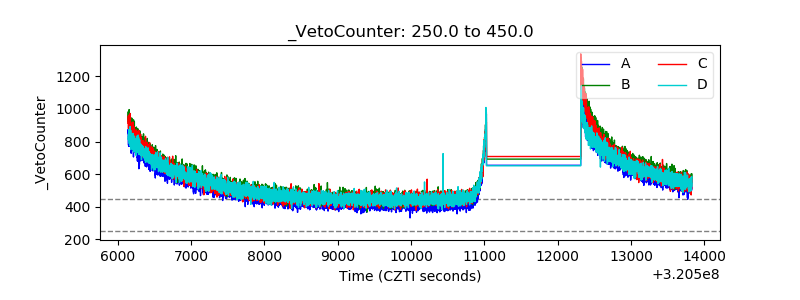 |