| Param | Original file | Final file |
|---|---|---|
| Filename | modeM0/AS1A07_142T01_9000003540_23884cztM0_level2.evt | modeM0/AS1A07_142T01_9000003540_23884cztM0_level2_quad_clean.evt |
| Size (bytes) | 471,176,640 | 72,835,200 |
| Size | 449.3 MB | 69.5 MB |
| Events in quadrant A | 3,400,754 | 458,353 |
| Events in quadrant B | 3,509,803 | 462,208 |
| Events in quadrant C | 3,476,811 | 431,062 |
| Events in quadrant D | 3,466,488 | 426,115 |
| Mode M9 | |||
|---|---|---|---|
| Quadrant | BADHDUFLAG | Total packets | Discarded packets |
| A | 0 | 17 | 0 |
| B | 0 | 18 | 0 |
| C | 0 | 18 | 0 |
| D | 0 | 18 | 0 |
| Mode M0 | |||
|---|---|---|---|
| Quadrant | BADHDUFLAG | Total packets | Discarded packets |
| A | 0 | 13931 | 2 |
| B | 0 | 14203 | 2 |
| C | 0 | 13992 | 2 |
| D | 0 | 14279 | 2 |
| Mode SS | |||
|---|---|---|---|
| Quadrant | BADHDUFLAG | Total packets | Discarded packets |
| A | 0 | 124 | 0 |
| B | 0 | 124 | 0 |
| C | 0 | 124 | 0 |
| D | 0 | 124 | 0 |
| Quadrant | Total seconds | Saturated seconds | Saturation percentage |
|---|---|---|---|
| A | 6127 | 114 | 1.860617% |
| B | 6127 | 149 | 2.431859% |
| C | 6126 | 206 | 3.362716% |
| D | 6126 | 83 | 1.354881% |
Noise dominated data is calculated using 1-second bins in cleaned event files. If a bin has >2000 counts, and if more than 50% of those come from <1% of pixels, then it is considered to be noise-dominated and hence unusable.
| Quadrant | # 1 sec bins | Bins with >0 counts | Bins with >2000 counts | High rate bins dominated by noise | Noise dominated (total time) | Noise dominated (detector-on time) | Marked lightcurve |
|---|---|---|---|---|---|---|---|
| A | 7467 | 6128 | 0 | 0 | 0.00% | 0.00% | 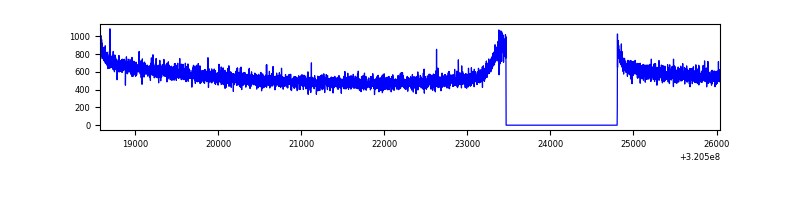 |
| B | 7467 | 6128 | 4 | 4 | 0.05% | 0.07% | 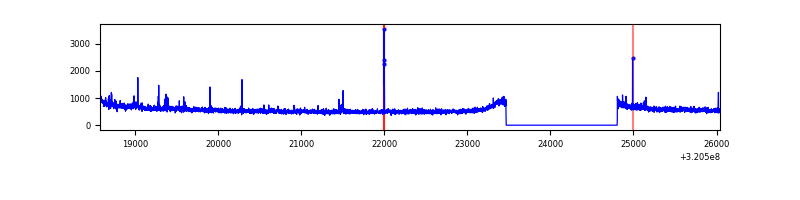 |
| C | 7466 | 6127 | 19 | 19 | 0.25% | 0.31% | 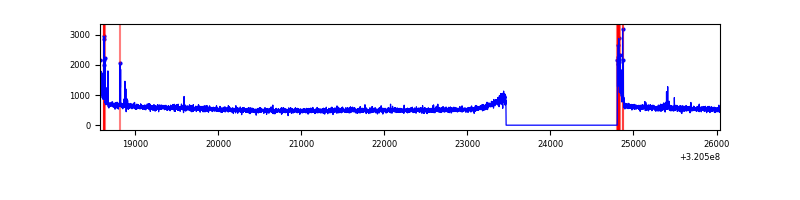 |
| D | 7466 | 6127 | 4 | 4 | 0.05% | 0.07% | 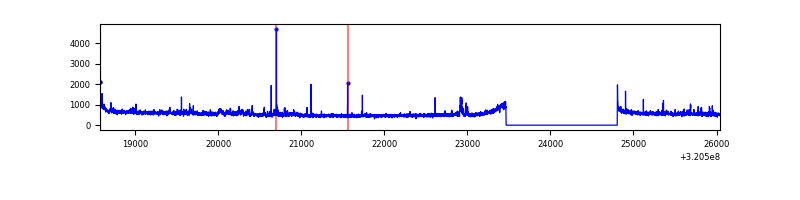 |
Top three noisy pixels from each quadrant. If the there are fewer than three noisy pixels in the level2.evt file, extra rows are filled as -1
| Pixel properties | Quadrant properties | ||||||
|---|---|---|---|---|---|---|---|
| Quadrant | DetID | PixID | Counts | Sigma | Mean | Median | Sigma |
| A | 13 | 254 | 10111 | 53.21 | 882 | 867 | 173.7 |
| A | 0 | 226 | 7508 | 38.23 | 882 | 867 | 173.7 |
| A | 3 | 137 | 6856 | 34.48 | 882 | 867 | 173.7 |
| B | 0 | 189 | 64372 | 391.76 | 876 | 859 | 162.1 |
| B | 12 | 111 | 18310 | 107.64 | 876 | 859 | 162.1 |
| B | 11 | 111 | 16165 | 94.41 | 876 | 859 | 162.1 |
| C | 0 | 10 | 149228 | 795.38 | 818 | 825 | 186.6 |
| C | 14 | 238 | 135221 | 720.31 | 818 | 825 | 186.6 |
| C | 13 | 61 | 5809 | 26.71 | 818 | 825 | 186.6 |
| D | 8 | 195 | 128564 | 626.39 | 842 | 818 | 203.9 |
| D | 1 | 52 | 104960 | 510.65 | 842 | 818 | 203.9 |
| D | 2 | 234 | 26916 | 127.97 | 842 | 818 | 203.9 |
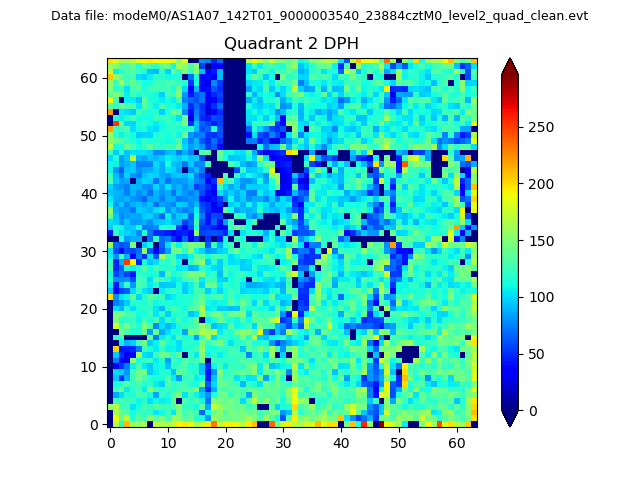
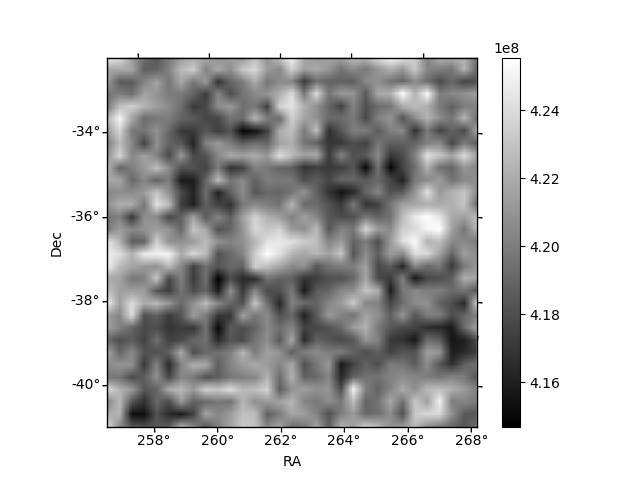
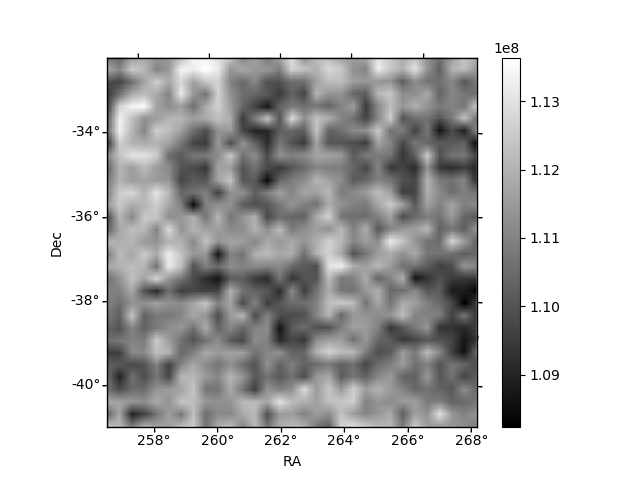
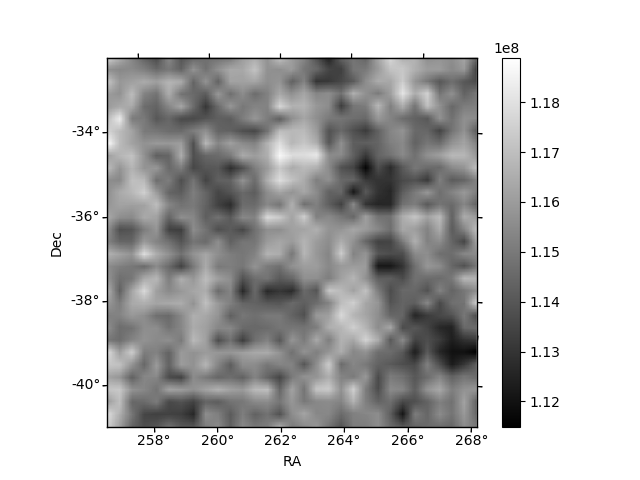
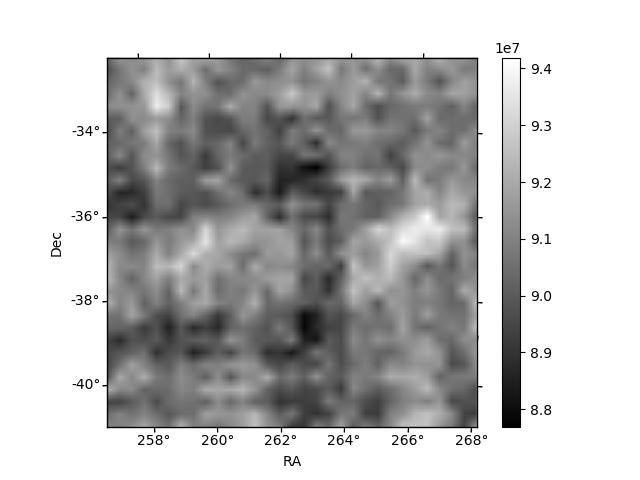
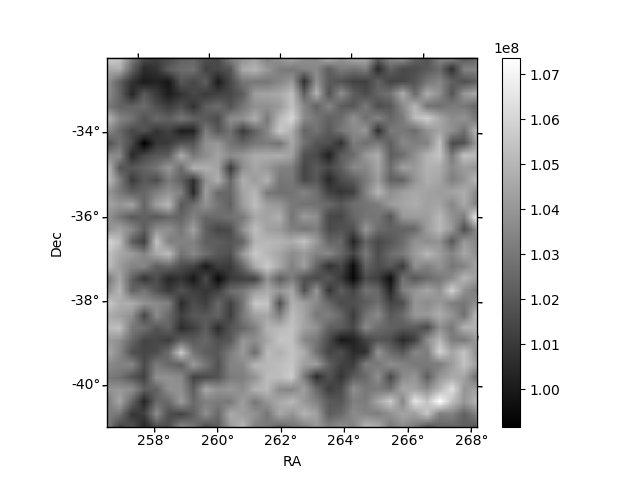
Histogram calculated using DETX and DETY for each event in the final _common_clean file
| Quadrant A | 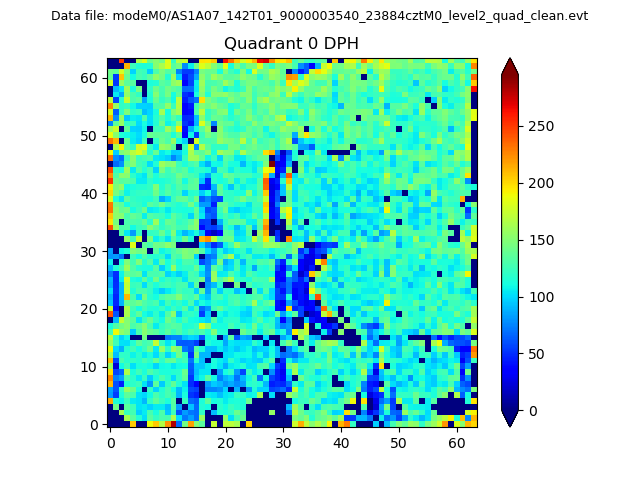 |
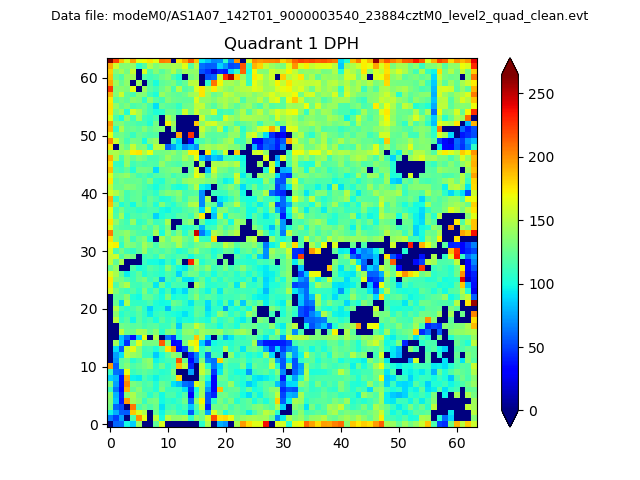 |
Quadrant B |
|---|---|---|---|
| Quadrant D | 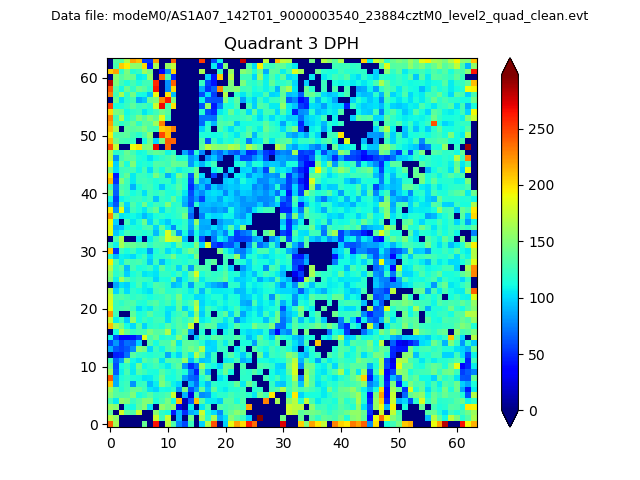 |
 |
Quadrant C |
| Plot type | Count rate plots | Images |
|---|---|---|
| Comparison with Poisson distribution Blue bars denote a histogram of data divided into 1 sec bins. Red curve is a Poisson curve with rate = median count rate of data. |
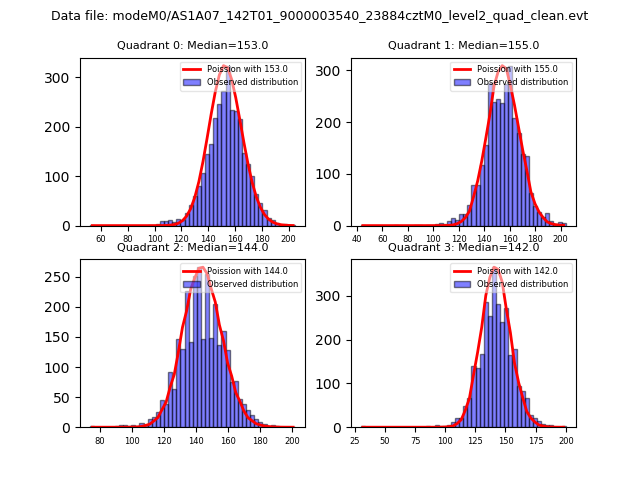 |
 |
| Quadrant-wise count rates Data is divided into 100 sec bins |
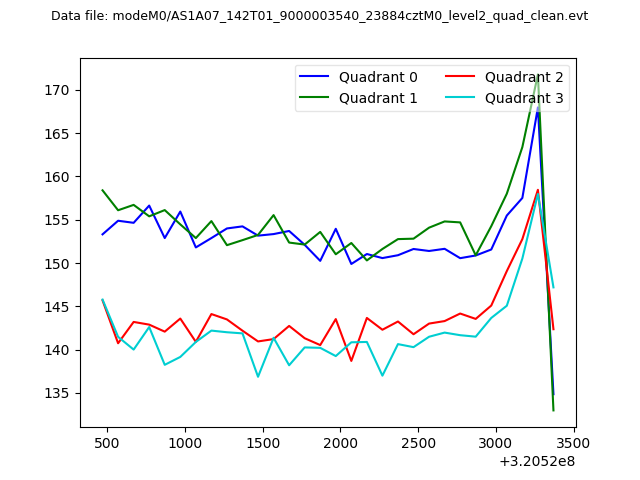 |
|
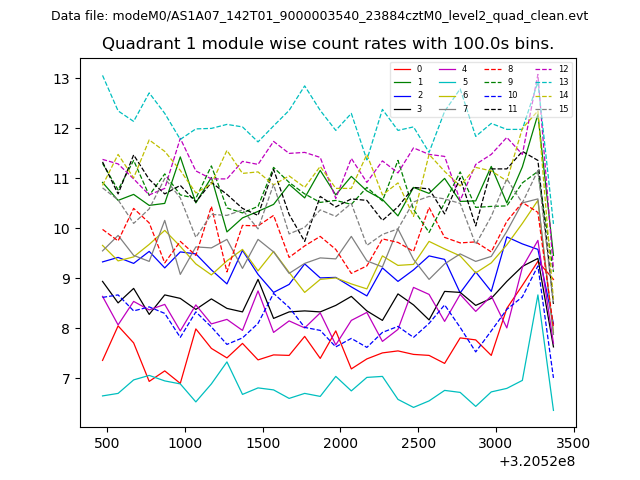
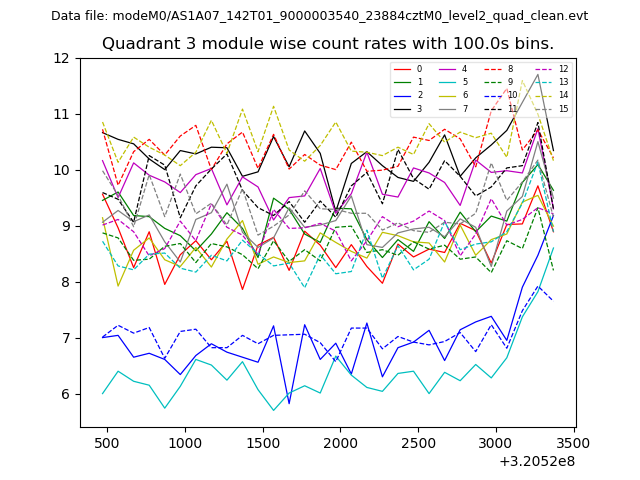
| Module-wise count rates for Quadrant A Data is divided into 100 sec bins |
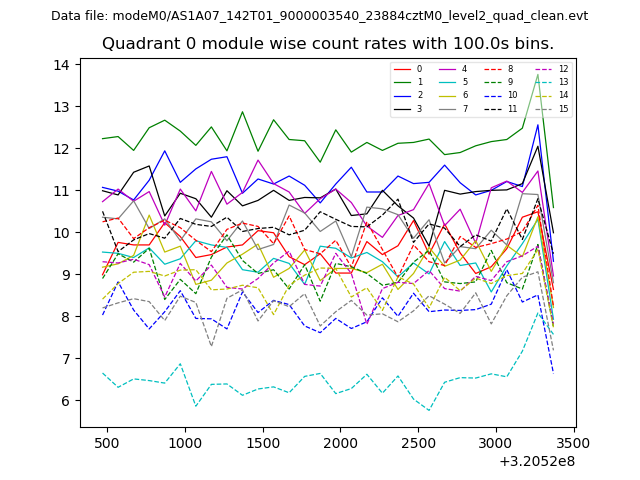 |
 |
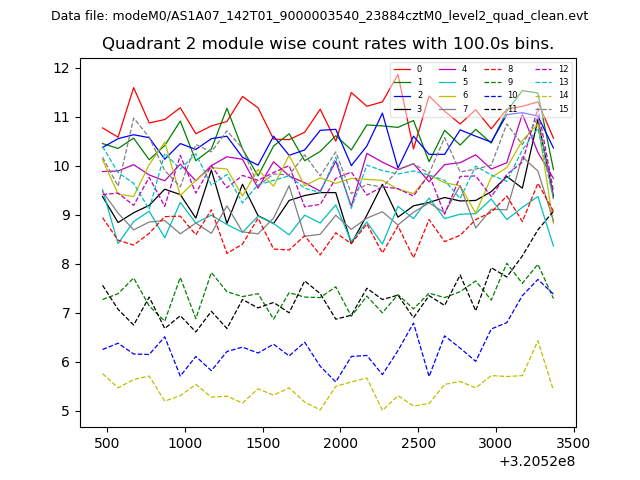
| Module-wise count rates for Quadrant B Data is divided into 100 sec bins |
 |
 |
| Module-wise count rates for Quadrant C Data is divided into 100 sec bins |
 |
 |
| Module-wise count rates for Quadrant D Data is divided into 100 sec bins |
 |
 |
| Parameter | Plot |
|---|---|
| CZT HV Monitor | 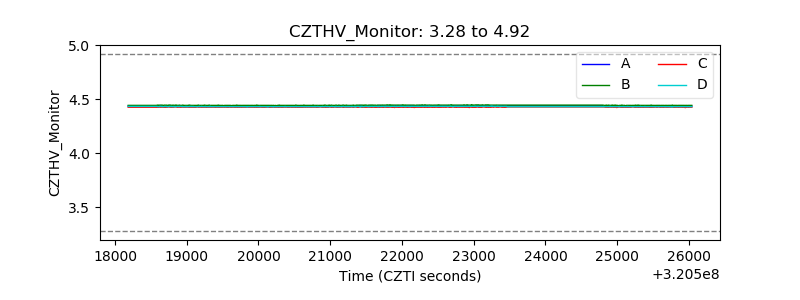 |
| D_VDD | 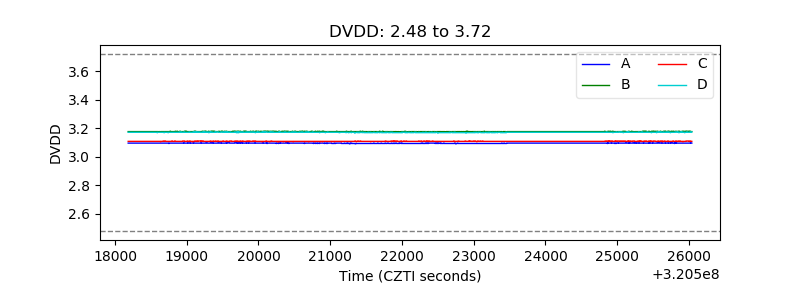 |
| Temperature 1 | 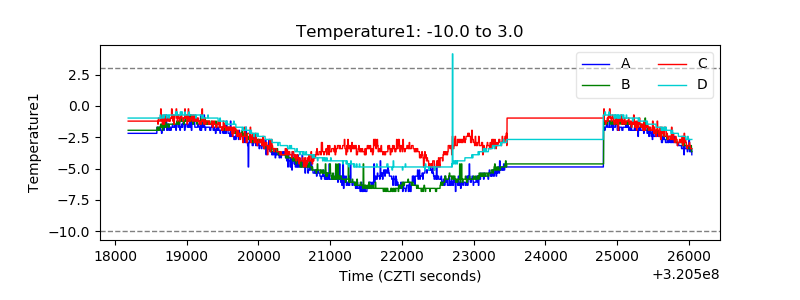 |
| Veto HV Monitor | 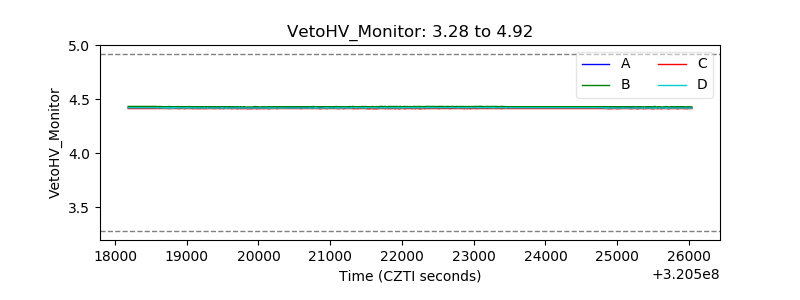 |
| Veto LLD | 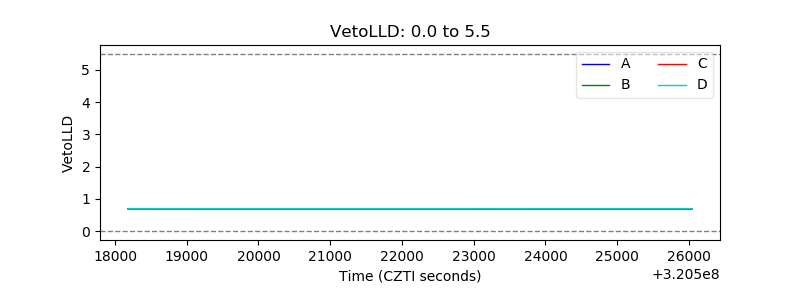 |
| Alpha Counter | 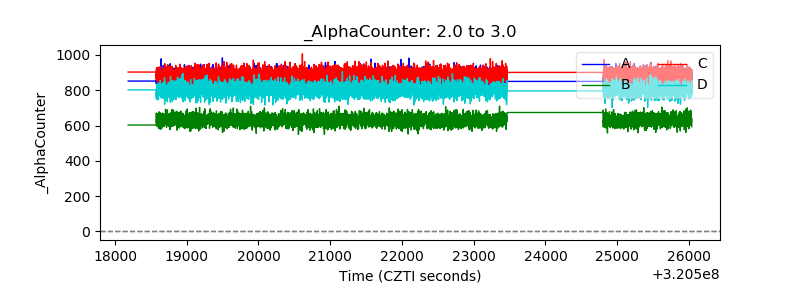 |
| _CPM_Rate | 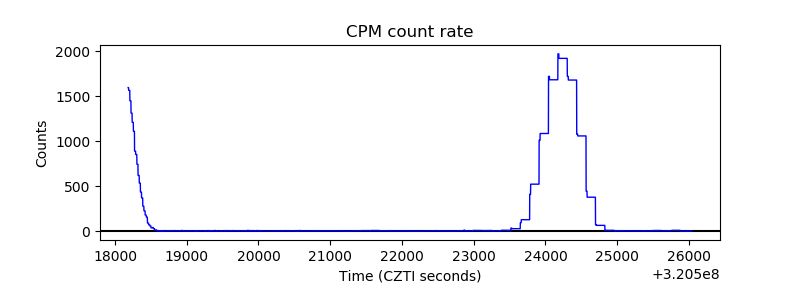 |
| CZT Counter | 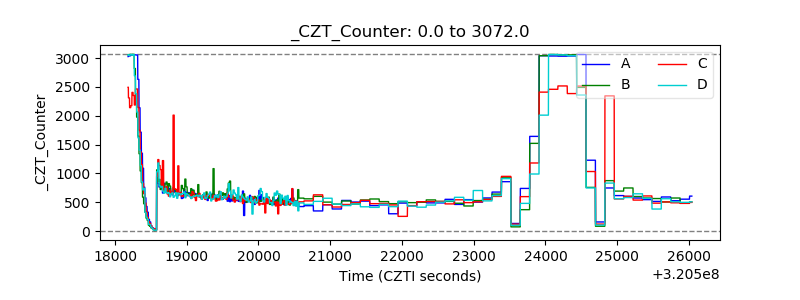 |
| +2.5 Volts monitor |  |
| +5 Volts monitor |  |
| _ROLL_ROT | 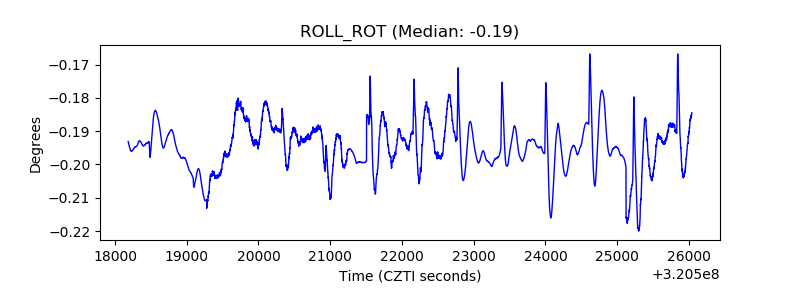 |
| _Roll_DEC | 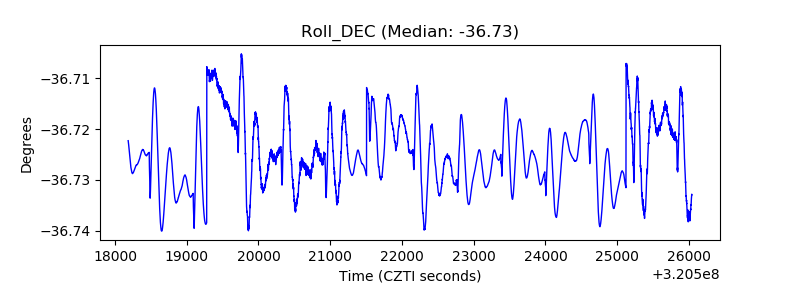 |
| _Roll_RA | 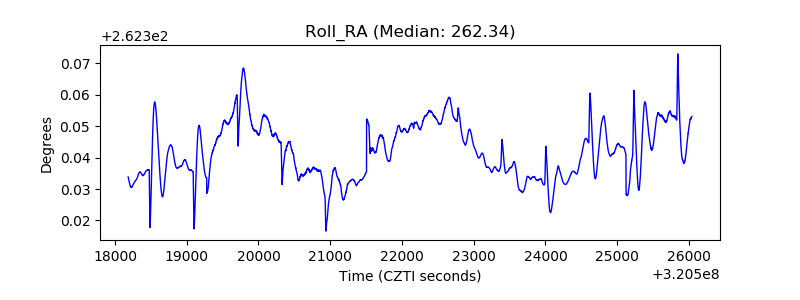 |
| Veto Counter | 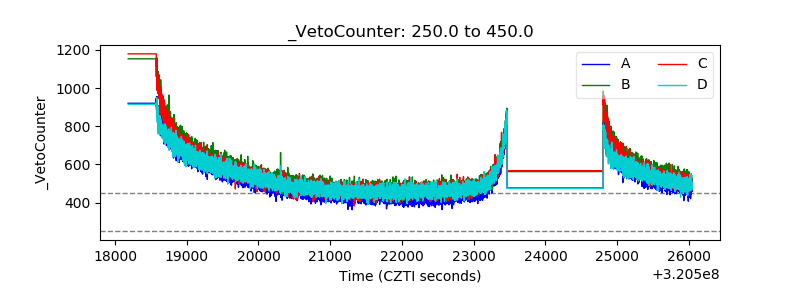 |