| Param | Original file | Final file |
|---|---|---|
| Filename | modeM0/AS1A07_142T01_9000003540_23886cztM0_level2.evt | modeM0/AS1A07_142T01_9000003540_23886cztM0_level2_quad_clean.evt |
| Size (bytes) | 477,169,920 | 91,630,080 |
| Size | 455.1 MB | 87.4 MB |
| Events in quadrant A | 3,336,837 | 589,511 |
| Events in quadrant B | 3,500,539 | 596,767 |
| Events in quadrant C | 3,580,400 | 561,090 |
| Events in quadrant D | 3,572,939 | 555,081 |
| Mode M9 | |||
|---|---|---|---|
| Quadrant | BADHDUFLAG | Total packets | Discarded packets |
| A | 0 | 17 | 0 |
| B | 0 | 18 | 0 |
| C | 0 | 18 | 0 |
| D | 0 | 18 | 0 |
| Mode M0 | |||
|---|---|---|---|
| Quadrant | BADHDUFLAG | Total packets | Discarded packets |
| A | 0 | 14080 | 2 |
| B | 0 | 14486 | 2 |
| C | 0 | 14757 | 2 |
| D | 0 | 15090 | 2 |
| Mode SS | |||
|---|---|---|---|
| Quadrant | BADHDUFLAG | Total packets | Discarded packets |
| A | 0 | 138 | 0 |
| B | 0 | 138 | 0 |
| C | 0 | 138 | 0 |
| D | 0 | 138 | 0 |
| Quadrant | Total seconds | Saturated seconds | Saturation percentage |
|---|---|---|---|
| A | 6778 | 77 | 1.136028% |
| B | 6778 | 105 | 1.549130% |
| C | 6778 | 202 | 2.980230% |
| D | 6778 | 73 | 1.077014% |
Noise dominated data is calculated using 1-second bins in cleaned event files. If a bin has >2000 counts, and if more than 50% of those come from <1% of pixels, then it is considered to be noise-dominated and hence unusable.
| Quadrant | # 1 sec bins | Bins with >0 counts | Bins with >2000 counts | High rate bins dominated by noise | Noise dominated (total time) | Noise dominated (detector-on time) | Marked lightcurve |
|---|---|---|---|---|---|---|---|
| A | 7583 | 6779 | 0 | 0 | 0.00% | 0.00% | 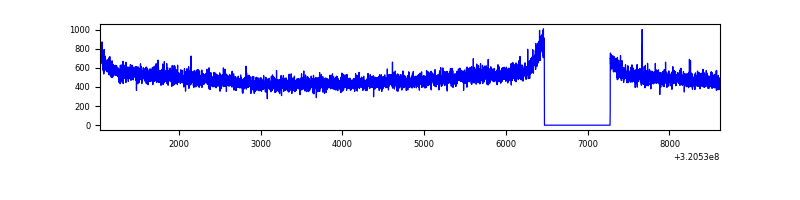 |
| B | 7583 | 6779 | 3 | 3 | 0.04% | 0.04% | 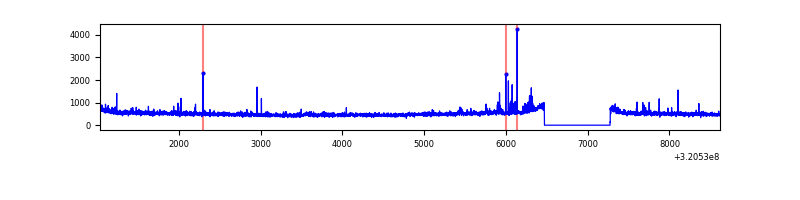 |
| C | 7583 | 6779 | 34 | 34 | 0.45% | 0.50% | 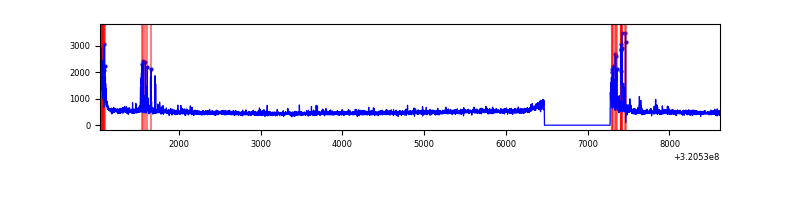 |
| D | 7583 | 6779 | 8 | 8 | 0.11% | 0.12% | 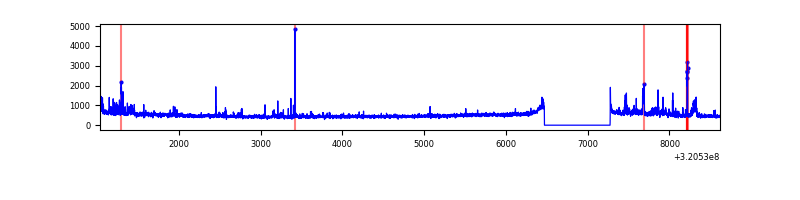 |
Top three noisy pixels from each quadrant. If the there are fewer than three noisy pixels in the level2.evt file, extra rows are filled as -1
| Pixel properties | Quadrant properties | ||||||
|---|---|---|---|---|---|---|---|
| Quadrant | DetID | PixID | Counts | Sigma | Mean | Median | Sigma |
| A | 13 | 254 | 11623 | 61.94 | 865 | 848 | 174.0 |
| A | 0 | 226 | 7431 | 37.84 | 865 | 848 | 174.0 |
| A | 3 | 137 | 7401 | 37.67 | 865 | 848 | 174.0 |
| B | 0 | 189 | 38556 | 232.43 | 863 | 843 | 162.3 |
| B | 15 | 33 | 22414 | 132.94 | 863 | 843 | 162.3 |
| B | 0 | 197 | 20032 | 118.26 | 863 | 843 | 162.3 |
| C | 0 | 10 | 269265 | 1411.76 | 816 | 822 | 190.1 |
| C | 14 | 238 | 130472 | 681.84 | 816 | 822 | 190.1 |
| C | 13 | 61 | 5653 | 25.41 | 816 | 822 | 190.1 |
| D | 8 | 195 | 170291 | 840.02 | 835 | 811 | 201.8 |
| D | 1 | 52 | 164228 | 809.97 | 835 | 811 | 201.8 |
| D | 13 | 174 | 31086 | 150.06 | 835 | 811 | 201.8 |
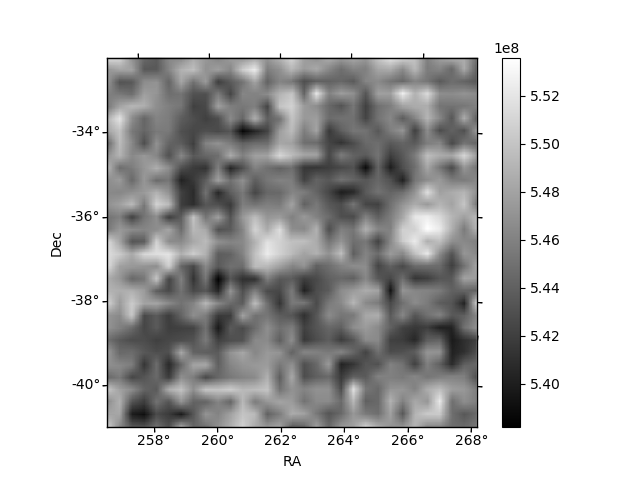
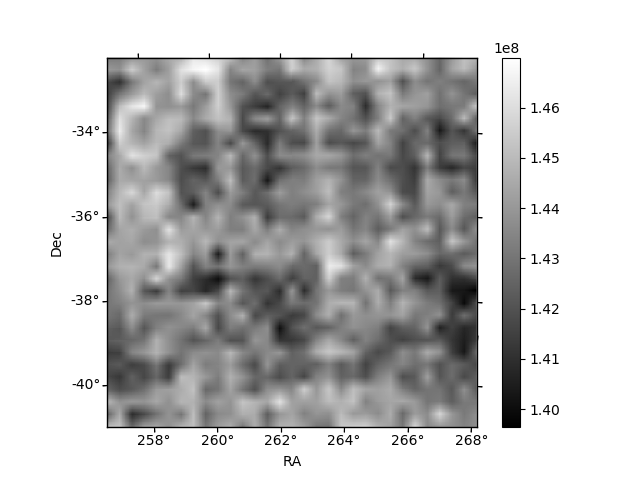
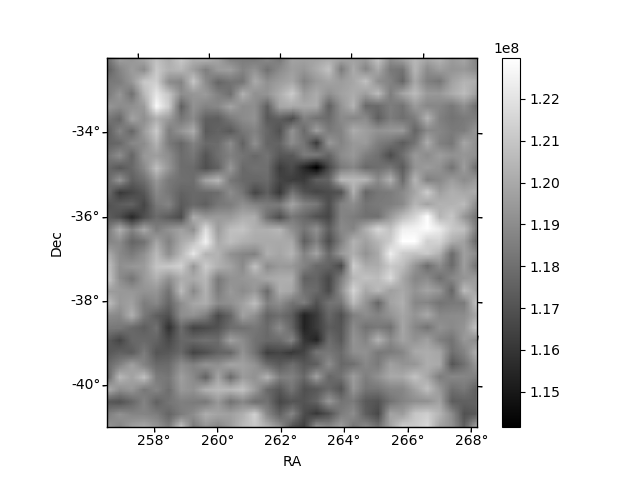
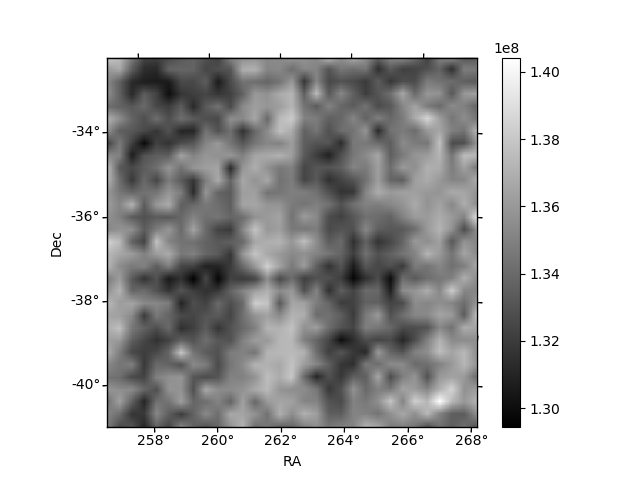
Histogram calculated using DETX and DETY for each event in the final _common_clean file
| Quadrant A | 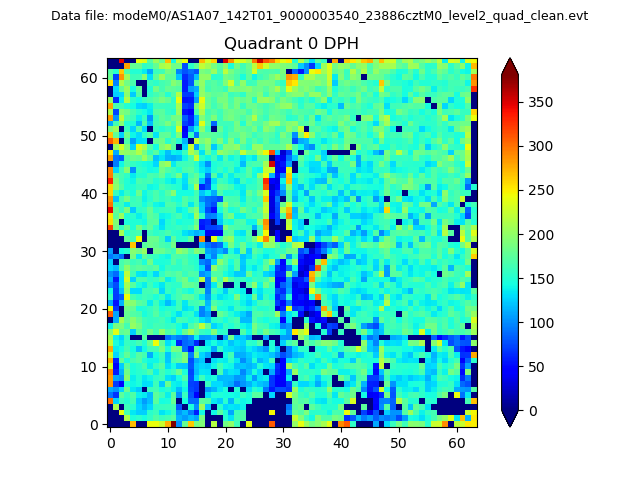 |
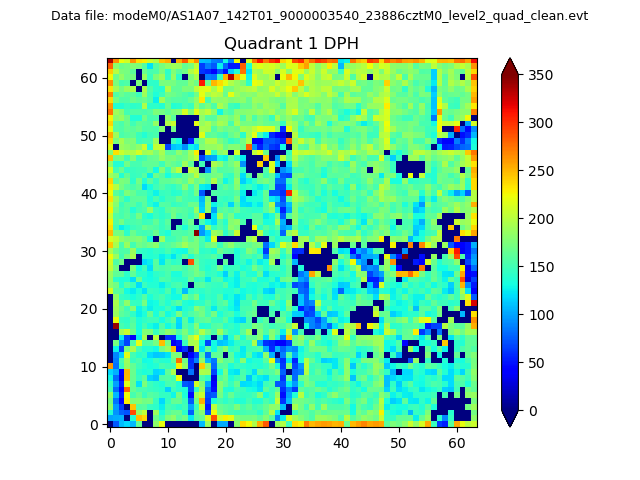 |
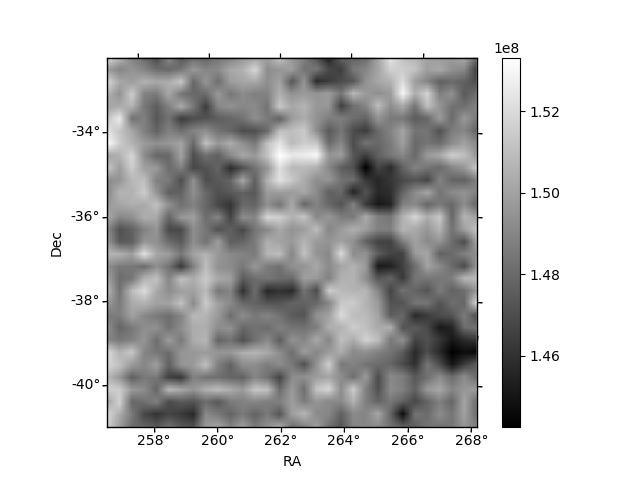
Quadrant B |
|---|---|---|---|
| Quadrant D | 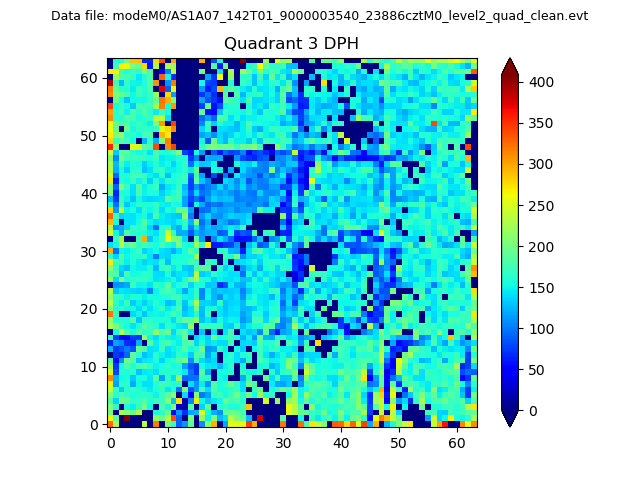 |
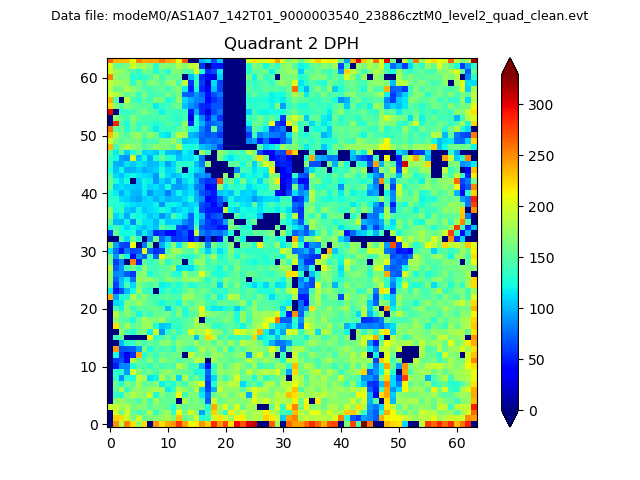 |
Quadrant C |
| Plot type | Count rate plots | Images |
|---|---|---|
| Comparison with Poisson distribution Blue bars denote a histogram of data divided into 1 sec bins. Red curve is a Poisson curve with rate = median count rate of data. |
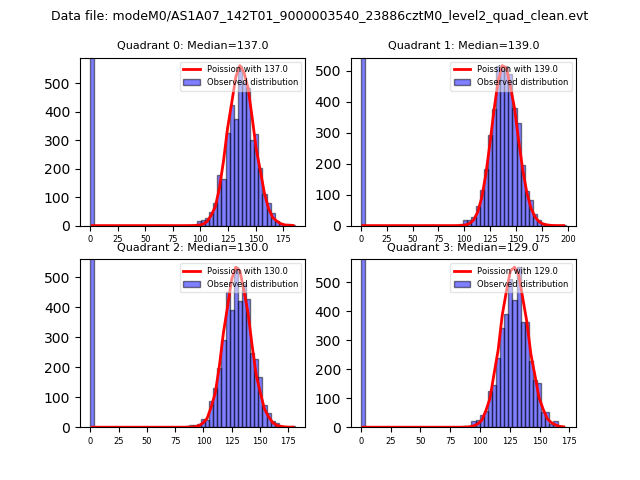 |
 |
| Quadrant-wise count rates Data is divided into 100 sec bins |
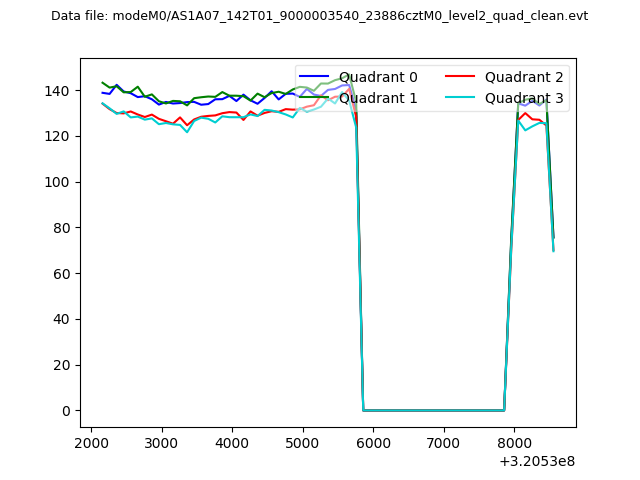 |
|
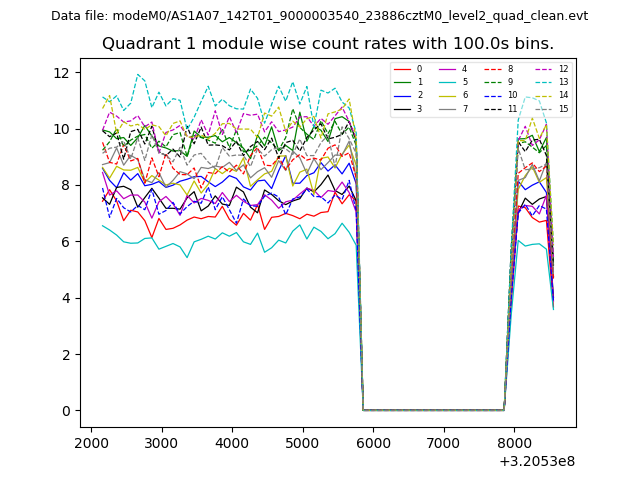
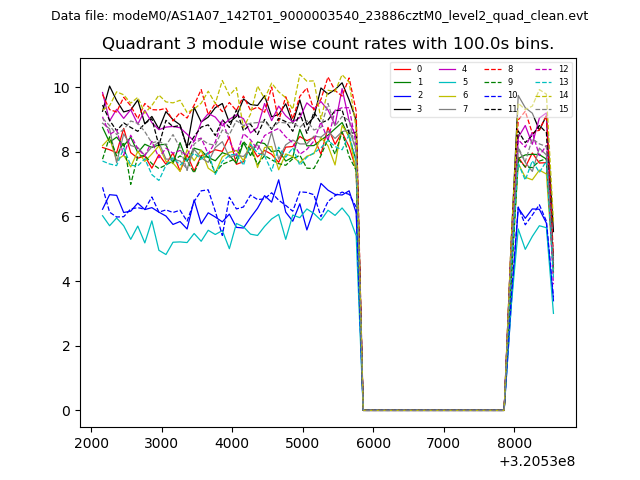
| Module-wise count rates for Quadrant A Data is divided into 100 sec bins |
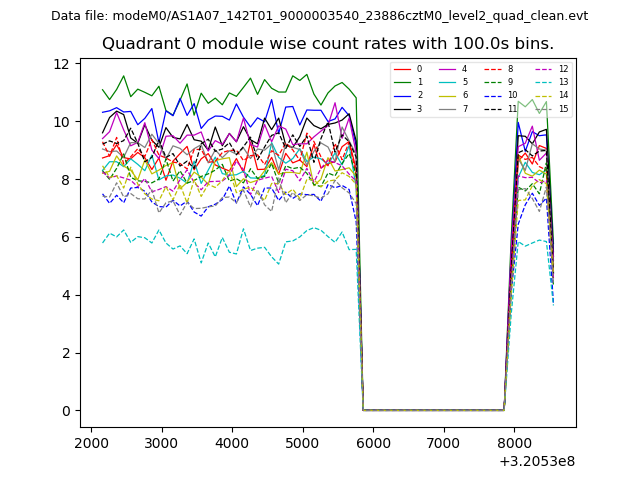 |
 |
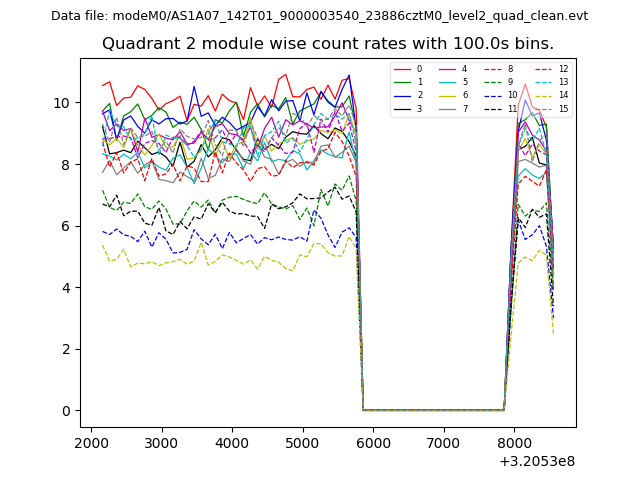
| Module-wise count rates for Quadrant B Data is divided into 100 sec bins |
 |
 |
| Module-wise count rates for Quadrant C Data is divided into 100 sec bins |
 |
 |
| Module-wise count rates for Quadrant D Data is divided into 100 sec bins |
 |
 |
| Parameter | Plot |
|---|---|
| CZT HV Monitor | 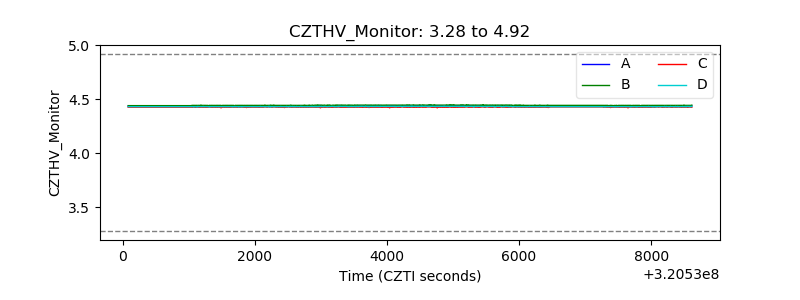 |
| D_VDD | 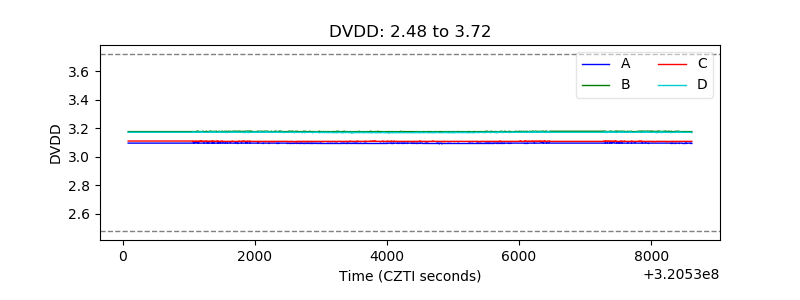 |
| Temperature 1 | 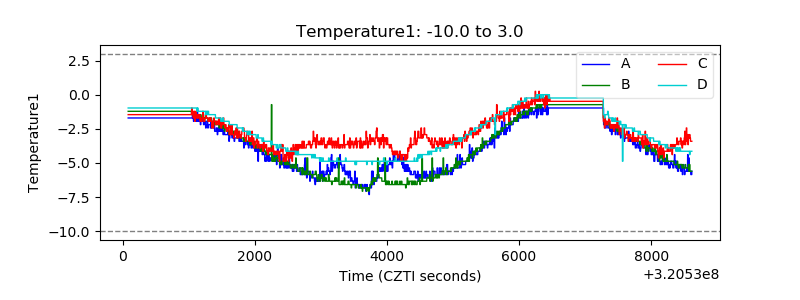 |
| Veto HV Monitor | 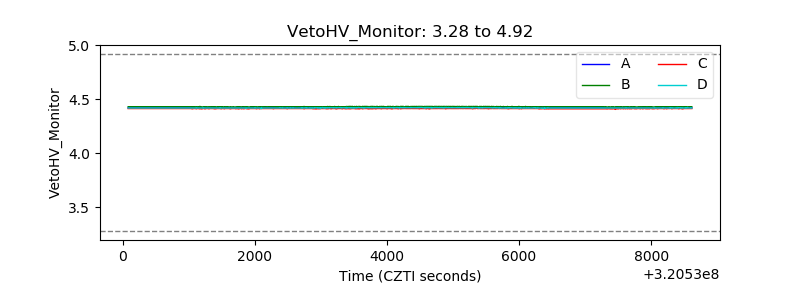 |
| Veto LLD | 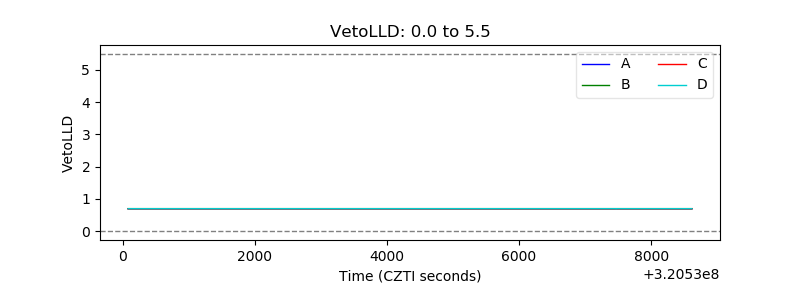 |
| Alpha Counter | 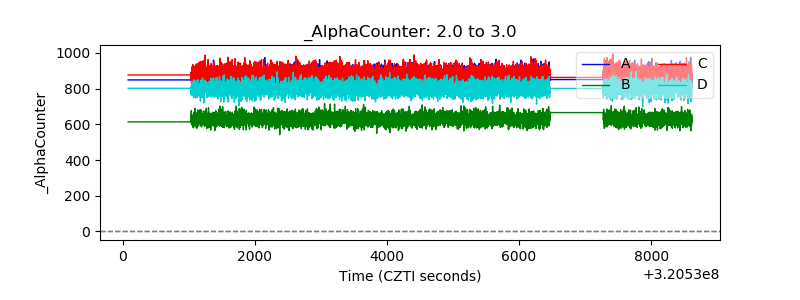 |
| _CPM_Rate | 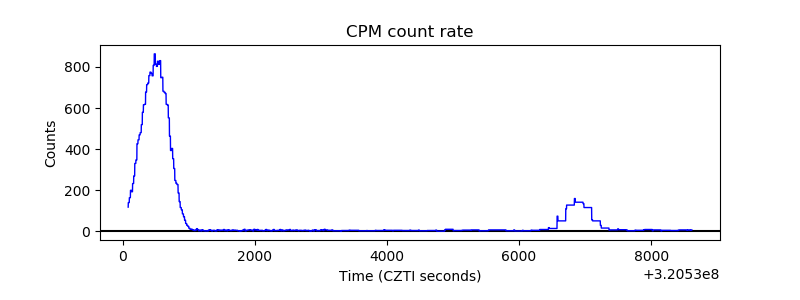 |
| CZT Counter | 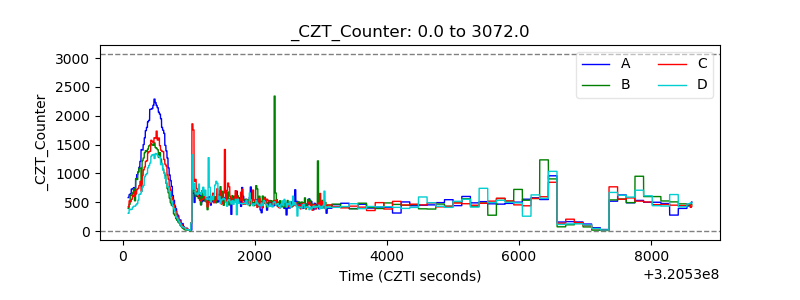 |
| +2.5 Volts monitor |  |
| +5 Volts monitor | 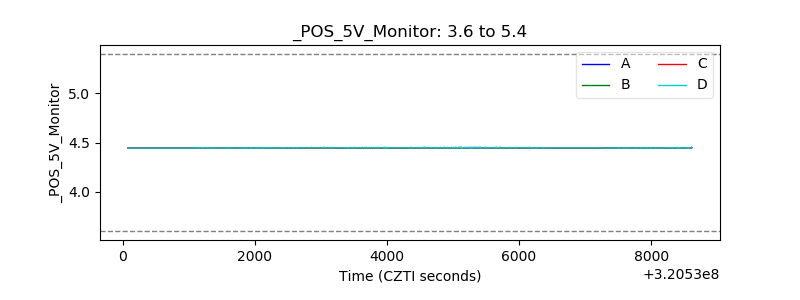 |
| _ROLL_ROT | 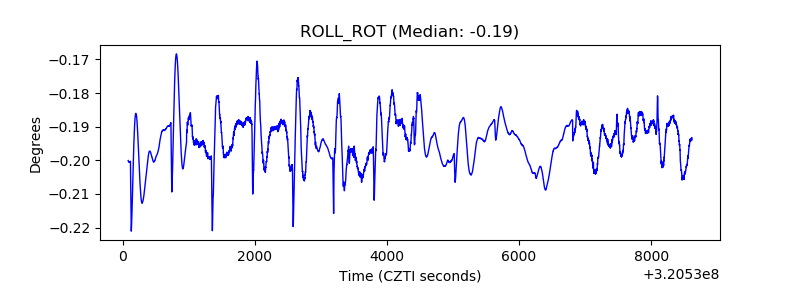 |
| _Roll_DEC | 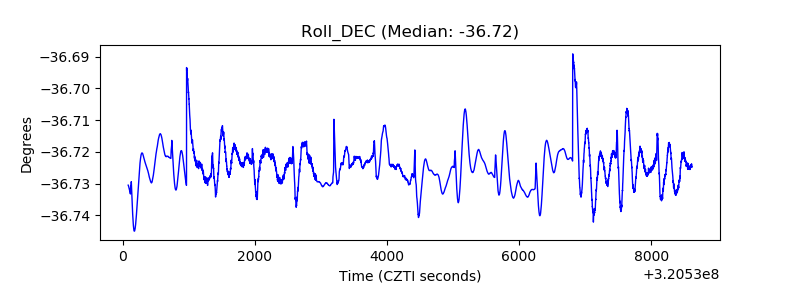 |
| _Roll_RA | 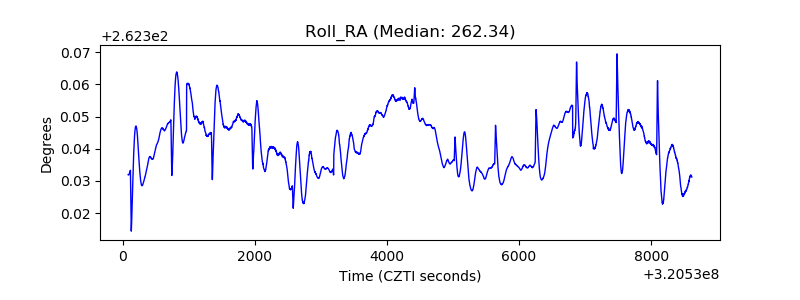 |
| Veto Counter | 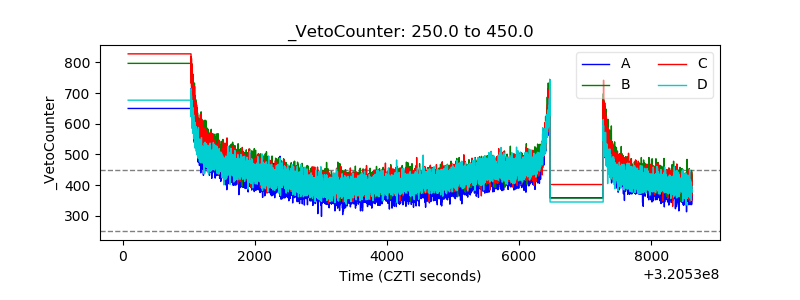 |