| Param | Original file | Final file |
|---|---|---|
| Filename | modeM0/AS1A07_142T01_9000003540_23887cztM0_level2.evt | modeM0/AS1A07_142T01_9000003540_23887cztM0_level2_quad_clean.evt |
| Size (bytes) | 527,788,800 | 98,539,200 |
| Size | 503.3 MB | 94.0 MB |
| Events in quadrant A | 3,501,866 | 634,813 |
| Events in quadrant B | 3,675,930 | 641,134 |
| Events in quadrant C | 4,333,445 | 599,128 |
| Events in quadrant D | 3,976,181 | 599,670 |
| Mode M9 | |||
|---|---|---|---|
| Quadrant | BADHDUFLAG | Total packets | Discarded packets |
| A | 0 | 8 | 0 |
| B | 0 | 9 | 0 |
| C | 0 | 9 | 0 |
| D | 0 | 9 | 0 |
| Mode M0 | |||
|---|---|---|---|
| Quadrant | BADHDUFLAG | Total packets | Discarded packets |
| A | 0 | 15038 | 2 |
| B | 0 | 15475 | 2 |
| C | 0 | 17495 | 2 |
| D | 0 | 16626 | 2 |
| Mode SS | |||
|---|---|---|---|
| Quadrant | BADHDUFLAG | Total packets | Discarded packets |
| A | 0 | 148 | 0 |
| B | 0 | 148 | 0 |
| C | 0 | 148 | 0 |
| D | 0 | 148 | 0 |
| Quadrant | Total seconds | Saturated seconds | Saturation percentage |
|---|---|---|---|
| A | 7318 | 17 | 0.232304% |
| B | 7318 | 58 | 0.792566% |
| C | 7317 | 310 | 4.236709% |
| D | 7317 | 52 | 0.710674% |
Noise dominated data is calculated using 1-second bins in cleaned event files. If a bin has >2000 counts, and if more than 50% of those come from <1% of pixels, then it is considered to be noise-dominated and hence unusable.
| Quadrant | # 1 sec bins | Bins with >0 counts | Bins with >2000 counts | High rate bins dominated by noise | Noise dominated (total time) | Noise dominated (detector-on time) | Marked lightcurve |
|---|---|---|---|---|---|---|---|
| A | 7733 | 7319 | 0 | 0 | 0.00% | 0.00% | 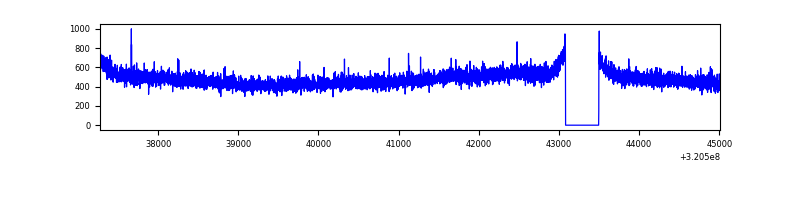 |
| B | 7733 | 7319 | 3 | 3 | 0.04% | 0.04% | 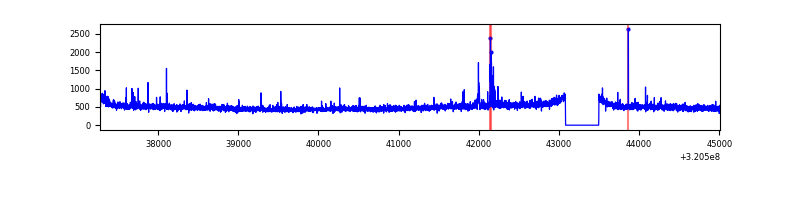 |
| C | 7732 | 7318 | 134 | 134 | 1.73% | 1.83% | 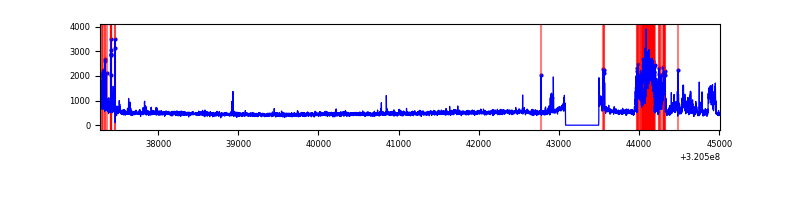 |
| D | 7732 | 7318 | 19 | 19 | 0.25% | 0.26% | 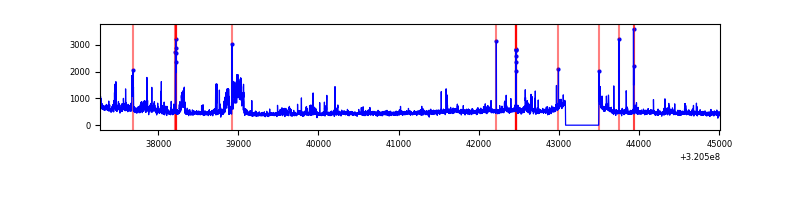 |
Top three noisy pixels from each quadrant. If the there are fewer than three noisy pixels in the level2.evt file, extra rows are filled as -1
| Pixel properties | Quadrant properties | ||||||
|---|---|---|---|---|---|---|---|
| Quadrant | DetID | PixID | Counts | Sigma | Mean | Median | Sigma |
| A | 13 | 254 | 13581 | 68.75 | 907 | 885 | 184.7 |
| A | 3 | 137 | 7796 | 37.42 | 907 | 885 | 184.7 |
| A | 0 | 226 | 7733 | 37.08 | 907 | 885 | 184.7 |
| B | 15 | 33 | 40202 | 228.11 | 907 | 887 | 172.4 |
| B | 0 | 197 | 28967 | 162.92 | 907 | 887 | 172.4 |
| B | 12 | 111 | 20444 | 113.47 | 907 | 887 | 172.4 |
| C | 0 | 10 | 854335 | 4273.83 | 856 | 860 | 199.7 |
| C | 14 | 238 | 135489 | 674.16 | 856 | 860 | 199.7 |
| C | 7 | 247 | 7017 | 30.83 | 856 | 860 | 199.7 |
| D | 8 | 195 | 351874 | 1636.69 | 877 | 851 | 214.5 |
| D | 1 | 52 | 190159 | 882.67 | 877 | 851 | 214.5 |
| D | 13 | 174 | 41890 | 191.35 | 877 | 851 | 214.5 |
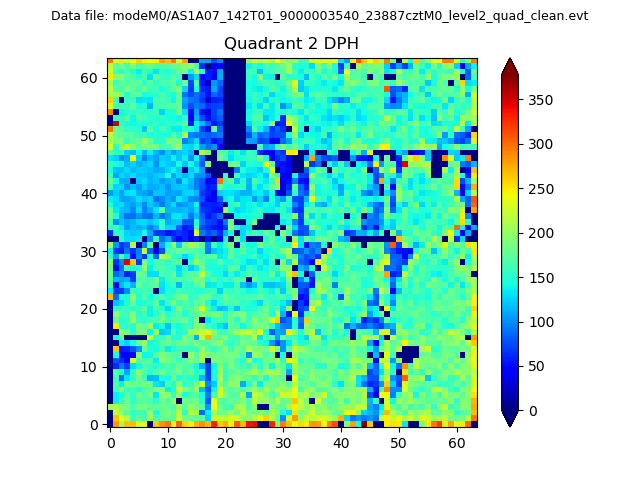
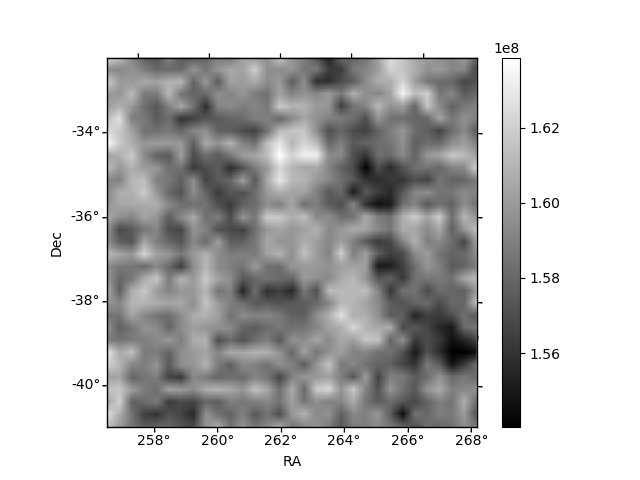
Histogram calculated using DETX and DETY for each event in the final _common_clean file
| Quadrant A | 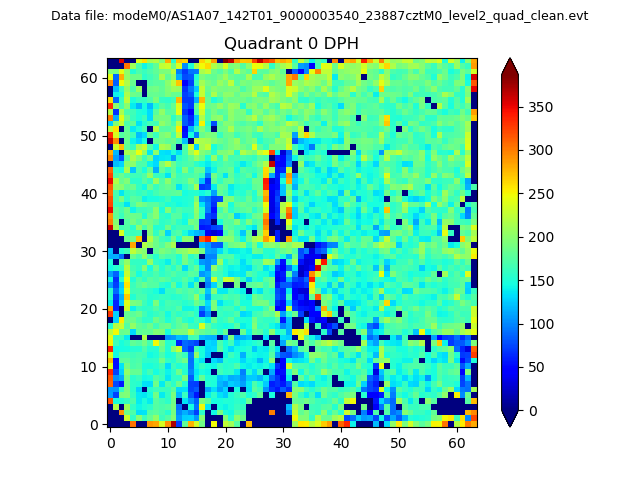 |
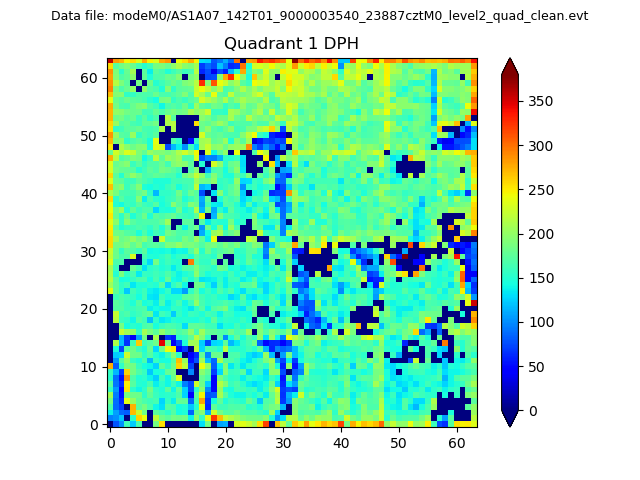 |
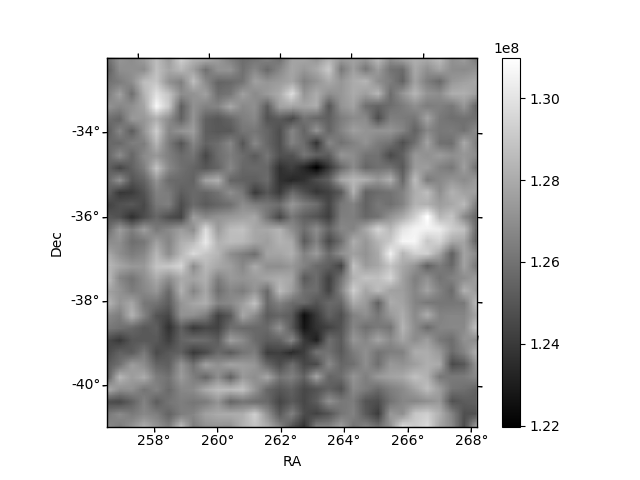
Quadrant B |
|---|---|---|---|
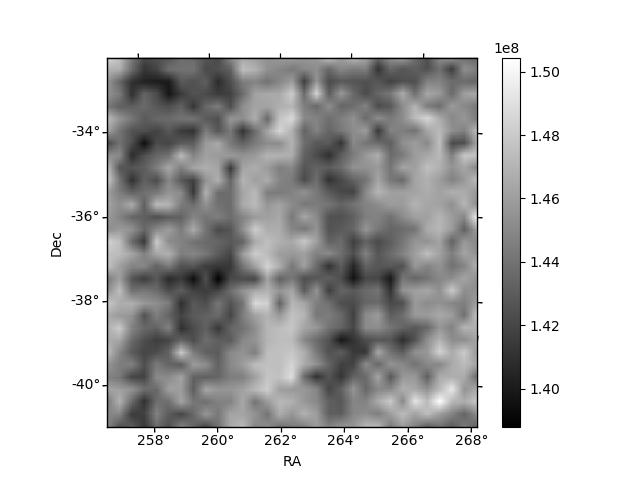
| Quadrant D | 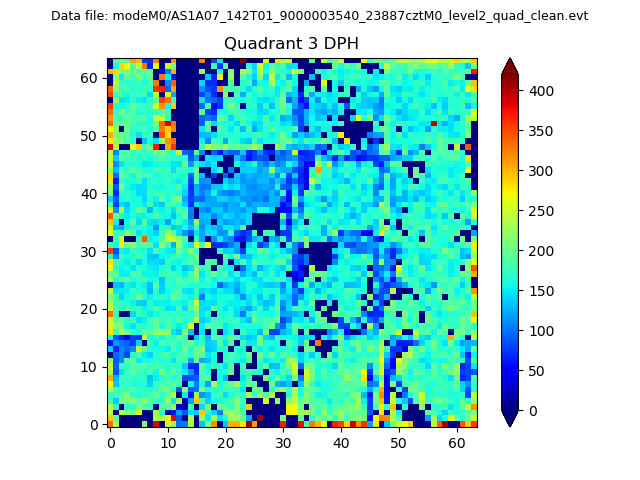 |
 |
Quadrant C |
| Plot type | Count rate plots | Images |
|---|---|---|
| Comparison with Poisson distribution Blue bars denote a histogram of data divided into 1 sec bins. Red curve is a Poisson curve with rate = median count rate of data. |
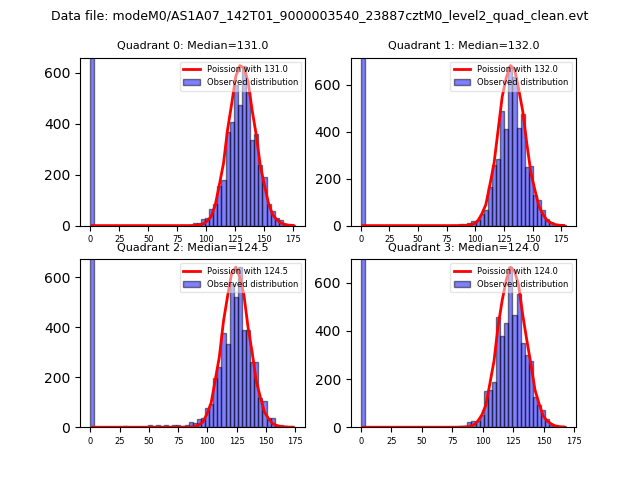 |
 |
| Quadrant-wise count rates Data is divided into 100 sec bins |
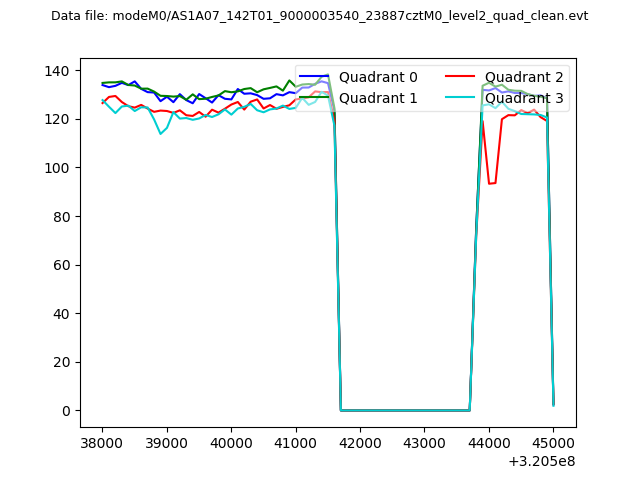 |
|
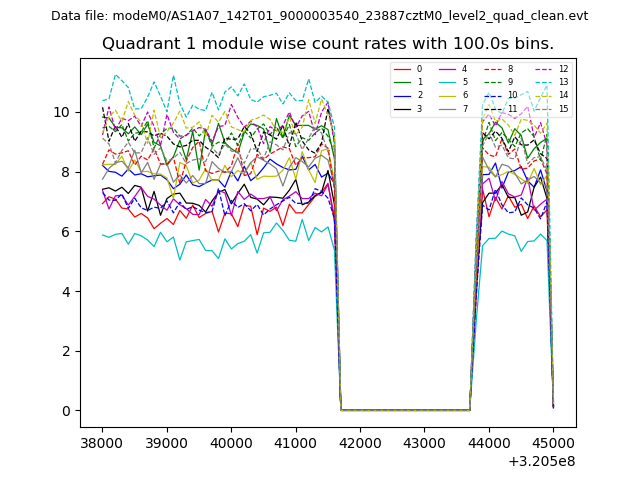
| Module-wise count rates for Quadrant A Data is divided into 100 sec bins |
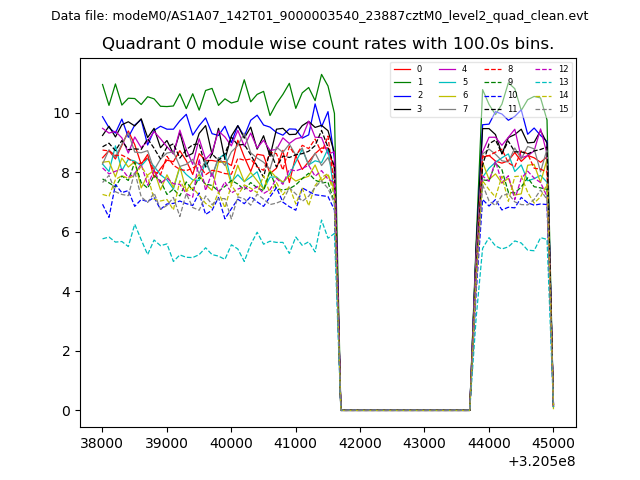 |
 |
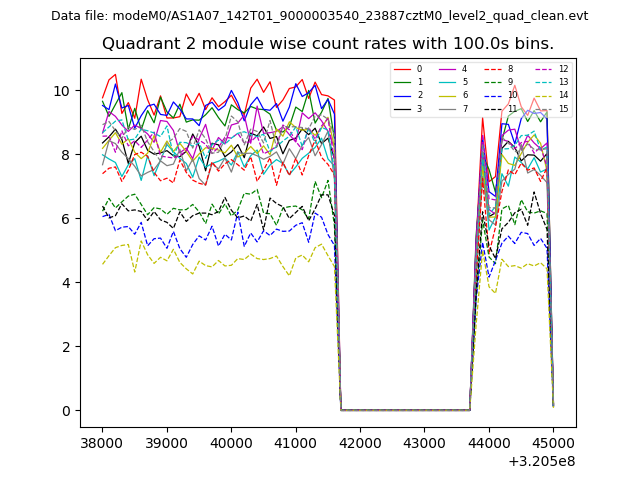
| Module-wise count rates for Quadrant B Data is divided into 100 sec bins |
 |
 |
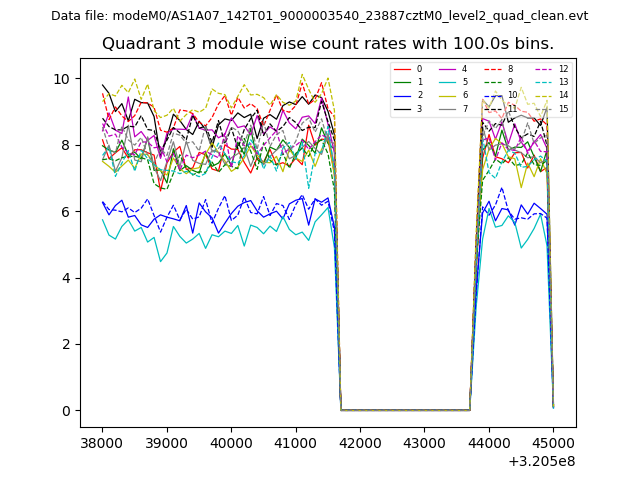
| Module-wise count rates for Quadrant C Data is divided into 100 sec bins |
 |
 |
| Module-wise count rates for Quadrant D Data is divided into 100 sec bins |
 |
 |
| Parameter | Plot |
|---|---|
| CZT HV Monitor | 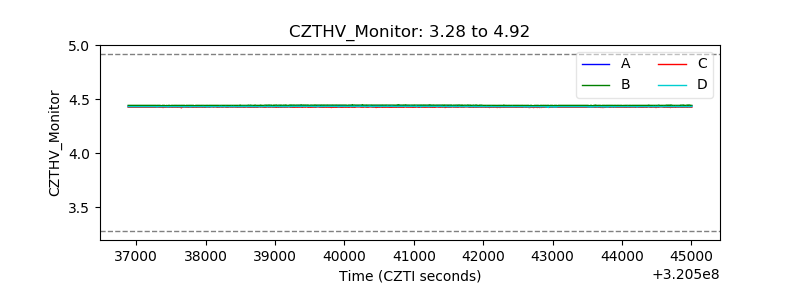 |
| D_VDD | 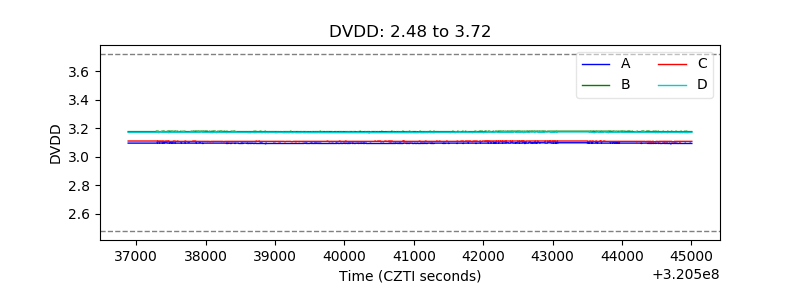 |
| Temperature 1 | 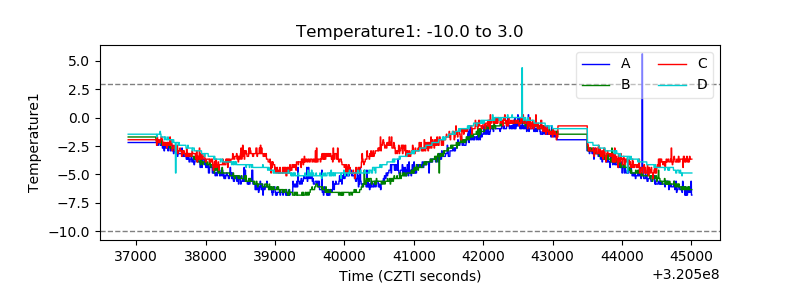 |
| Veto HV Monitor |  |
| Veto LLD | 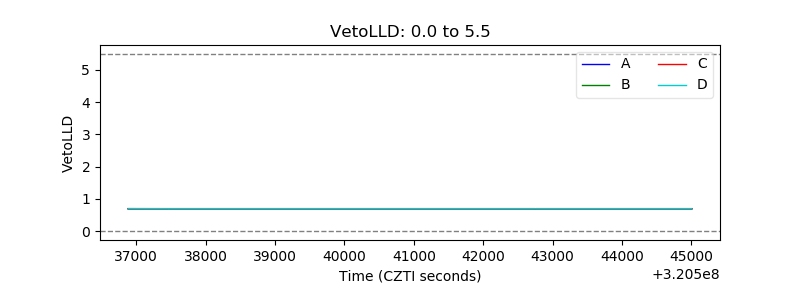 |
| Alpha Counter | 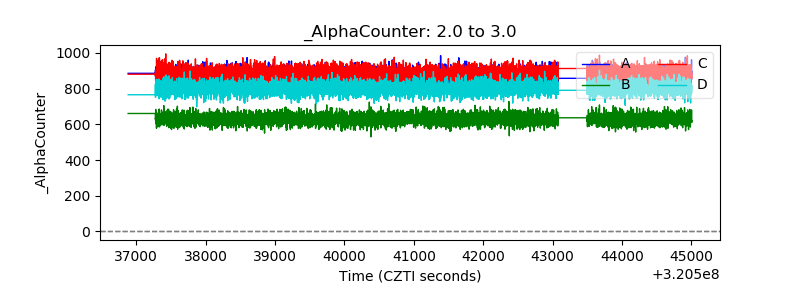 |
| _CPM_Rate | 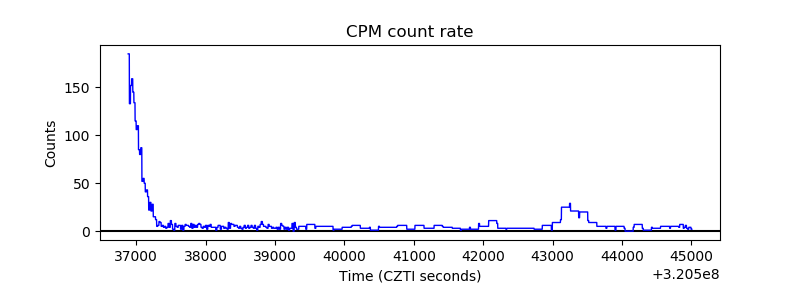 |
| CZT Counter | 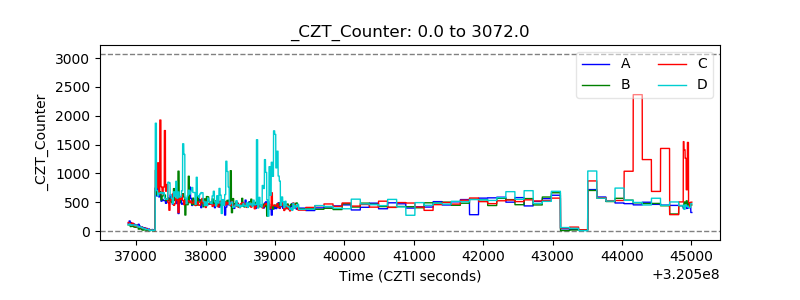 |
| +2.5 Volts monitor |  |
| +5 Volts monitor |  |
| _ROLL_ROT |  |
| _Roll_DEC |  |
| _Roll_RA | 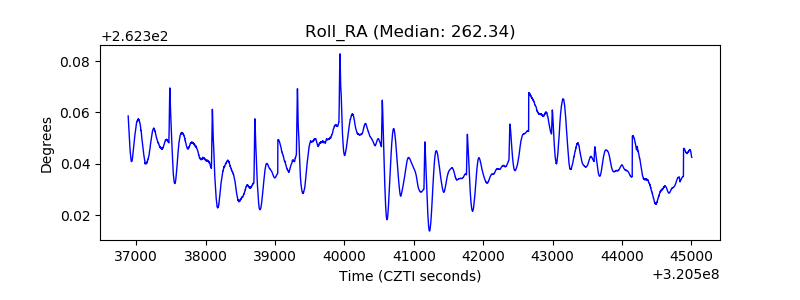 |
| Veto Counter | 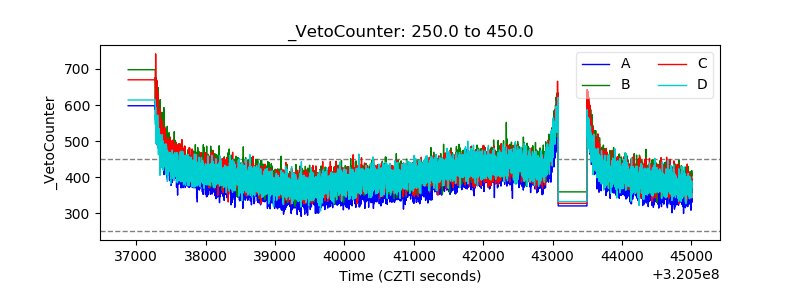 |