| Param | Original file | Final file |
|---|---|---|
| Filename | modeM0/AS1A07_142T01_9000003540_23888cztM0_level2.evt | modeM0/AS1A07_142T01_9000003540_23888cztM0_level2_quad_clean.evt |
| Size (bytes) | 542,350,080 | 105,102,720 |
| Size | 517.2 MB | 100.2 MB |
| Events in quadrant A | 3,633,656 | 677,787 |
| Events in quadrant B | 3,806,057 | 688,076 |
| Events in quadrant C | 4,489,608 | 644,003 |
| Events in quadrant D | 3,979,692 | 644,150 |
| Mode M9 | |||
|---|---|---|---|
| Quadrant | BADHDUFLAG | Total packets | Discarded packets |
| A | 0 | 2 | 0 |
| B | 0 | 3 | 0 |
| C | 0 | 3 | 0 |
| D | 0 | 3 | 0 |
| Mode M0 | |||
|---|---|---|---|
| Quadrant | BADHDUFLAG | Total packets | Discarded packets |
| A | 0 | 15700 | 2 |
| B | 0 | 16106 | 2 |
| C | 0 | 18153 | 2 |
| D | 0 | 16964 | 2 |
| Mode SS | |||
|---|---|---|---|
| Quadrant | BADHDUFLAG | Total packets | Discarded packets |
| A | 0 | 154 | 0 |
| B | 0 | 154 | 0 |
| C | 0 | 154 | 0 |
| D | 0 | 154 | 0 |
| Quadrant | Total seconds | Saturated seconds | Saturation percentage |
|---|---|---|---|
| A | 7603 | 50 | 0.657635% |
| B | 7603 | 100 | 1.315270% |
| C | 7603 | 362 | 4.761278% |
| D | 7603 | 78 | 1.025911% |
Noise dominated data is calculated using 1-second bins in cleaned event files. If a bin has >2000 counts, and if more than 50% of those come from <1% of pixels, then it is considered to be noise-dominated and hence unusable.
| Quadrant | # 1 sec bins | Bins with >0 counts | Bins with >2000 counts | High rate bins dominated by noise | Noise dominated (total time) | Noise dominated (detector-on time) | Marked lightcurve |
|---|---|---|---|---|---|---|---|
| A | 7788 | 7605 | 0 | 0 | 0.00% | 0.00% |  |
| B | 7788 | 7605 | 4 | 4 | 0.05% | 0.05% |  |
| C | 7788 | 7605 | 141 | 141 | 1.81% | 1.85% |  |
| D | 7788 | 7605 | 19 | 19 | 0.24% | 0.25% |  |
Top three noisy pixels from each quadrant. If the there are fewer than three noisy pixels in the level2.evt file, extra rows are filled as -1
| Pixel properties | Quadrant properties | ||||||
|---|---|---|---|---|---|---|---|
| Quadrant | DetID | PixID | Counts | Sigma | Mean | Median | Sigma |
| A | 13 | 254 | 13982 | 68.66 | 940 | 920 | 190.2 |
| A | 3 | 137 | 8252 | 38.54 | 940 | 920 | 190.2 |
| A | 0 | 226 | 8098 | 37.73 | 940 | 920 | 190.2 |
| B | 15 | 33 | 27777 | 148.67 | 943 | 920 | 180.6 |
| B | 0 | 189 | 24459 | 130.3 | 943 | 920 | 180.6 |
| B | 12 | 111 | 21592 | 114.43 | 943 | 920 | 180.6 |
| C | 0 | 10 | 859407 | 4073.72 | 894 | 900 | 210.7 |
| C | 14 | 238 | 140168 | 660.84 | 894 | 900 | 210.7 |
| C | 13 | 61 | 6294 | 25.6 | 894 | 900 | 210.7 |
| D | 1 | 52 | 231827 | 1023.1 | 915 | 888 | 225.7 |
| D | 8 | 195 | 201054 | 886.77 | 915 | 888 | 225.7 |
| D | 2 | 234 | 38513 | 166.68 | 915 | 888 | 225.7 |
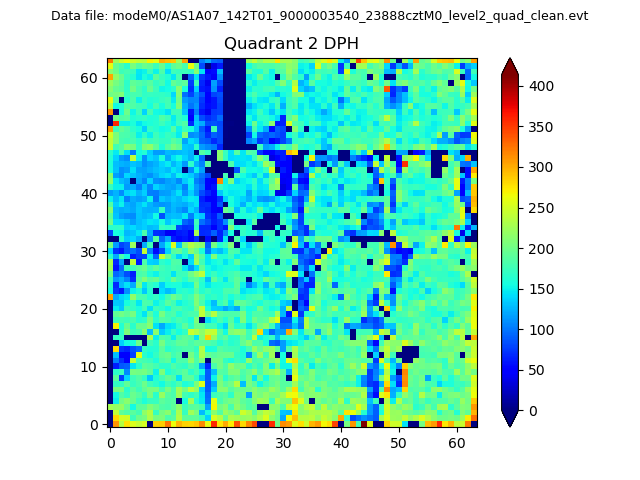
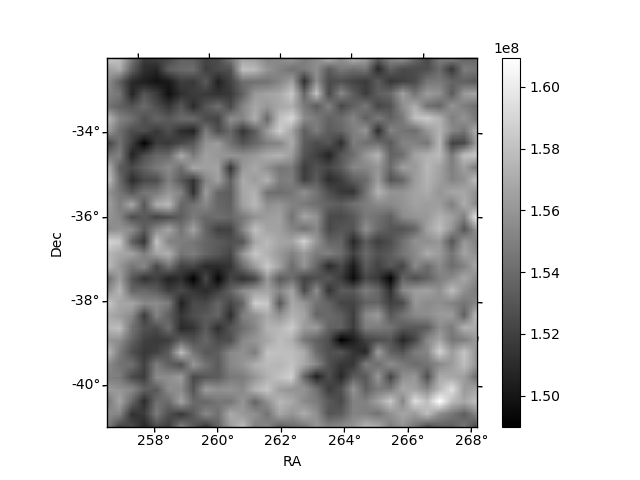
Histogram calculated using DETX and DETY for each event in the final _common_clean file
| Quadrant A | 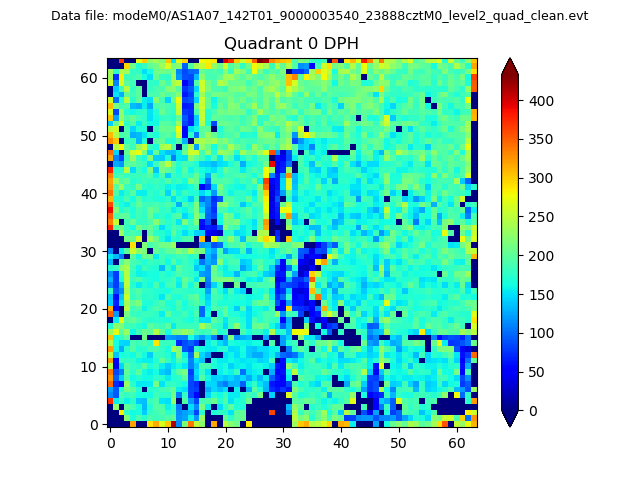 |
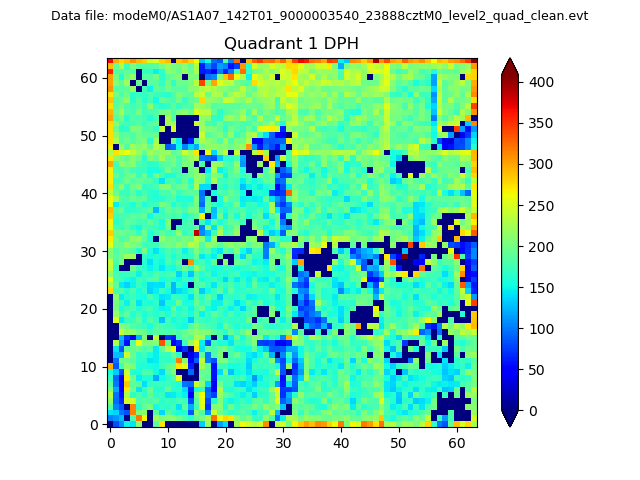 |
Quadrant B |
|---|---|---|---|
| Quadrant D | 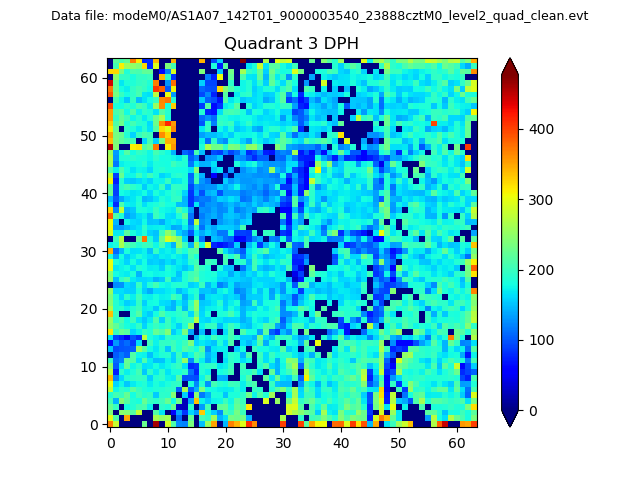 |
 |
Quadrant C |
| Plot type | Count rate plots | Images |
|---|---|---|
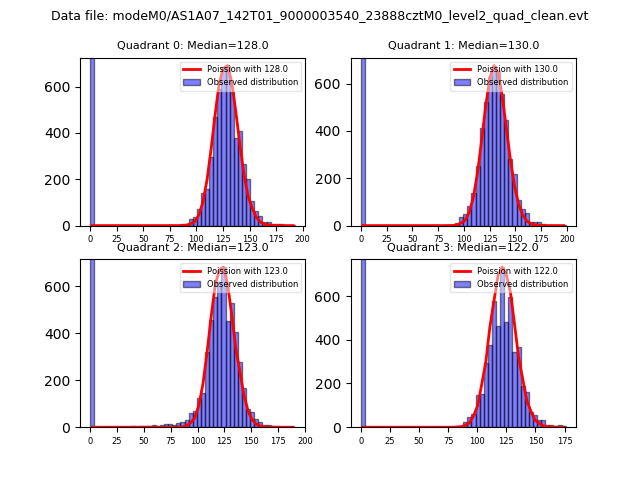
| Comparison with Poisson distribution Blue bars denote a histogram of data divided into 1 sec bins. Red curve is a Poisson curve with rate = median count rate of data. |
 |
 |
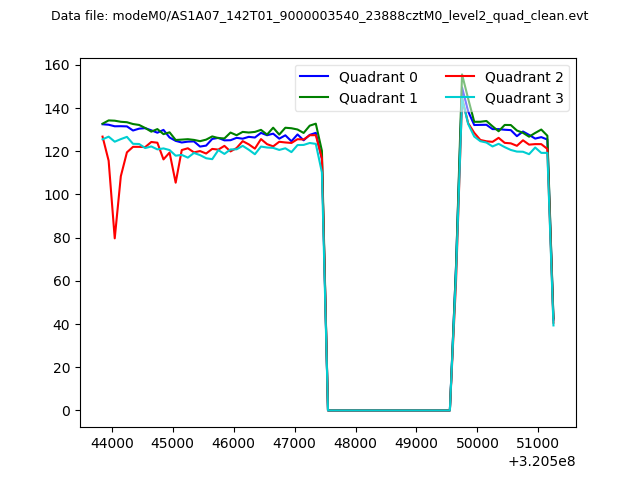
| Quadrant-wise count rates Data is divided into 100 sec bins |
 |
|
| Module-wise count rates for Quadrant A Data is divided into 100 sec bins |
 |
 |
| Module-wise count rates for Quadrant B Data is divided into 100 sec bins |
 |
 |
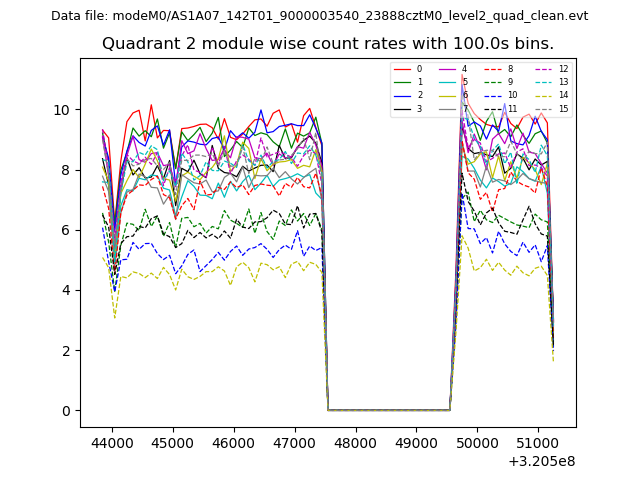
| Module-wise count rates for Quadrant C Data is divided into 100 sec bins |
 |
 |
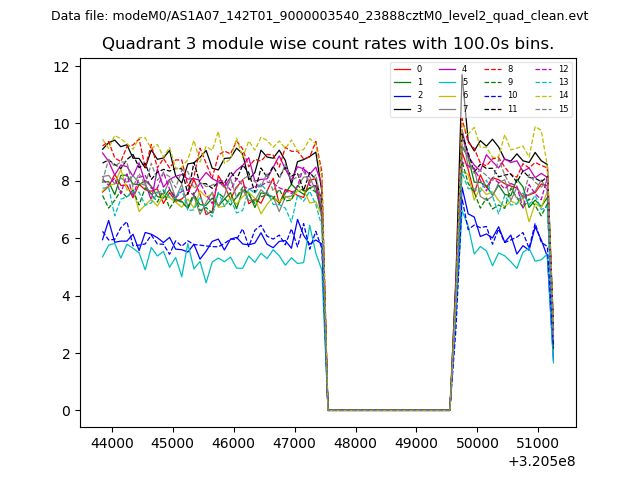
| Module-wise count rates for Quadrant D Data is divided into 100 sec bins |
 |
 |
| Parameter | Plot |
|---|---|
| CZT HV Monitor |  |
| D_VDD | 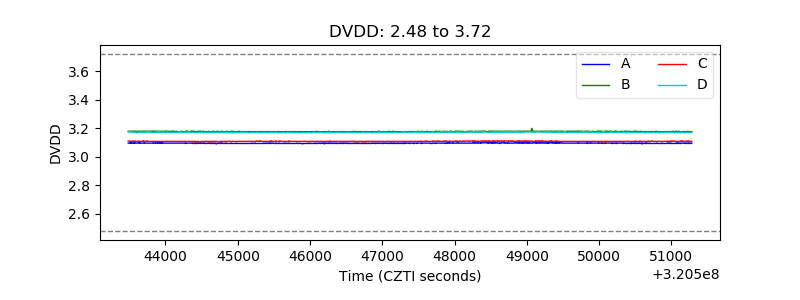 |
| Temperature 1 | 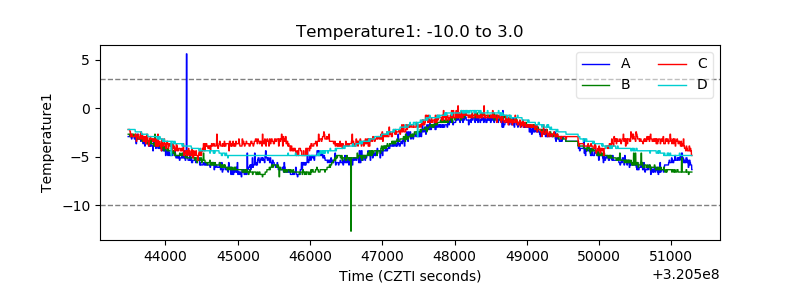 |
| Veto HV Monitor | 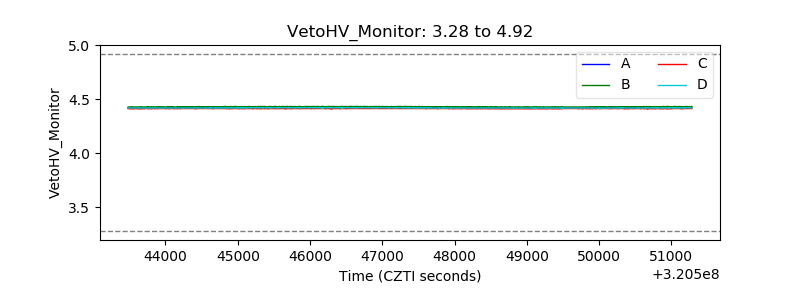 |
| Veto LLD | 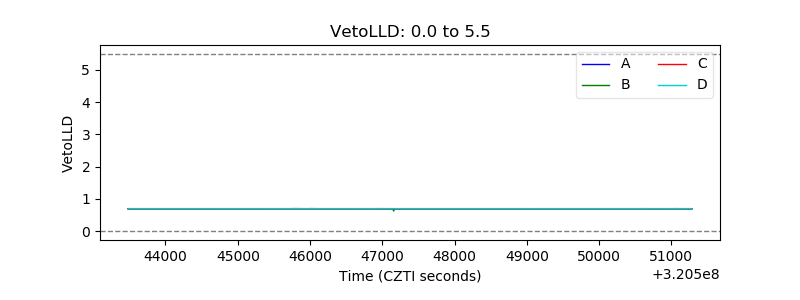 |
| Alpha Counter | 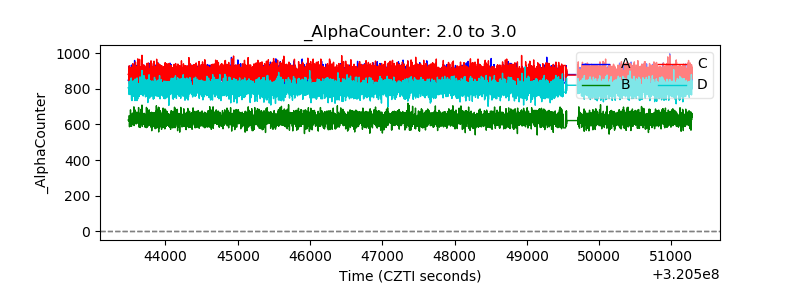 |
| _CPM_Rate | 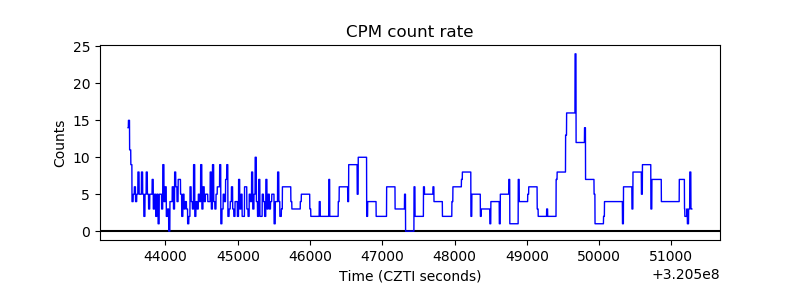 |
| CZT Counter | 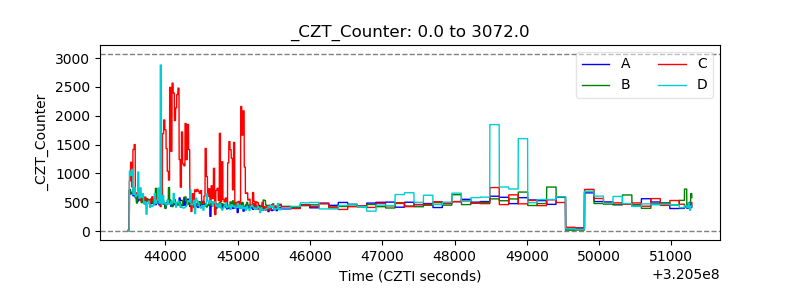 |
| +2.5 Volts monitor |  |
| +5 Volts monitor |  |
| _ROLL_ROT |  |
| _Roll_DEC | 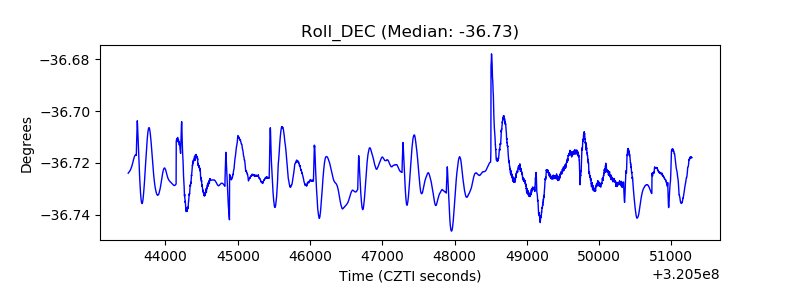 |
| _Roll_RA | 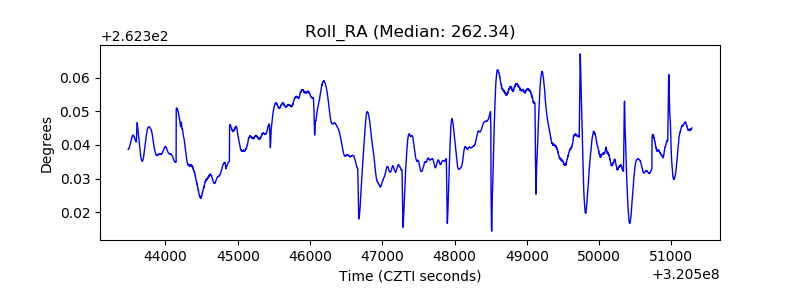 |
| Veto Counter | 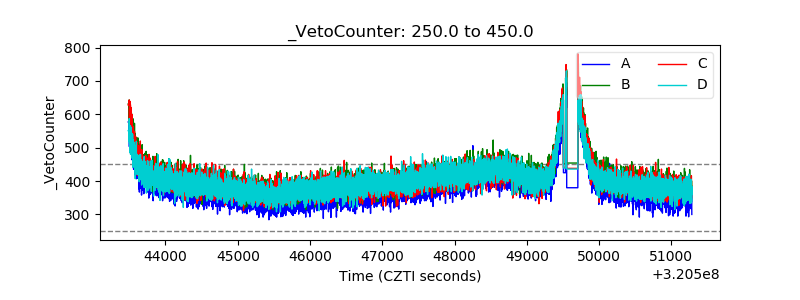 |