| Param | Original file | Final file |
|---|---|---|
| Filename | modeM0/AS1A07_142T01_9000003540_23893cztM0_level2.evt | modeM0/AS1A07_142T01_9000003540_23893cztM0_level2_quad_clean.evt |
| Size (bytes) | 1,785,908,160 | 315,743,040 |
| Size | 1.7 GB | 301.1 MB |
| Events in quadrant A | 11,506,401 | 2,026,504 |
| Events in quadrant B | 12,103,955 | 2,055,652 |
| Events in quadrant C | 11,759,270 | 1,973,656 |
| Events in quadrant D | 17,072,978 | 1,832,356 |
| Mode M9 | |||
|---|---|---|---|
| Quadrant | BADHDUFLAG | Total packets | Discarded packets |
| A | 0 | 23 | 0 |
| B | 0 | 23 | 0 |
| C | 0 | 23 | 0 |
| D | 0 | 23 | 0 |
| Mode M0 | |||
|---|---|---|---|
| Quadrant | BADHDUFLAG | Total packets | Discarded packets |
| A | 0 | 49715 | 5 |
| B | 0 | 51234 | 5 |
| C | 0 | 50022 | 5 |
| D | 0 | 66806 | 5 |
| Mode SS | |||
|---|---|---|---|
| Quadrant | BADHDUFLAG | Total packets | Discarded packets |
| A | 0 | 496 | 0 |
| B | 0 | 496 | 0 |
| C | 0 | 496 | 0 |
| D | 0 | 496 | 0 |
| Quadrant | Total seconds | Saturated seconds | Saturation percentage |
|---|---|---|---|
| A | 24334 | 172 | 0.706830% |
| B | 24335 | 271 | 1.113622% |
| C | 24335 | 379 | 1.557428% |
| D | 24335 | 1770 | 7.273474% |
Noise dominated data is calculated using 1-second bins in cleaned event files. If a bin has >2000 counts, and if more than 50% of those come from <1% of pixels, then it is considered to be noise-dominated and hence unusable.
| Quadrant | # 1 sec bins | Bins with >0 counts | Bins with >2000 counts | High rate bins dominated by noise | Noise dominated (total time) | Noise dominated (detector-on time) | Marked lightcurve |
|---|---|---|---|---|---|---|---|
| A | 26698 | 24335 | 0 | 0 | 0.00% | 0.00% | 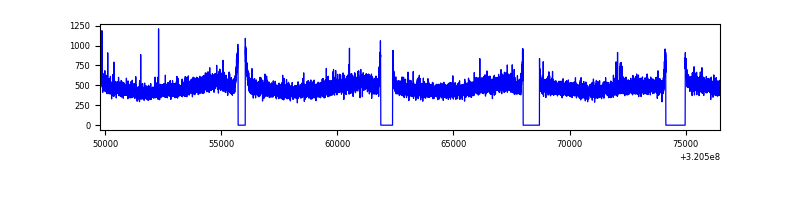 |
| B | 26700 | 24338 | 26 | 26 | 0.10% | 0.11% | 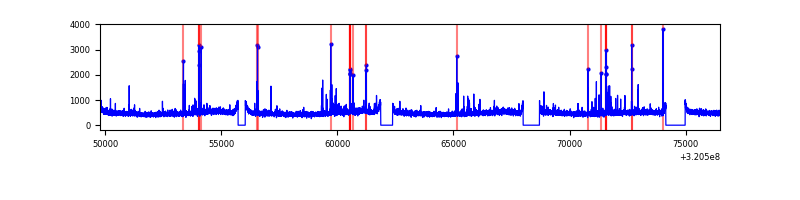 |
| C | 26700 | 24339 | 14 | 14 | 0.05% | 0.06% | 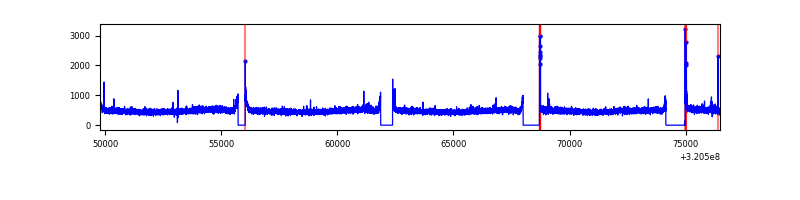 |
| D | 26700 | 24339 | 1217 | 1217 | 4.56% | 5.00% | 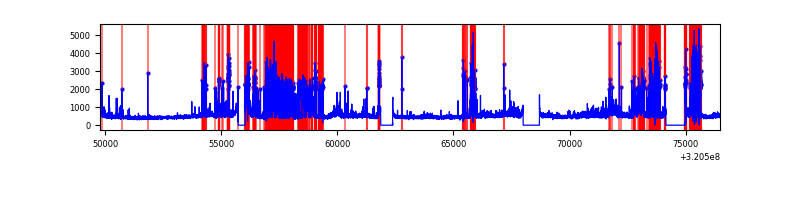 |
Top three noisy pixels from each quadrant. If the there are fewer than three noisy pixels in the level2.evt file, extra rows are filled as -1
| Pixel properties | Quadrant properties | ||||||
|---|---|---|---|---|---|---|---|
| Quadrant | DetID | PixID | Counts | Sigma | Mean | Median | Sigma |
| A | 13 | 254 | 41435 | 64.38 | 2978 | 2910 | 598.4 |
| A | 3 | 137 | 26490 | 39.4 | 2978 | 2910 | 598.4 |
| A | 0 | 226 | 25841 | 38.32 | 2978 | 2910 | 598.4 |
| B | 15 | 33 | 151103 | 264.29 | 2962 | 2888 | 560.8 |
| B | 0 | 197 | 111454 | 193.59 | 2962 | 2888 | 560.8 |
| B | 0 | 189 | 81406 | 140.01 | 2962 | 2888 | 560.8 |
| C | 14 | 238 | 447917 | 664.62 | 2865 | 2881 | 669.6 |
| C | 0 | 10 | 137295 | 200.73 | 2865 | 2881 | 669.6 |
| C | 7 | 247 | 22991 | 30.03 | 2865 | 2881 | 669.6 |
| D | 12 | 218 | 3844913 | 5633.67 | 2819 | 2738 | 682.0 |
| D | 8 | 195 | 1045356 | 1528.76 | 2819 | 2738 | 682.0 |
| D | 12 | 250 | 501947 | 731.98 | 2819 | 2738 | 682.0 |
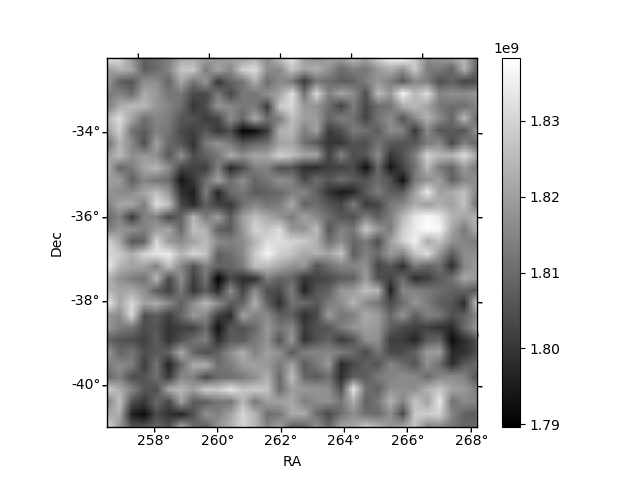
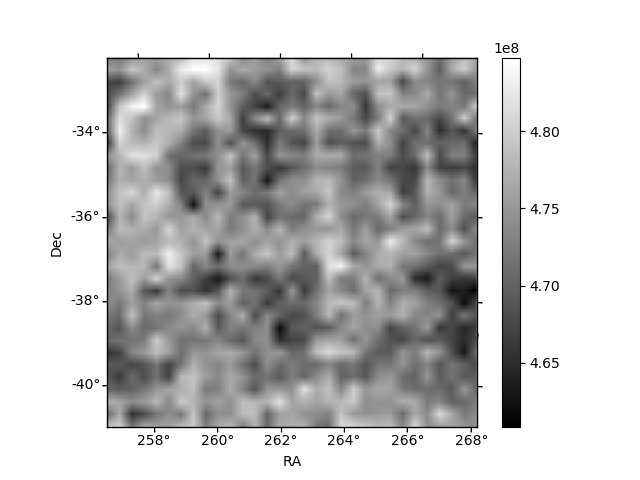
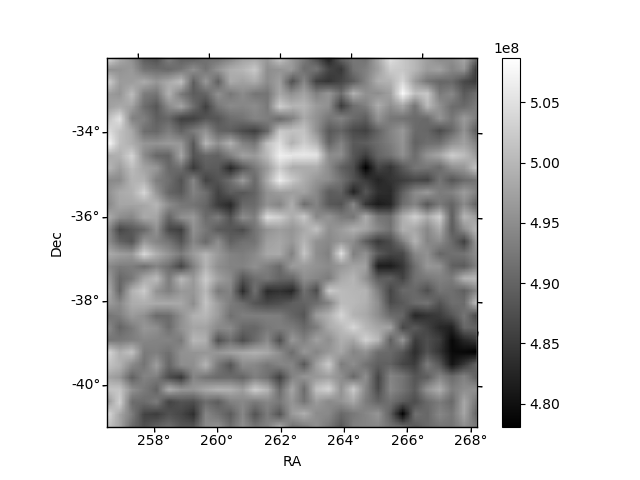
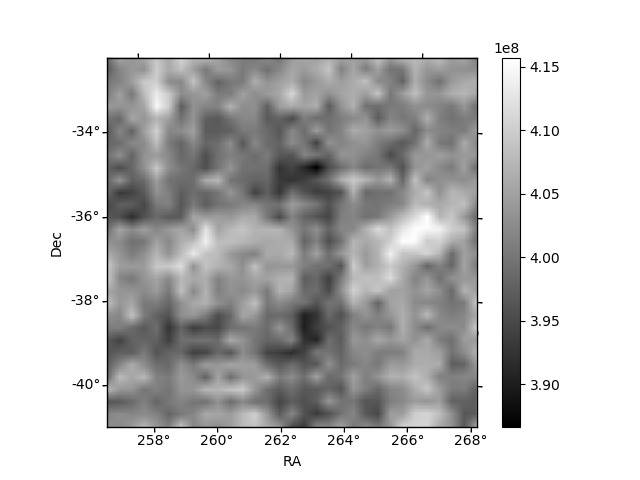
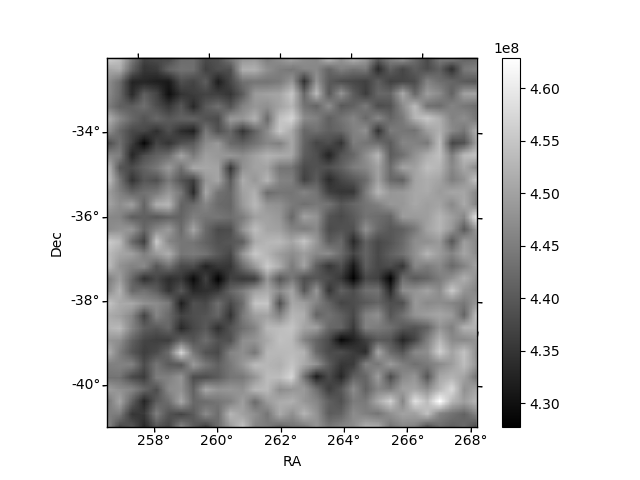
Histogram calculated using DETX and DETY for each event in the final _common_clean file
| Quadrant A | 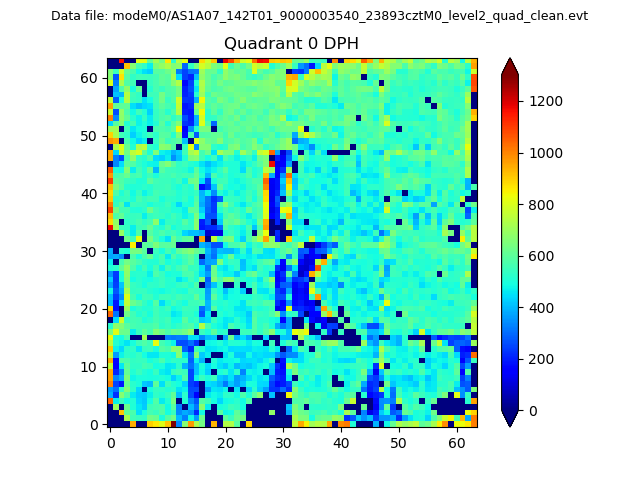 |
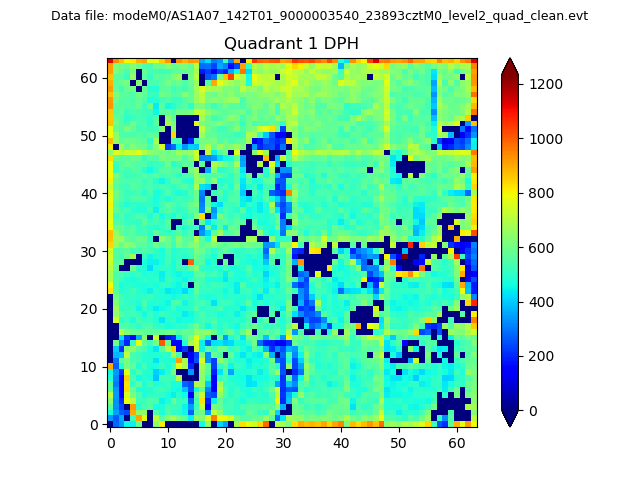 |
Quadrant B |
|---|---|---|---|
| Quadrant D | 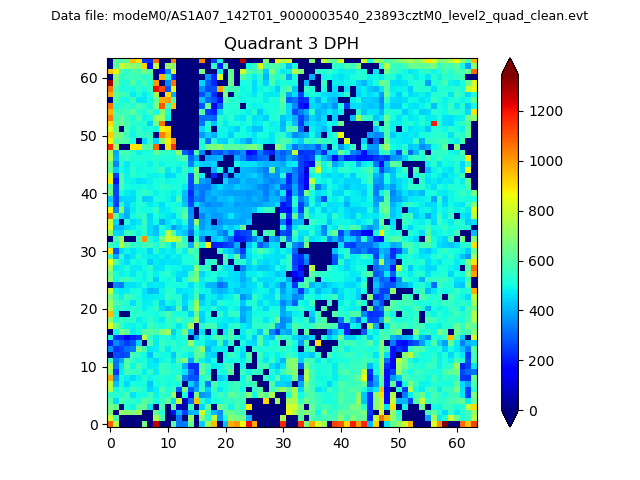 |
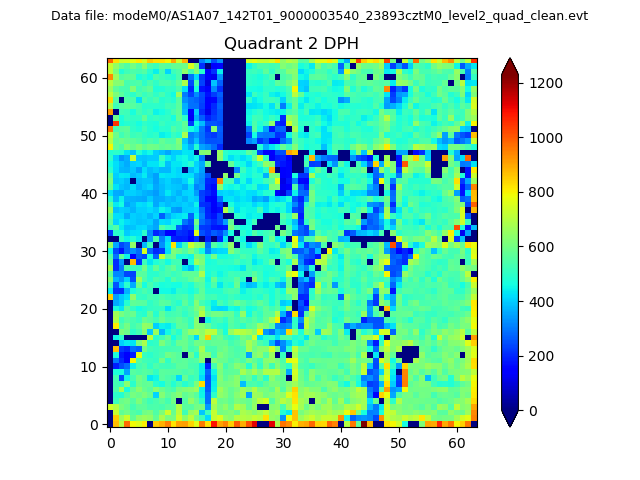 |
Quadrant C |
| Plot type | Count rate plots | Images |
|---|---|---|
| Comparison with Poisson distribution Blue bars denote a histogram of data divided into 1 sec bins. Red curve is a Poisson curve with rate = median count rate of data. |
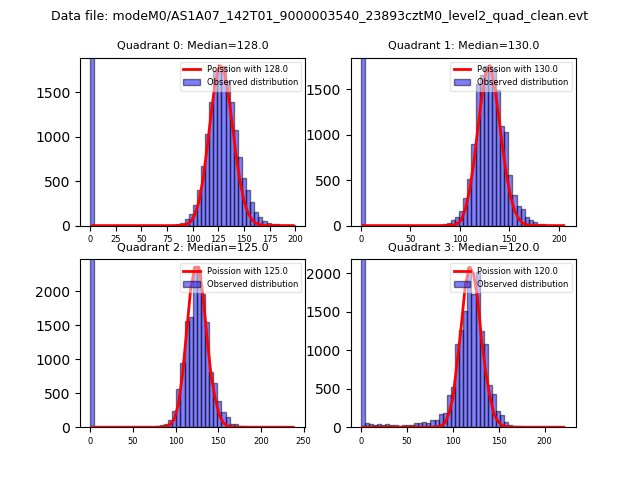 |
 |
| Quadrant-wise count rates Data is divided into 100 sec bins |
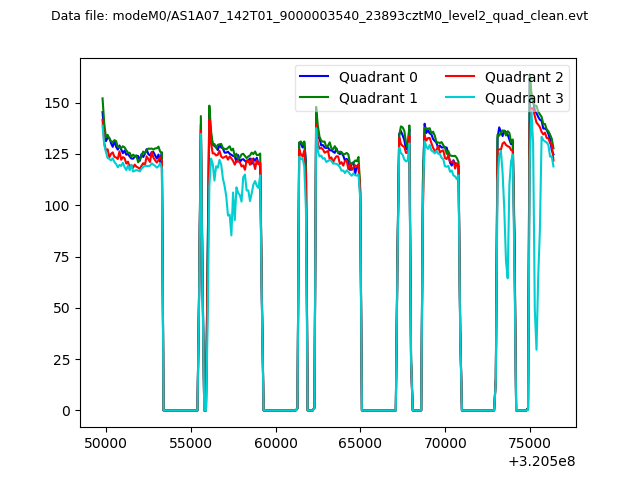 |
|
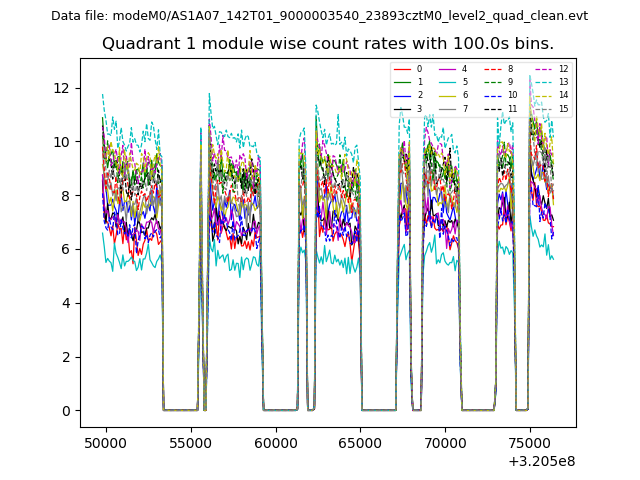
| Module-wise count rates for Quadrant A Data is divided into 100 sec bins |
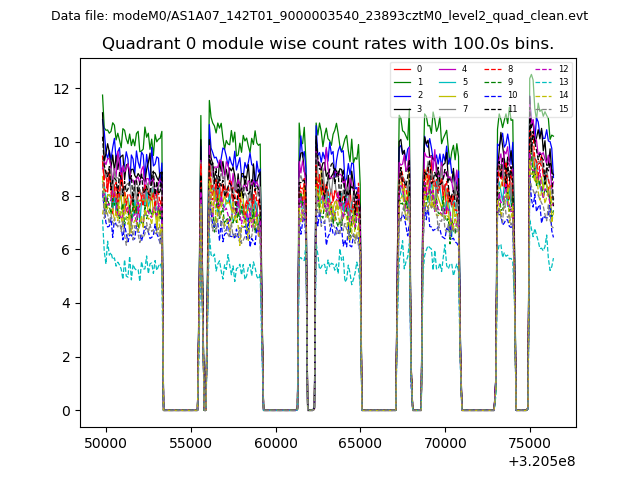 |
 |
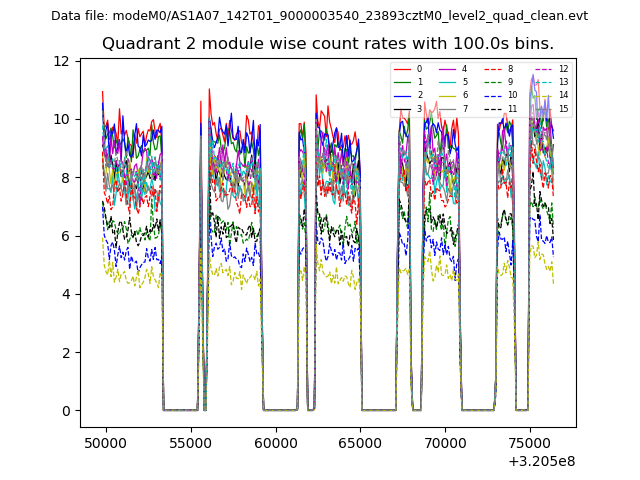
| Module-wise count rates for Quadrant B Data is divided into 100 sec bins |
 |
 |
| Module-wise count rates for Quadrant C Data is divided into 100 sec bins |
 |
 |
| Module-wise count rates for Quadrant D Data is divided into 100 sec bins |
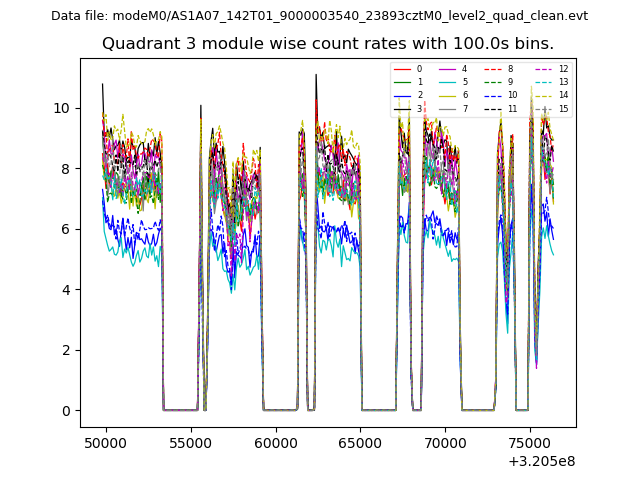 |
 |
| Parameter | Plot |
|---|---|
| CZT HV Monitor | 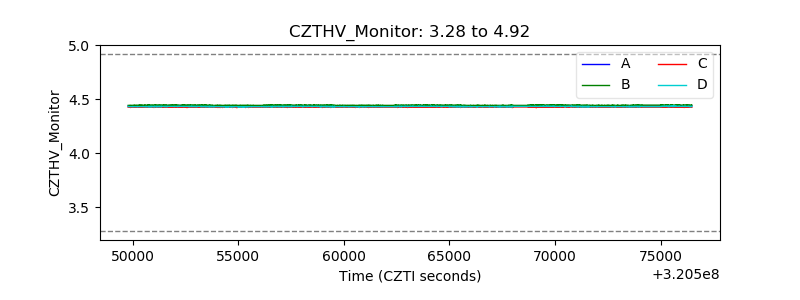 |
| D_VDD | 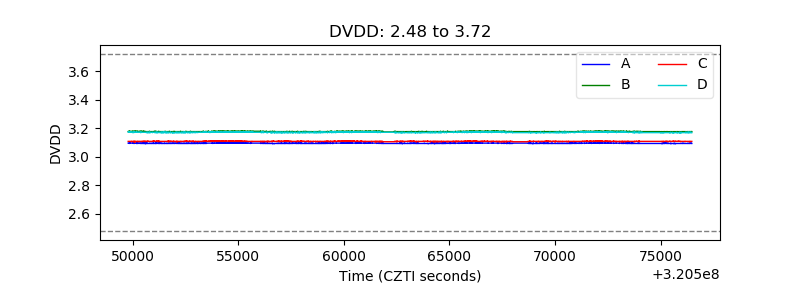 |
| Temperature 1 | 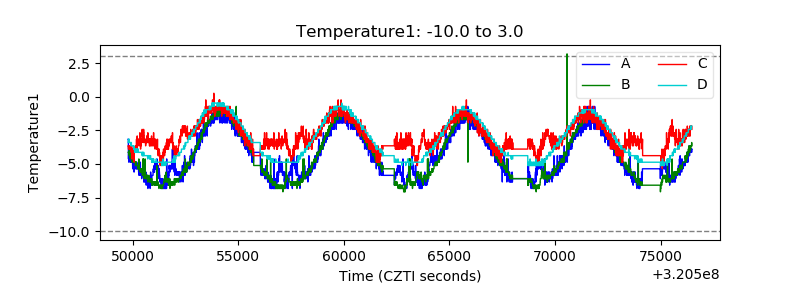 |
| Veto HV Monitor | 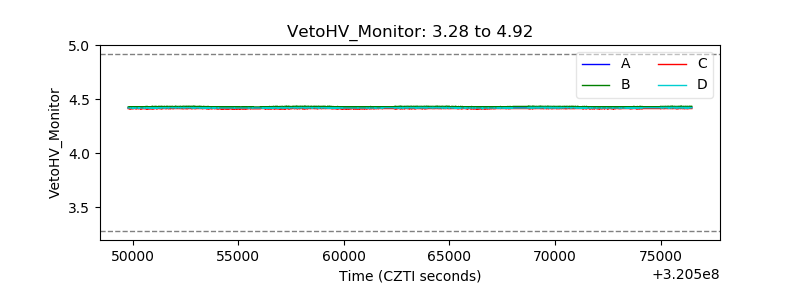 |
| Veto LLD | 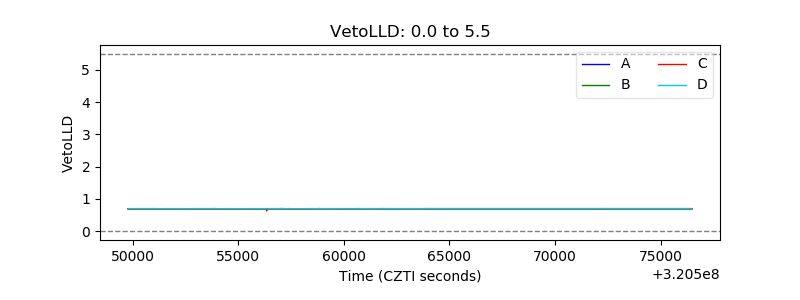 |
| Alpha Counter | 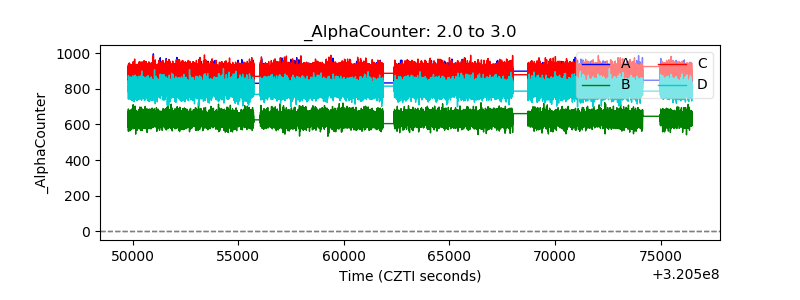 |
| _CPM_Rate | 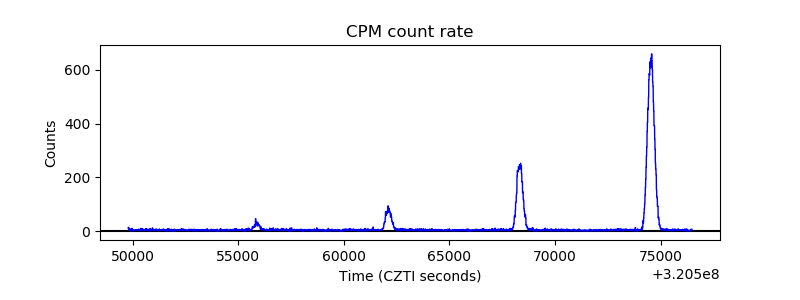 |
| CZT Counter | 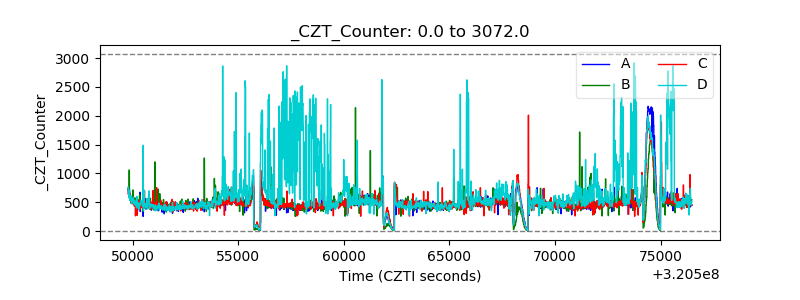 |
| +2.5 Volts monitor |  |
| +5 Volts monitor | 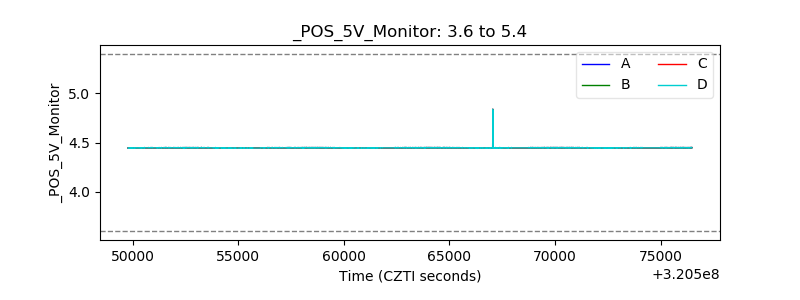 |
| _ROLL_ROT | 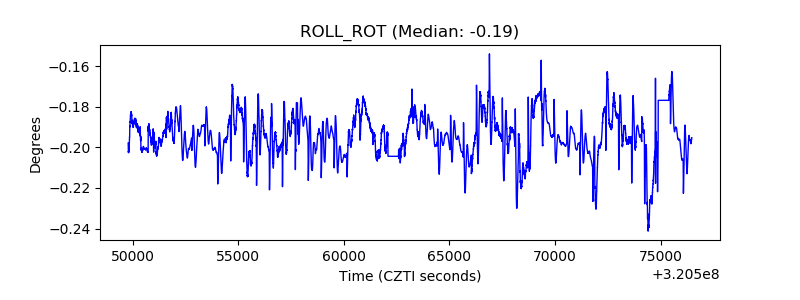 |
| _Roll_DEC | 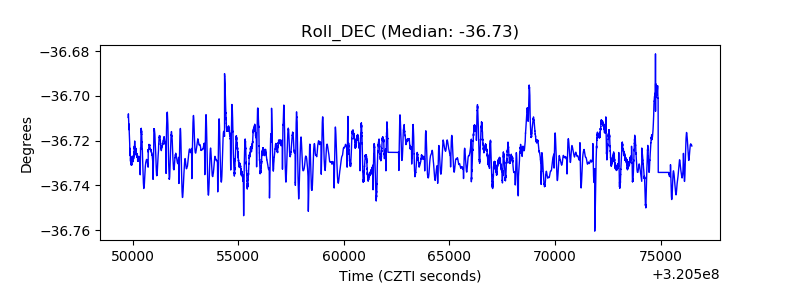 |
| _Roll_RA | 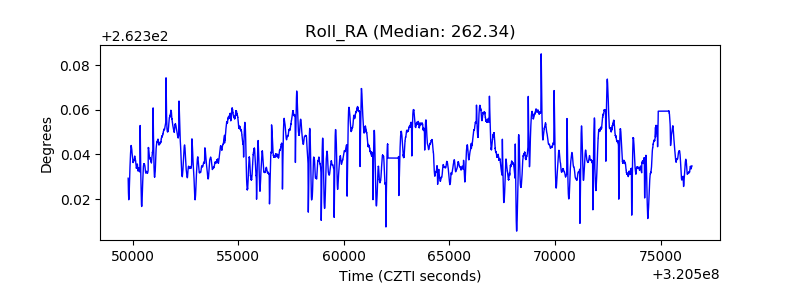 |
| Veto Counter | 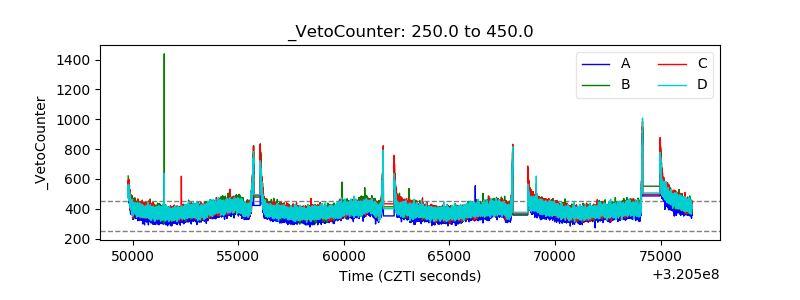 |