| Param | Original file | Final file |
|---|---|---|
| Filename | modeM0/AS1A07_142T01_9000003540_23895cztM0_level2.evt | modeM0/AS1A07_142T01_9000003540_23895cztM0_level2_quad_clean.evt |
| Size (bytes) | 823,867,200 | 140,189,760 |
| Size | 785.7 MB | 133.7 MB |
| Events in quadrant A | 5,446,332 | 896,565 |
| Events in quadrant B | 5,625,057 | 906,397 |
| Events in quadrant C | 5,555,719 | 855,997 |
| Events in quadrant D | 7,581,556 | 827,408 |
| Mode M9 | |||
|---|---|---|---|
| Quadrant | BADHDUFLAG | Total packets | Discarded packets |
| A | 0 | 22 | 0 |
| B | 0 | 22 | 0 |
| C | 0 | 22 | 0 |
| D | 0 | 22 | 0 |
| Mode M0 | |||
|---|---|---|---|
| Quadrant | BADHDUFLAG | Total packets | Discarded packets |
| A | 0 | 23025 | 2 |
| B | 0 | 23455 | 2 |
| C | 0 | 23277 | 2 |
| D | 0 | 29772 | 2 |
| Mode SS | |||
|---|---|---|---|
| Quadrant | BADHDUFLAG | Total packets | Discarded packets |
| A | 0 | 224 | 0 |
| B | 0 | 224 | 0 |
| C | 0 | 224 | 0 |
| D | 0 | 224 | 0 |
| Quadrant | Total seconds | Saturated seconds | Saturation percentage |
|---|---|---|---|
| A | 10967 | 72 | 0.656515% |
| B | 10968 | 89 | 0.811451% |
| C | 10968 | 141 | 1.285558% |
| D | 10968 | 443 | 4.039023% |
Noise dominated data is calculated using 1-second bins in cleaned event files. If a bin has >2000 counts, and if more than 50% of those come from <1% of pixels, then it is considered to be noise-dominated and hence unusable.
| Quadrant | # 1 sec bins | Bins with >0 counts | Bins with >2000 counts | High rate bins dominated by noise | Noise dominated (total time) | Noise dominated (detector-on time) | Marked lightcurve |
|---|---|---|---|---|---|---|---|
| A | 13172 | 10968 | 0 | 0 | 0.00% | 0.00% | 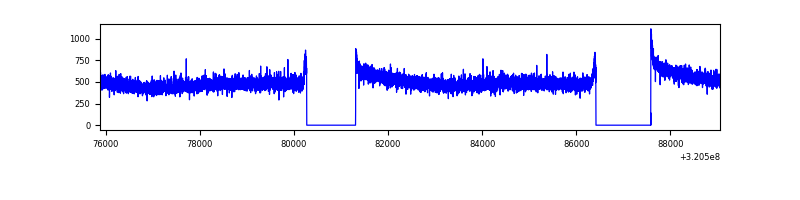 |
| B | 13173 | 10970 | 3 | 3 | 0.02% | 0.03% | 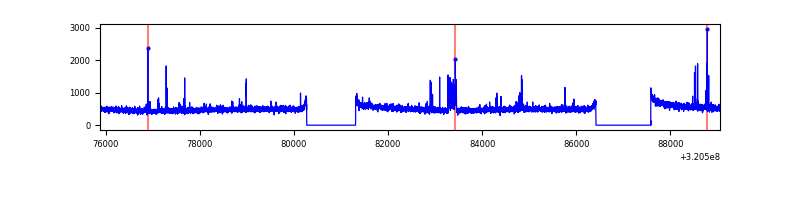 |
| C | 13173 | 10969 | 3 | 3 | 0.02% | 0.03% | 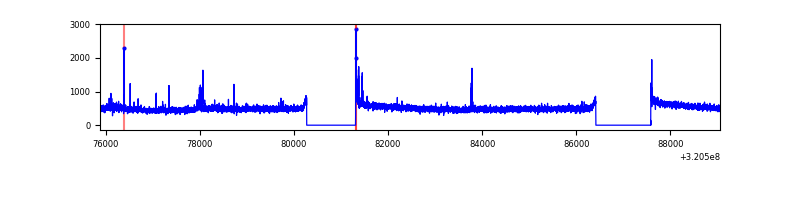 |
| D | 13173 | 10970 | 214 | 214 | 1.62% | 1.95% | 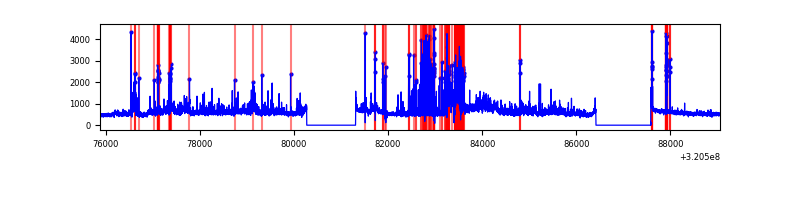 |
Top three noisy pixels from each quadrant. If the there are fewer than three noisy pixels in the level2.evt file, extra rows are filled as -1
| Pixel properties | Quadrant properties | ||||||
|---|---|---|---|---|---|---|---|
| Quadrant | DetID | PixID | Counts | Sigma | Mean | Median | Sigma |
| A | 13 | 254 | 17481 | 57.27 | 1411 | 1382 | 281.1 |
| A | 0 | 226 | 12506 | 39.57 | 1411 | 1382 | 281.1 |
| A | 3 | 137 | 11944 | 37.57 | 1411 | 1382 | 281.1 |
| B | 15 | 33 | 99724 | 378.95 | 1391 | 1360 | 259.6 |
| B | 12 | 111 | 31137 | 114.72 | 1391 | 1360 | 259.6 |
| B | 11 | 111 | 27650 | 101.28 | 1391 | 1360 | 259.6 |
| C | 14 | 238 | 215241 | 695.1 | 1336 | 1347 | 307.7 |
| C | 0 | 10 | 125883 | 404.71 | 1336 | 1347 | 307.7 |
| C | 7 | 247 | 10050 | 28.28 | 1336 | 1347 | 307.7 |
| D | 12 | 218 | 1157954 | 3540.85 | 1351 | 1313 | 326.7 |
| D | 8 | 195 | 883125 | 2699.51 | 1351 | 1313 | 326.7 |
| D | 12 | 250 | 126612 | 383.58 | 1351 | 1313 | 326.7 |
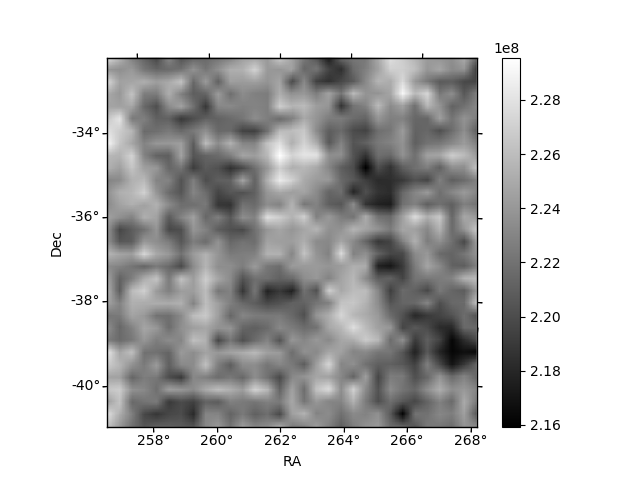
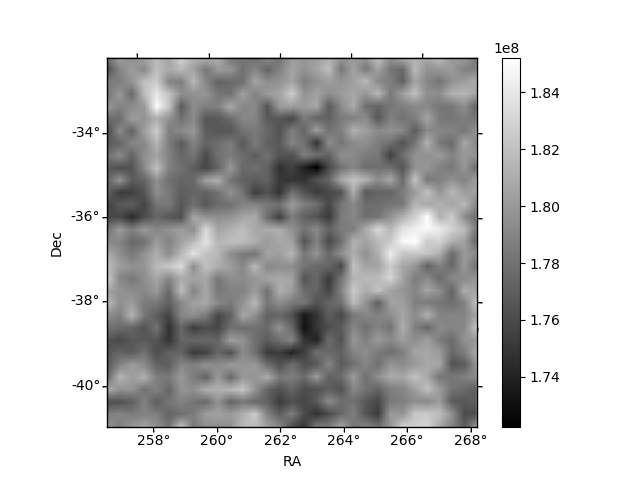
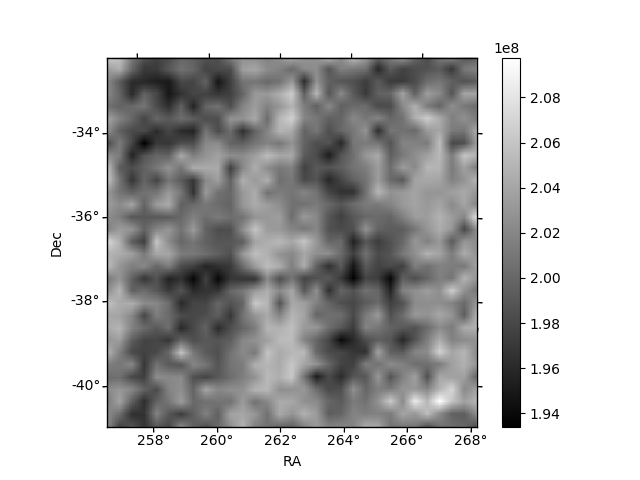
Histogram calculated using DETX and DETY for each event in the final _common_clean file
| Quadrant A | 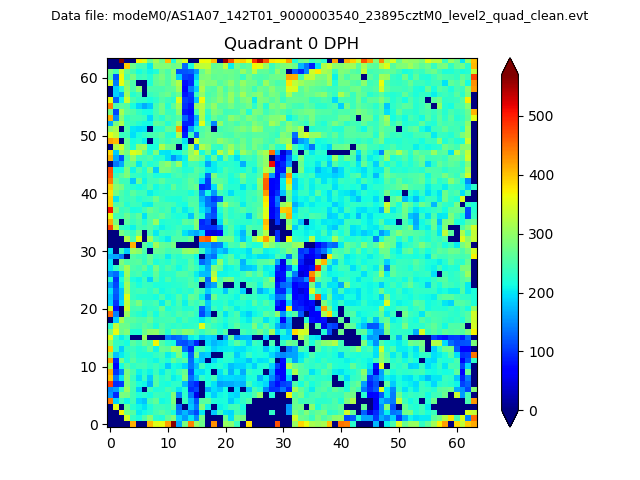 |
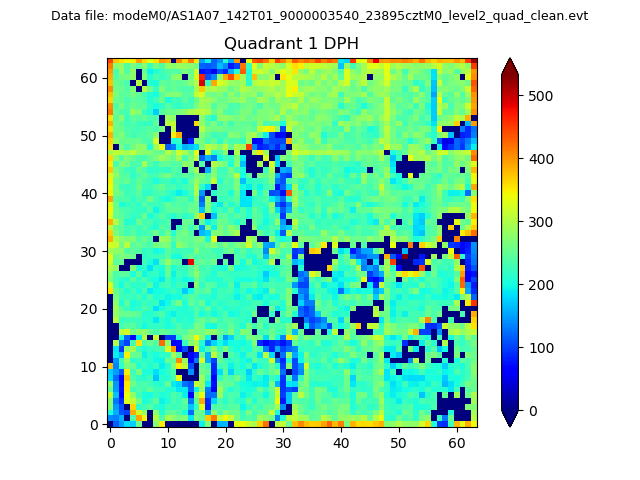 |
Quadrant B |
|---|---|---|---|
| Quadrant D | 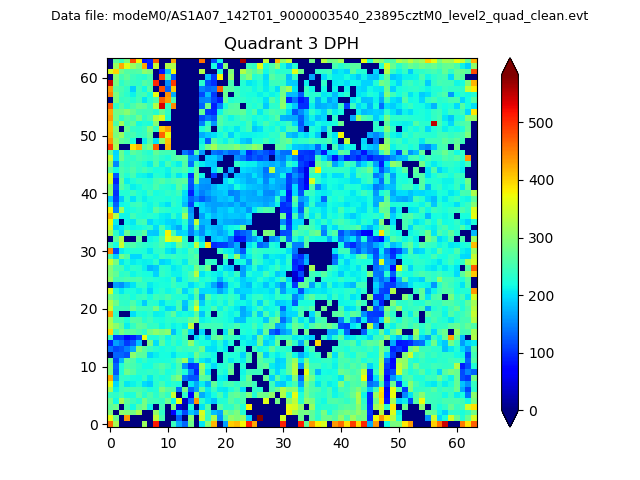 |
 |
Quadrant C |
| Plot type | Count rate plots | Images |
|---|---|---|
| Comparison with Poisson distribution Blue bars denote a histogram of data divided into 1 sec bins. Red curve is a Poisson curve with rate = median count rate of data. |
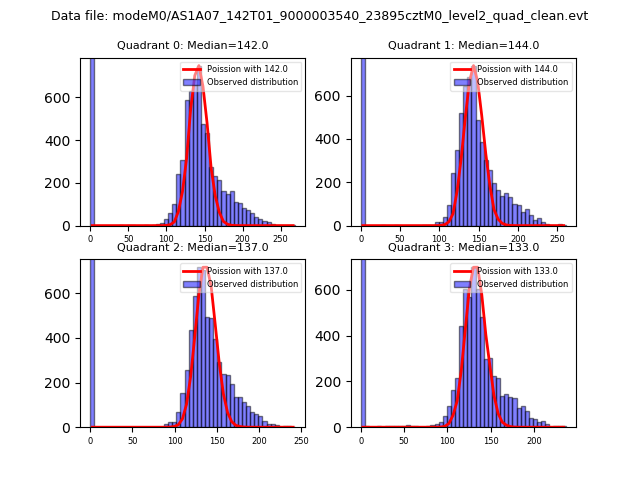 |
 |
| Quadrant-wise count rates Data is divided into 100 sec bins |
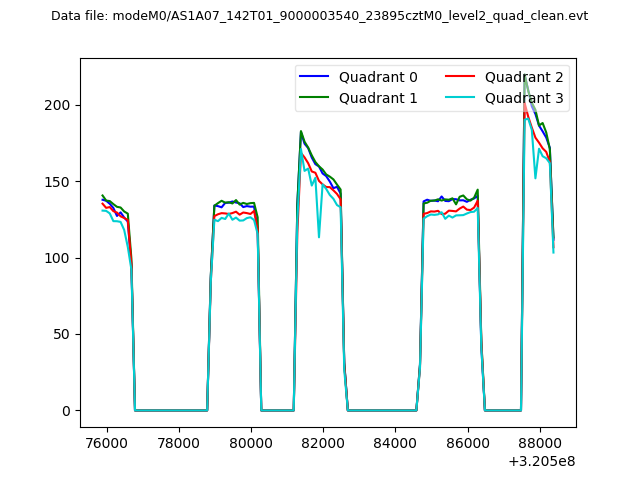 |
|
| Module-wise count rates for Quadrant A Data is divided into 100 sec bins |
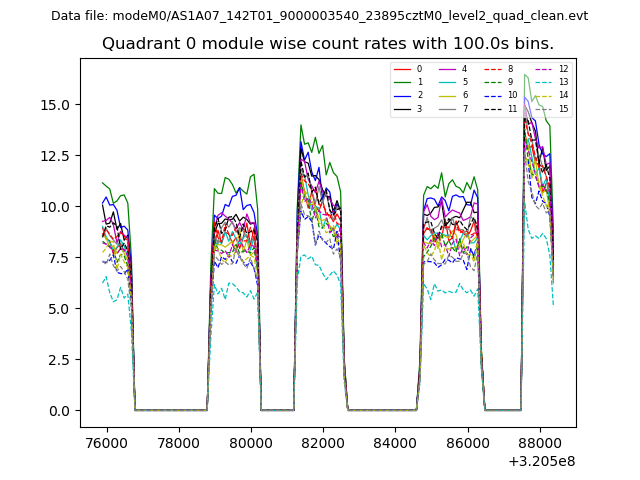 |
 |
| Module-wise count rates for Quadrant B Data is divided into 100 sec bins |
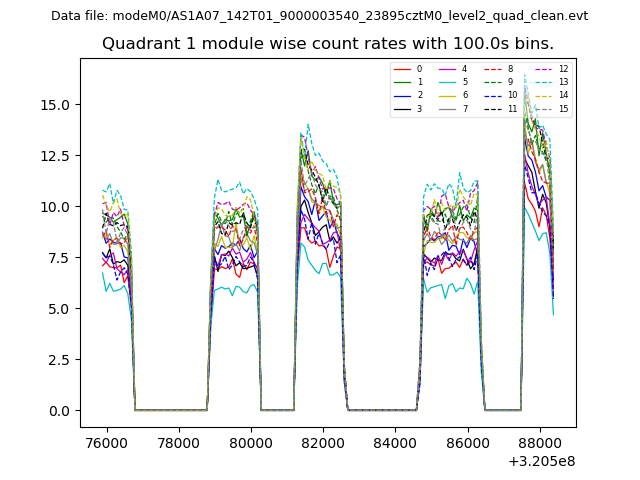 |
 |
| Module-wise count rates for Quadrant C Data is divided into 100 sec bins |
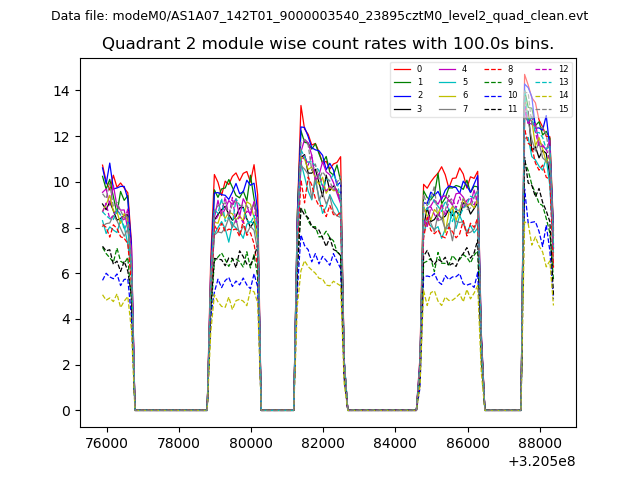 |
 |
| Module-wise count rates for Quadrant D Data is divided into 100 sec bins |
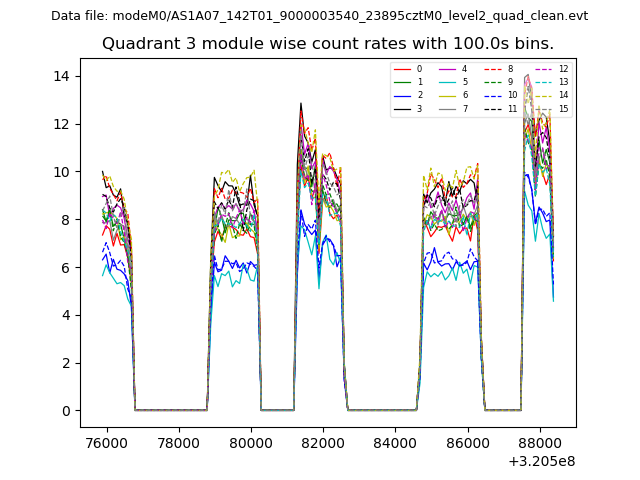 |
 |
| Parameter | Plot |
|---|---|
| CZT HV Monitor | 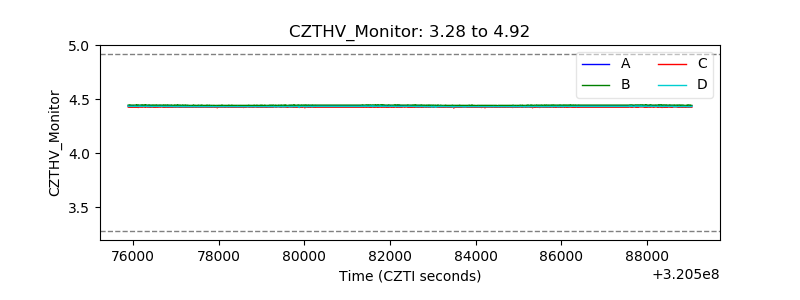 |
| D_VDD | 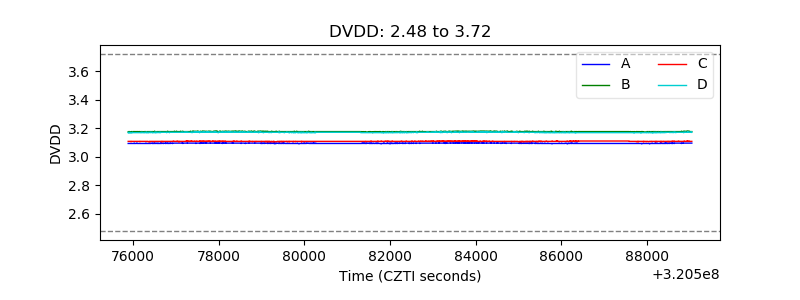 |
| Temperature 1 | 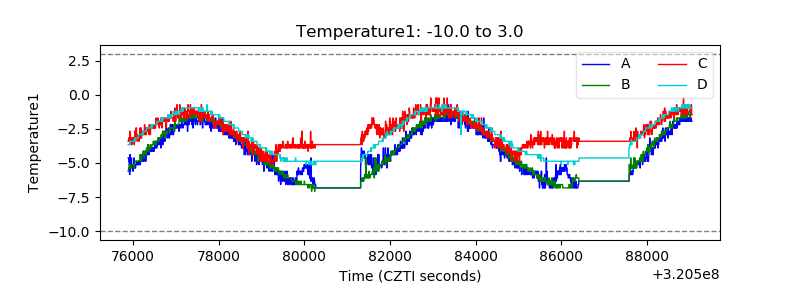 |
| Veto HV Monitor | 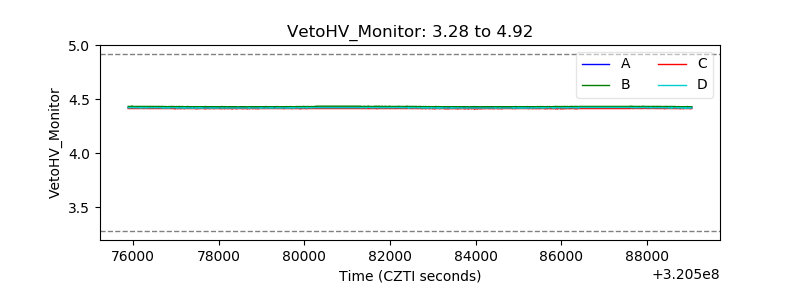 |
| Veto LLD | 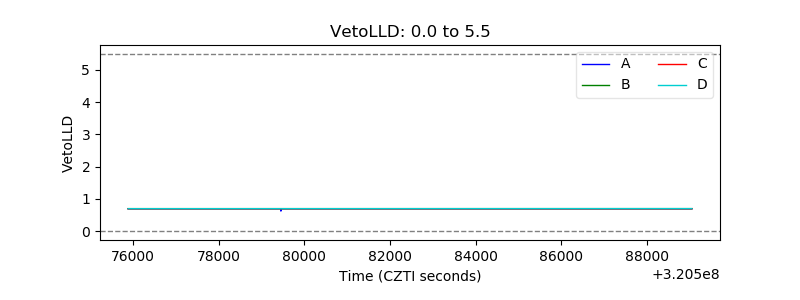 |
| Alpha Counter | 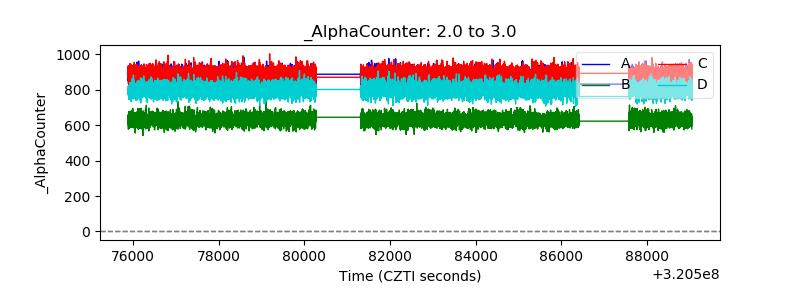 |
| _CPM_Rate | 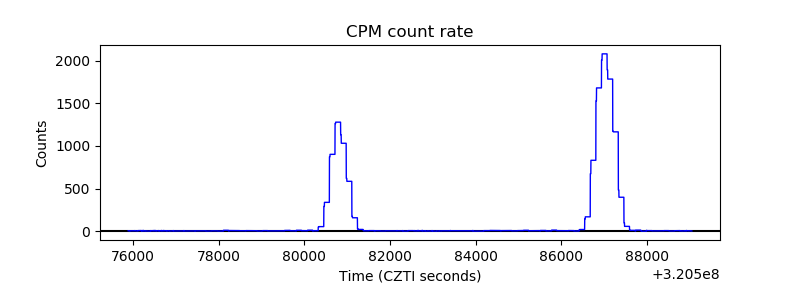 |
| CZT Counter |  |
| +2.5 Volts monitor |  |
| +5 Volts monitor | 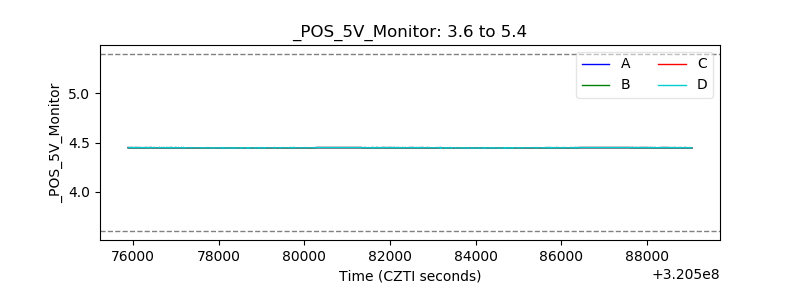 |
| _ROLL_ROT | 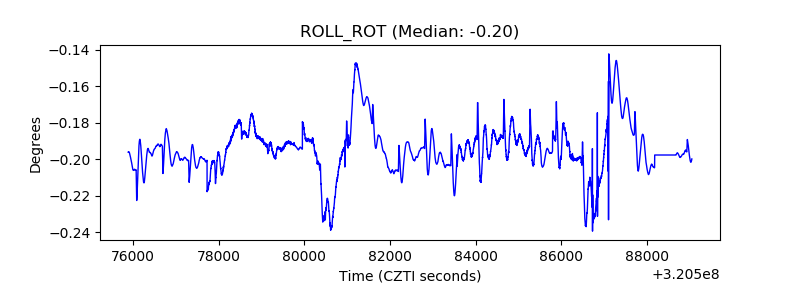 |
| _Roll_DEC | 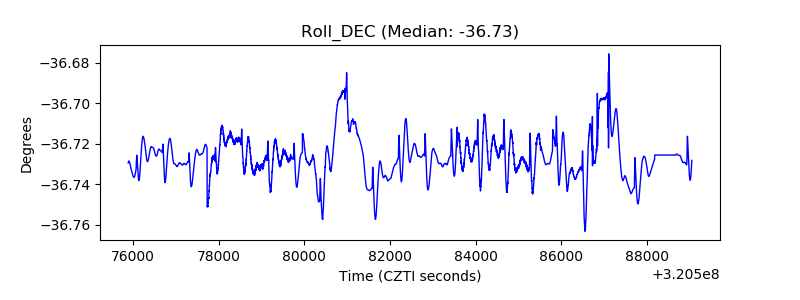 |
| _Roll_RA | 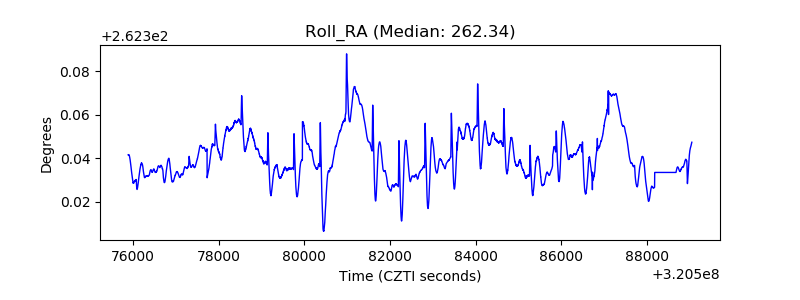 |
| Veto Counter | 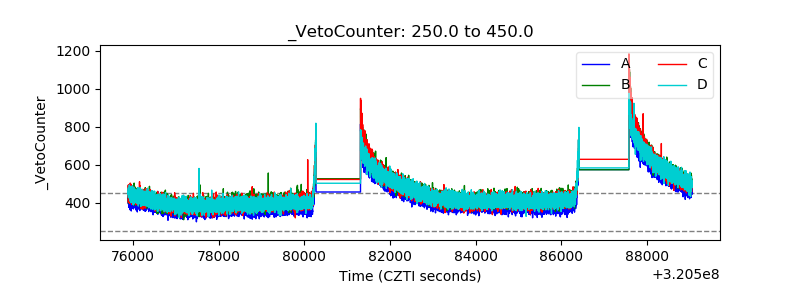 |